Extending MarvelChart
It is possible to integrate new Indicators and Trading Systems into MarvelChart, using the provided wizards, or by creating .NET Core 8.0 Class Libraries independently and copying them into the MarvelChart documents folder where the application searches for extension files. MarvelChart provides a wizard to create new Indicators and one to create new Trading Systems.
It is also possible to import or export indicators and trading systems, both in source code form and in compiled binary file form.
Indicators
MarvelChart allows you to create custom indicators through the use of .NET Core 8.0 Class Libraries. Each indicator is made up of a .NET class, which to be identified as such must derive from the Indicator class provided by MarvelChart in the NetScript namespace. It is therefore possible to create new indicators either by following the wizard integrated into MarvelChart, or by creating a Class Library independently, placing the resulting assembly in the folder:
New Indicator Wizard
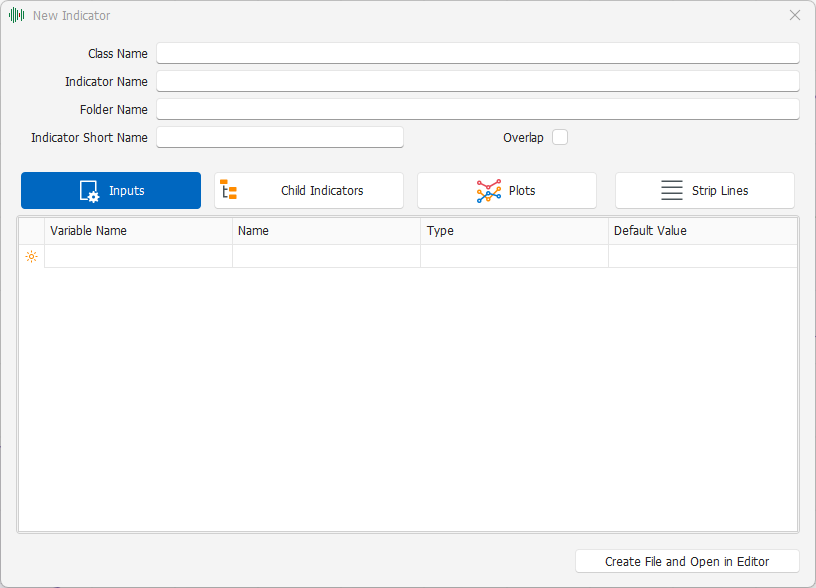
The wizard for creating new Indicators consists of a window that requests essential information about the new indicator.
The window has the fields in the upper part to enter the values that identify the new indicator, while in the central part it is divided into different sections. The information that identifies the new indicator consists of the fields:
Class Name - Name of the class of the new indicator, must be a unique text;
Indicator Name - Name of the new indicator, which represents the text that will be visible in the Indicators menu of MarvelChart;
Folder Name - Name of the folder in which to add the new indicator entry in the Indicators menu of MarvelChart;
Indicator Short Name - Short name of the indicator, usually an acronym is used as a short name, such as SMA as an abbreviation for Simple Moving Average. This name is used when the indicator is added to the panel headers;
Overlap - Checkbox, if active the indicator will be added in overlay to the historical series on the same panel of the Chart, while if turned off the indicator will be added in a separate panel on the Chart.
The sections in the central part of the window group the settings relating to:
Inputs - Input parameters of the indicator;
Child Indicators - Any indicators and calculation functions that the new indicator uses in the calculation procedure. For example, the Bollinger Bands indicator uses Moving Average and Standard Deviation as Child Indicators;
Plots - Indicator outputs;
Strip Lines - Indicator outputs with constant value, which can usually be used to display values such as OverBought or OverSold.
Once all the settings are completed, by clicking on the Create File and Open button in Editor, MarvelChart will create the new indicator file in C# language and open the development environment where you can write the code.
Inputs

In this section, the input parameters of the indicator can be defined. For each input parameter, the following values must be defined in the table:
Variable Name - Name of the variable used within the code of the new indicator to contain the value of the input parameter. It must be a unique text within the indicator;
Name - Name displayed in the MarvelChart windows to identify the input parameter of the indicator;
Type - Drop-down box where you can select the type of data associated with the input parameter;
Default Value - Default value of the input parameter, automatically assigned to the corresponding variable when the indicator is added to the Chart.
Child Indicators
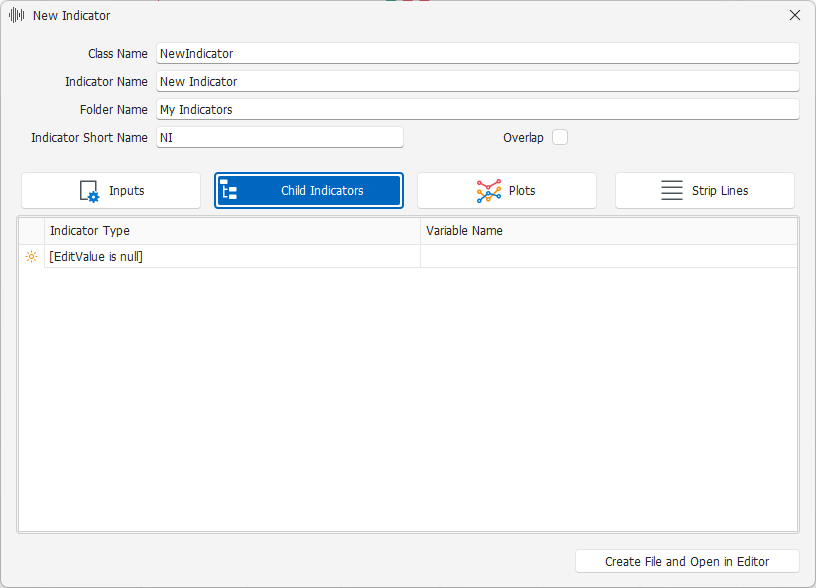
In this section, you can define the Child Indicators, that is, the indicators and the related calculation functions that the new indicator you are creating will use in its algorithm. For each Child Indicator, the following values must be defined in the table:
Indicator Type - Drop-down box where you can select the type of Child Indicator that you want to use in the calculation of the new indicator;
Variable Name - Name of the variable associated with the Child Indicator. It must be a unique text within the indicator;
Plots
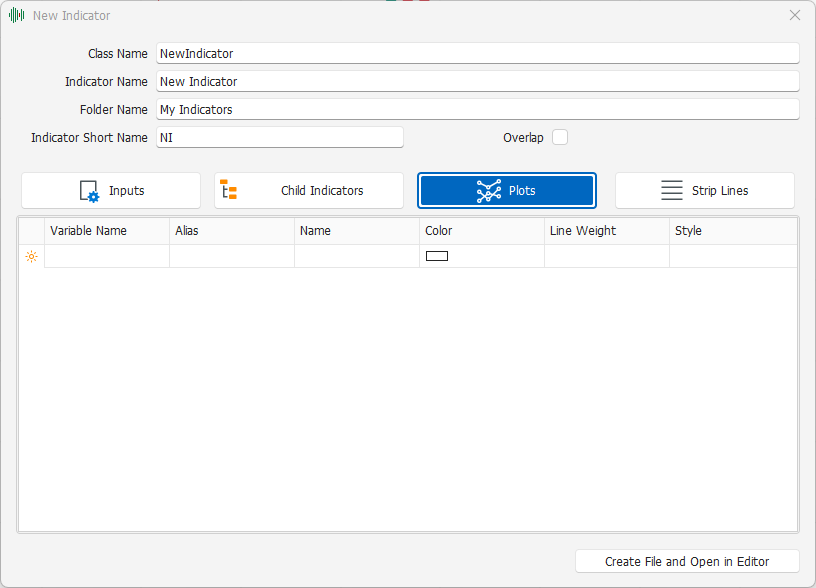
In the Plots section, you can define the output values of the new indicator. For each Plot, the following values must be defined in the table:
Variable Name - Name of the variable associated with the output of the new indicator. It must be a unique text within the indicator;
Alias - Alias name of the output. When the new indicator is used as a Child Indicator within other indicators, the Alias provides quick access to the calculated values for the output;
Name - Name of the output, this is the text displayed in the MarvelChart windows to identify the output;
Color - Default color of the output. It can be empty, in which case MarvelChart axis will automatically change the color when the indicator is added to the Chart;
Line Weight - Thickness or size of the line, histogram or output points;
Style - Drop-down box to select the output drawing style. The available options are:
Solid - Solid line;
Dash - Dashed line;
Dot - Dotted line;
DashDot - Dashed and dotted line;
DashDotDot - Dashed and dotted line, composed of a dash and two dots;
Point - Point;
Histogram - Vertical histogram drawn starting from the zero value of the Y-axis of the chart panel;
PointToPoint - Line that connects two non-zero points, but which can also be non-consecutive.
Strip Lines
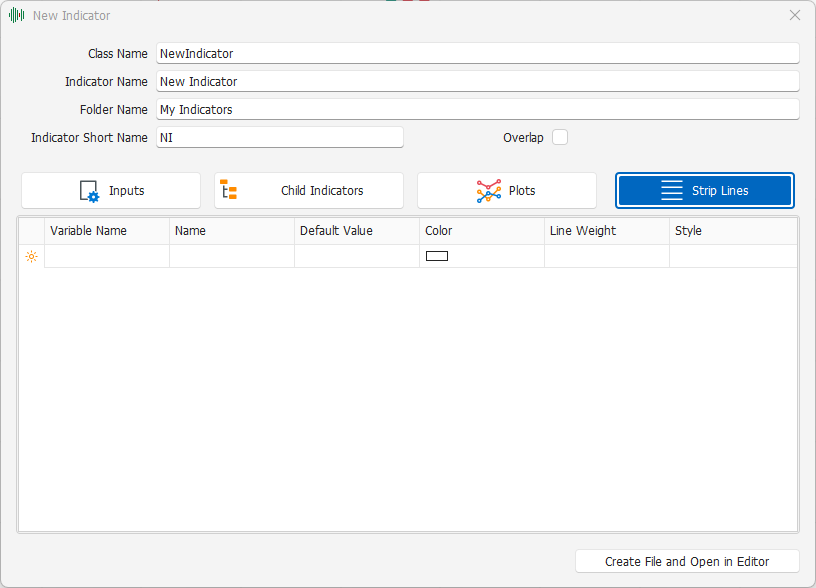
Strip Lines are very similar to Plots, but they differ in that Strip Lines have a single constant value for all points in the Chart, while Plots can have a different value for each point in the Chart. For each Strip Line, you need to define the following values in the table:
Variable Name - Name of the variable associated with the Strip Line of the new indicator. It must be a unique text within the indicator;
Name - Name of the Strip Line, this is the text displayed in the MarvelChart windows to identify the Strip Line;
Default Value - Default value of the Strip Line, automatically assigned to the corresponding variable when the indicator is added to the Chart;
Color - Default color of the Strip Line. It can be empty, in which case MarvelChart will automatically assign a color when the indicator is added to the Chart;
Line Weight - Thickness or size of the line, histogram or points of the Strip Line;
Style - Drop-down box through which to select the drawing style of the Strip Line. The available alternatives are:
Solid - Solid line;
Dash - Dashed line;
Dot - Dotted line;
DashDot - Dashed and dotted line;
DashDotDot - Dashed and dotted line, composed of a dash and two dots;
Point - Point;
Histogram - Vertical histogram drawn starting from the zero value of the Y-axis of the chart panel;
PointToPoint - Line that joins two non-zero points, but which can also be non-consecutive.
Indicator class methods
When creating new indicators, it is generally sufficient to implement via override only two methods of the Indicator class, OnCreate and OnCalculate.
OnCreate
public virtual void OnCreate(IScriptData data, IVariablesFactory variablesFactory, IPlotFactory plotFactory)
This method is called by MarvelChart when the indicator is added to the Chart, or in any case when it is necessary to initialize a new instance of the indicator. It can be used to initialize variables, Inputs (in particular the time series used in the Inputs), Plots, Strip Lines, Child Indicators and in general any other object used in the indicator that needs initialization. The method has the parameters:
data- Contains the working data of the indicator, such as the time series and the Chart symbol;variablesFactory- Used to initialize variables that contain data series;plotFactory- Used to initialize plots and strip lines;
Initialization of variables
If the indicator requires variables that store the values bar by bar, you can use objects of type IVariableSeries<T>, initializing them in the OnCreate method, as in the following example:
this.m_variable = variablesFactory.CreateVariableSeries<double>(this);
Initialization of Inputs
When the indicator requires Inputs, their values can be initialized in the OnCreate method. It is advisable to always initialize the Inputs related to historical series, as in the following example:
if (this.Price == null) this.Price = data?.Bars?.Close;
Initializing Plots
All indicators must have at least one Plot, i.e. one output. Plots can be initialized as in the following example:
this.m_average = plotFactory.CreatePlot(this, "Average", null, 1, PlotStyle.Solid);
Initializing Strip Lines
Even the Strip Lines can be initialized in the OnCreate method, for example like this:
this.m_overSold = plotFactory.CreateStripLine(this, "Over-Sold", null, 1, PlotStyle.Dash);
Child Indicators Initialization
Child Indicators initialization is simply a matter of calling the constructor of the relevant class, passing the value this as the parameter parent, as in the following example:
this.m_ma = new VariableTypeMovingAverage(this);
OnCalculate
public virtual void OnCalculate(IScriptData data)
The OnCalculate method is the one that MarvelChart uses to calculate the values of the indicators. It is the main method of each indicator: the calculation algorithm must be implemented in this method.
OnNewBar
public virtual void OnNewBar(IScriptData data)
This method is called by MarvelChart every time a new bar is added to the historical series. It is usually not necessary to implement an override of this method, as MarvelChart automatically extends the length of the data series related to Variables, Plots and Child Indicators initialized in the OnCreate method by passing the value this as the parent parameter.
OnDestroy
public virtual void OnDestroy(IScriptsContext context)
This method is called by MarvelChart when the indicator is deleted from the Chart or in any case when the instance is released. Normally it is not necessary to implement an override of this method, because if you have initialized Variables, Plots, Strip Lines and Child Indicators through the OnCreate method passing the value this as the parent parameter, all the related instances will be automatically released by MarvelChart. Implementing an override of this method may be necessary in case it is necessary to release other objects initialized in the OnCreate method.
Drawings
public Guid AddChartDrawing(ChartDrawing chartDrawing) public void DeleteChartDrawing(Guid objectId)
MarvelChart allows you to add Drawings to the Chart via code in the indicators. The Indicator class provides 2 methods, one to add a Drawing to the Chart (AddChartDrawing), the other to remove it (DeleteChartDrawing). It is not necessary to call DeleteChartDrawing in the OnDestroy method: MarvelChart automatically connects the Drawings with the indicator that added them to the Chart, removing the indicator also removes the Drawings created by it from the Chart. Drawings are described by classes, one for each different type of Drawing, which derive from the base class ChartDrawing. Drawing classes are defined in the namespace NetScript.ChartDrawings. Each Drawing has a different set of properties based on its characteristics. The available Drawing types are:
Buy Symbol
Example: Add a Buy Symbol to the Chart.
Guid symbolId = this.AddChartDrawing(new BuySymbol()); Properties: - Position - X and Y coordinates of the Drawing;
Title- Text to associate with the Drawing.
Sell Symbol
Example: Add a Sell Symbol to the Chart.
Guid symbolId = this.AddChartDrawing(new SellSymbol());
Properties:
Position- X and Y coordinates of the Drawing;Title- Text to associate with the Drawing.
Exit Symbol
Example: Add an Exit Symbol to the Chart.
Guid symbolId = this.AddChartDrawing(new ExitSymbol());
Properties:
Position- X and Y coordinates of the Drawing;Title- Text to associate with the Drawing.
Label
Example: add a Label to Chart.
Guid symbolId = this.AddChartDrawing(new Label());
Properties:
Position- X and Y coordinates of the Drawing;Text- Text to associate with the Drawing.TextSettings- Settings related to the text of the Drawing, such as Font, color and alignment.
Horizontal Line
Example: Add a Horizontal Line to the Chart.
Guid symbolId = this.AddChartDrawing(new HorizontalLine());
Properties:
Price- Y coordinate of the Drawing;PlotSettings- Settings related to the drawing mode of the Drawing, such as line type, color and thickness.
Vertical Line
Example: Add a Vertical Line to the Chart.
Guid symbolId = this.AddChartDrawing(new VerticalLine());
Properties:
X- X coordinate of the Drawing;PlotSettings- Settings related to the Drawing's drawing mode, such as line type, color and thickness;FontSettings- Settings related to the Drawing's Font.
Trend Line
Example: add a Trend Line to the Chart.
Guid symbolId = this.AddChartDrawing(new TrendLine());
Properties:
Point1- Control point 1 of the Drawing;Point2- Control point 2 of the Drawing;PlotSettings- Settings related to the Drawing's drawing mode, such as line type, color and thickness.
Info Line
Example: add an Info Line to the Chart.
Guid symbolId = this.AddChartDrawing(new InfoLine());
Properties:
Point1- Control point 1 of the Drawing;Point2- Control point 2 of the Drawing;PlotSettings- Settings related to the Drawing mode, such as line type, color and thickness;ElapsedTime- Toggles the drawing of the time elapsed between the 2 control points of the line;ElapsedBars- Toggles the drawing of the number of bars elapsed between the 2 control points of the line;DifferenceInPercentage- Toggles the drawing of the difference in percentage value on the Y-axis of the 2 control points of the line;DifferenceInPoints- Toggles the drawing of the difference in points value on the Y-axis of the 2 control points of the line;TextSettings- Settings related to the text of the Drawing, such as Font, color and alignment.
Alert Line
Example: add an Alert Line to the Chart.
Guid symbolId = this.AddChartDrawing(new AlertLine());
Properties:
Price- Y-coordinate of the Drawing;PlotSettings- Settings related to the Drawing mode, such as line type, color and thickness;Direction- Direction of the line that triggers the Alert;Enabled- Enables/Disables the Alert.
Ray Line
Example: add a Ray Line to the Chart.
Guid symbolId = this.AddChartDrawing(new RayLine());
Properties:
Point1- Control point 1 of the Drawing;Point2- Control point 2 of the Drawing;PlotSettings- Settings related to the Drawing mode, such as line type, color and thickness.
Extended Line
Example: Add an Extended Line to the Chart.
Guid symbolId = this.AddChartDrawing(new ExtendedLine());
Properties:
Point1- Control point 1 of the Drawing;Point2- Control point 2 of the Drawing;PlotSettings- Settings related to the drawing mode of the Drawing, such as line type, color and thickness.
Lines Cross
Example: Add a Lines Cross to the Chart.
Guid symbolId = this.AddChartDrawing(new LinesCross());
Properties:
Position- Crossing point of horizontal and vertical lines;PlotSettings- Settings related to the Drawing mode, such as line type, color and thickness;FontSettings- Settings related to the Drawing Font.
Ellipse
Example: Add an Ellipse to the Chart.
Guid symbolId = this.AddChartDrawing(new Ellipse());
Properties:
TopLeft- Control point representing the top left corner of the rectangle in which the ellipse is inscribed;BottomRight- Control point representing the bottom right corner of the rectangle in which the ellipse is inscribed;PlotSettings- Settings related to the Drawing mode, such as line type, color and thickness;Alpha- Transparency of the ellipse area, value between 0 and 255, where 0 means completely transparent and 255 means completely opaque.
Rectangle
Example: add a Rectangle to the Chart.
Guid symbolId = this.AddChartDrawing(new Rectangle());
Properties:
TopLeft- Control point representing the top left corner of the rectangle;BottomRight- Control point representing the bottom right corner of the rectangle;PlotSettings- Settings related to the Drawing mode, such as line type, color and thickness;Alpha- Transparency of the rectangle area, value between 0 and 255, where 0 means completely transparent and 255 means completely opaque.
Poly Line
Example: add a Poly Line to the Chart.
Guid symbolId = this.AddChartDrawing(new PolyLine());
Properties:
Points- List of points that make up the Poly Line;PlotSettings- Settings related to the Drawing mode, such as line type, color and thickness.
Disjoint Channel
Example: Add a Disjoint Channel to the Chart.
Guid symbolId = this.AddChartDrawing(new DisjointChannel());
Properties:
Point1- Control point 1 of the Drawing;Point2- Control point 2 of the Drawing;ChannelHeight- Height of the channel;PlotSettings- Settings related to the drawing mode of the Drawing, such as line type, color and thickness;ChannelAlpha- Transparency of the channel area, value between 0 and 255, where 0 means completely transparent and 255 means completely opaque.
Error Channel
Example: Add an Error Channel to the Chart.
Guid symbolId = this.AddChartDrawing(new ErrorChannel());
Properties:
X1- X coordinate of the first control point of the channel;X2- X coordinate of the second control point of the channel;PlotSettings- Settings related to the Drawing mode, such as line type, color and thickness;Alpha- Transparency of the channel area, value between 0 and 255, where 0 means completely transparent and 255 means completely opaque.
Flat Top/Bottom
Example: Add a Flat Top/Bottom to the Chart.
Guid symbolId = this.AddChartDrawing(new FlatTopBottom());
Properties:
Point1- Control point 1 of the Drawing;Point2- Control point 2 of the Drawing;FlatLineYValue- Y-axis value of the horizontal line of the Drawing;PlotSettings- Settings related to the drawing mode of the Drawing, such as line type, color and thickness;ChannelAlpha- Transparency of the channel area, value between 0 and 255, where 0 means completely transparent and 255 means completely opaque.
Gann Fan
Example: Add a Gann Fan to the Chart.
Guid symbolId = this.AddChartDrawing(new GannFan());
Properties:
Origin- Origin of the Gann Fan;Point2- Control point 2 of the Drawing;PlotSettings- Settings related to the drawing mode of the Drawing, such as line type, color and thickness;Alpha- Transparency of the fan area, value between 0 and 255, where 0 means completely transparent and 255 means completely opaque.
Quadrant Lines
Example: add a Quadrant Lines to the Chart.
Guid symbolId = this.AddChartDrawing(new QuadrantLines());
Properties:
X1- X coordinate of the first control point of the channel;X2- X coordinate of the second control point of the channel;PlotSettings- Settings related to the Drawing mode, such as line type, color and thickness;Alpha- Transparency of the channel area, value between 0 and 255, where 0 means completely transparent and 255 means completely opaque.
Parallel Channel
Example: Add a Parallel Channel to the Chart.
Guid symbolId = this.AddChartDrawing(new ParallelChannel());
Properties:
Point1- Control point 1 of the Drawing;Point2- Control point 2 of the Drawing;ChannelHeight- Height of the channel;PlotSettings- Settings related to the drawing mode of the Drawing, such as line type, color and thickness;ChannelAlpha- Transparency of the channel area, value between 0 and 255, where 0 means completely transparent and 255 means completely opaque.
Pitchfork
Example: Add a Pitchfork to the Chart.
Guid symbolId = this.AddChartDrawing(new Pitchfork());
Properties:
Point1- Control point 1 of the Drawing;Point2- Control point 2 of the Drawing;Point3- Control point 3 of the Drawing;PlotSettings- Settings related to the drawing mode of the Drawing, such as line type, color and thickness;PitchforkAlpha- Transparency of the pitchfork area, value between 0 and 255, where 0 means completely transparent and 255 means completely opaque.
Raff Regression
Example: Add a Raff Regression to the Chart.
Guid symbolId = this.AddChartDrawing(new RaffRegression());
Properties:
X1- X coordinate of the first control point of the channel;X2- X coordinate of the second control point of the channel;PlotSettings- Settings related to the Drawing mode, such as line type, color and thickness;Alpha- Transparency of the channel area, value between 0 and 255, where 0 means completely transparent and 255 means completely opaque.
Speed Lines
Example: Add a Speed Lines to the Chart.
Guid symbolId = this.AddChartDrawing(new SpeedLines());
Properties:
Origin- Origin of the Speed Lines;Point2- Control point 2 of the Drawing;PlotSettings- Settings related to the drawing mode of the Drawing, such as line type, color and thickness;Alpha- Transparency of the fan area, value between 0 and 255, where 0 means completely transparent and 255 means completely opaque.
Tirone Levels
Example: add a Tirone Levels to the Chart.
Guid symbolId = this.AddChartDrawing(new TironeLevels());
Properties:
X1- X coordinate of the first control point of the channel;X2- X coordinate of the second control point of the channel;PlotSettings- Settings related to the Drawing mode, such as line type, color and thickness;Alpha- Transparency of the channel area, value between 0 and 255, where 0 means completely transparent and 255 means completely opaque.
Fibonacci Arcs
Example: Add a Fibonacci Arcs to the Chart.
Guid symbolId = this.AddChartDrawing(new FibonacciArcs());
Properties:
Origin- Origin of the Fibonacci Arcs;Point2- Control point 2 of the Drawing;PlotSettings- Settings related to the Drawing mode, such as line type, color and thickness;SecondaryLinesColor- Color of the secondary lines of the arcs;AreaAlpha- Transparency of the arc area, value between 0 and 255, where 0 means completely transparent and 255 means completely opaque.
Fibonacci Fan
Example: add a Fibonacci Fan to the Chart.
Guid symbolId = this.AddChartDrawing(new FibonacciFan());
Properties:
Origin- Origin of the Fibonacci Fan;Point2- Control point 2 of the Drawing;PlotSettings- Settings related to the drawing mode of the Drawing, such as line type, color and thickness;Alpha- Transparency of the fan area, value between 0 and 255, where 0 means completely transparent and 255 means completely opaque.
Fibonacci Retracements
Example: Add a Fibonacci Retracements to the Chart.
Guid symbolId = this.AddChartDrawing(new FibonacciRetracements());
Properties:
Point1- Control point 1 of the Drawing;Point2- Control point 2 of the Drawing;PlotSettings- Settings related to the drawing mode of the Drawing, such as line type, color and thickness;ChannelAlpha- Transparency of the channel area, value between 0 and 255, where 0 means completely transparent and 255 means completely opaque.
Fibonacci Time Zones
Example: Add a Fibonacci Time Zones to the Chart.
Guid symbolId = this.AddChartDrawing(new FibonacciTimeZones());
Properties:
X1- X coordinate of the first control point of the Fibonacci Time Zones;X2- X coordinate of the second control point of the Fibonacci Time Zones;PlotSettings- Settings related to the Drawing mode, such as line type, color and thickness.
Custom drawing of outputs
public virtual void OnCustomPaint(CustomPaintIndicatorEventArgs args)
MarvelChart allows you to completely customize the drawing of the indicator outputs, implementing the override of the OnCustomPaint method. Access to the drawing functions and the related documentation can be done through the args parameter of type CustomPaintIndicatorEventArgs. The args parameter allows you to calculate the X and Y coordinates of the points on the Chart panel, to obtain the dimensions in pixels of the panel, and to use all the available drawing functions. The drawing of the indicators is done through the use of Direct2D Immediate Mode calls that exploit hardware acceleration if available.
Trading Systems
MarvelChart allows you to create custom trading systems using Class Libraries .NET Core 8.0. Each trading system is made up of a .NET class, which to be identified as such must derive from the Signal class provided by MarvelChart in the NetScript namespace. It is possible to create new trading systems either by following the wizard procedure integrated in MarvelChart, or by creating a Class Library independently, placing the resulting assembly in the folder
New Trading System Wizard
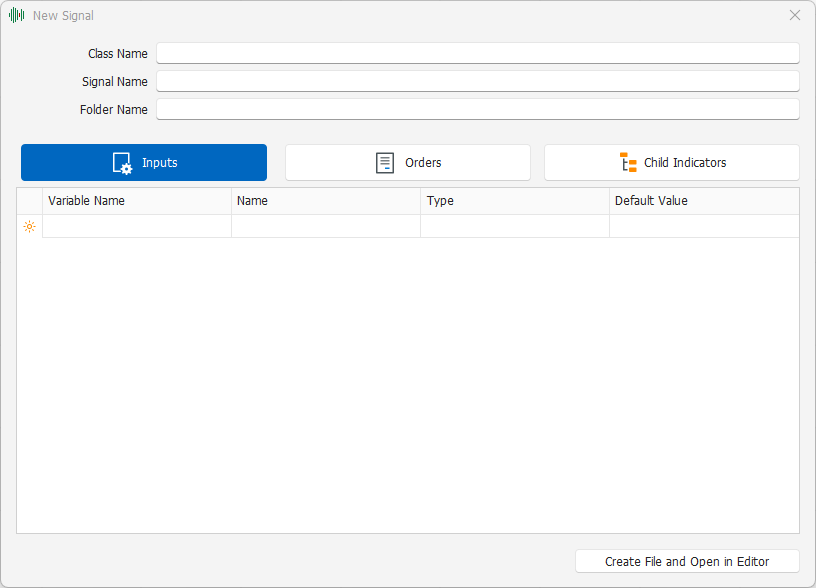
The wizard for creating new Trading Systems consists of a window that requests essential information about the new trading system.
The window has the fields in the upper part to enter the values that identify the new trading system, while in the central part it is divided into different sections. The information that identifies the new trading system consists of the fields:
Class Name - Name of the class of the new trading system, must be a unique text;
Signal Name - Name of the new trading system, which represents the text that will be visible in the MarvelChart Signal settings window;
Folder Name - Name of the folder in which to add the entry of the new trading system in the MarvelChart Signal settings window.
The sections in the central part of the window group the settings relating to:
Inputs - Input parameters of the trading system;
Orders - Definition of the orders that the trading system can generate;
Child Indicators - Any indicators that the new trading system uses in the calculation algorithm.
Once all the settings have been completed, by clicking on the Create File and Open in Editor button, MarvelChart will create the new trading system file in C# language and open the development environment where it will be possible to write the code.
Inputs

In this section you can define the input parameters of the trading system. For each input parameter you need to define the following values in the table:
Variable Name - Name of the variable used within the code of the new trading system to contain the value of the input parameter. It must be a unique text within the trading system;
Name - Name displayed in the MarvelChart windows to identify the input parameter of the trading system;
Type - Drop-down box where you can select the type of data associated with the input parameter;
Default Value - Default value of the input parameter, automatically assigned to the corresponding variable when the trading system is initialized for a Backtest or for the Auto-Trade system.
Orders
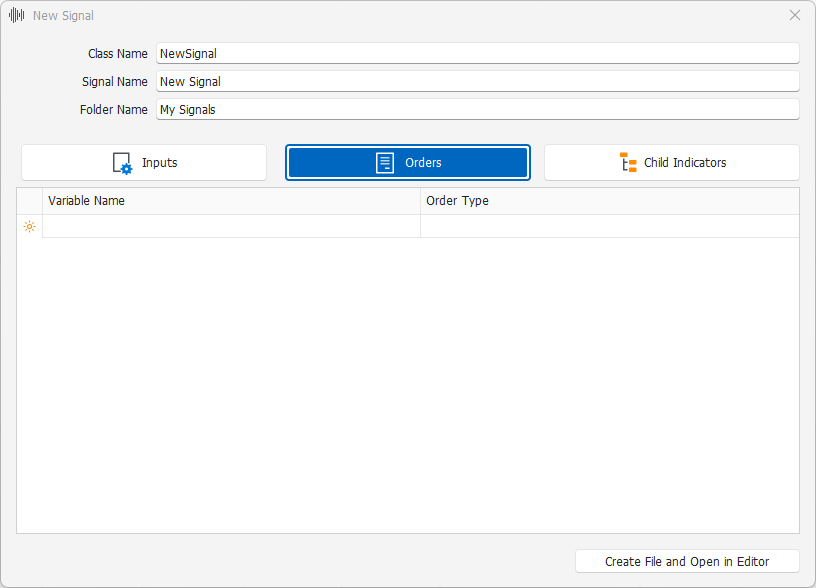
In this section you can define the orders that the trading system can generate. For each order you need to define the following values in the table:
Variable Name - Name of the variable used within the code of the new trading system to identify the order. It must be a unique text within the trading system;
Order Type - Drop-down box where you can select the type of order;
Child Indicators
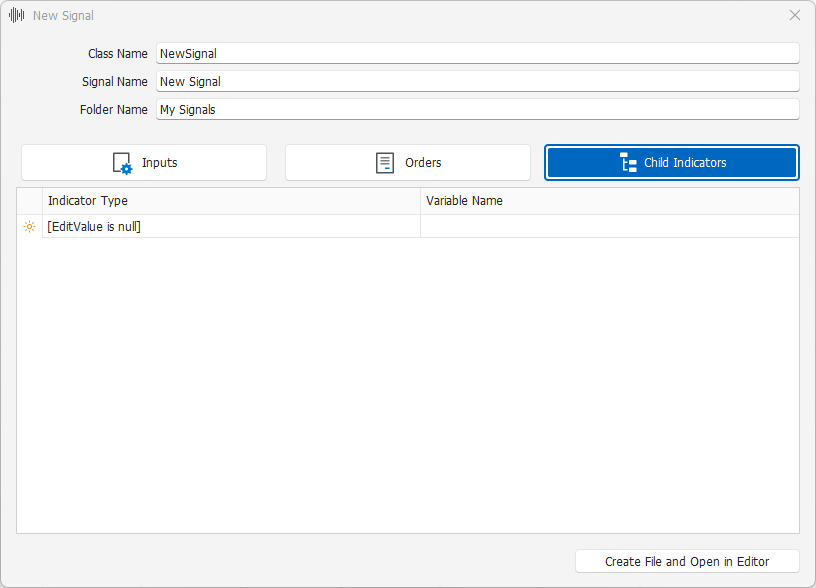
In this section you can define the Child Indicators, that is, the indicators and the related calculation functions that the new trading system you are creating will use in its algorithm. For each Child Indicator you need to define the following values in the table:
Indicator Type - Drop-down box where you can select the type of Child Indicator that you want to use in the calculation of the new trading system;
Variable Name - Name of the variable associated with the Child Indicator. It must be a unique text within the trading system;
Signal class methods
When creating new trading systems, it is generally sufficient to implement via override only two methods of the Signal class, OnCreate and OnCalculate.
OnCreate
void OnCreate(IScriptData data, IVariablesFactory variablesFactory, IPlotFactory plotFactory, ISignalOrderFactory orderFactory)
This method is called by MarvelChart when the trading system is added to the Chart, or in any case when it is necessary to initialize a new instance of the trading system. It can be used to initialize variables, Inputs (in particular the historical series used in the Inputs), Child Indicators and in general any other object used in the trading system that needs initialization. The method has the parameters:
data- Contains the working data of the trading system, such as the historical series and the Chart symbol;variablesFactory- Used to initialize variables that contain data series;plotFactory- Used to initialize plots and strip lines;ordersFactory- Used to initialize orders.
Initialization of variables
If the trading system requires variables that store the values bar by bar, you can use objects of type IVariableSeries<T>, initializing them in the OnCreate method, as in the following example:
this.m_variable = variablesFactory.CreateVariableSeries<double>(this);
Initialization of Inputs
When the trading system requires Inputs, their values can be initialized in the OnCreate method. It is advisable to always initialize the Inputs related to historical series, as in the following example:
if (this.Price == null) this.Price = data?.Bars?.Close;
Child Indicators Initialization
Child Indicators initialization consists simply in calling the constructor of the relative class, passing as parameter parent the value this, as in the following example:
this.m_ma = new VariableTypeMovingAverage(this);
Child Indicators in trading systems must be released manually by implementing an override of the OnDestroy method.
Orders Initialization
For each order used in the trading system, it is necessary to perform its initialization in the OnCreate method, as in the following example:
this.m_buy = orderFactory?.Create(this, SignalOrderType.BuyMarket);
OnCalculate
public virtual void OnCalculate(IScriptData data)
The OnCalculate method is the one that MarvelChart uses to execute the trading system algorithm. It is the main method of every trading system.
OnNewBar
public virtual void OnNewBar(IScriptData data)
This method is called by MarvelChart every time a new bar is added to the historical series. It is not normally necessary to implement an override of this method, as MarvelChart automatically extends the length of the data series related to the and Child Indicators initialized in the OnCreate method by passing the value this as the parent parameter.
OnDestroy
void OnDestroy(IScriptsContext context)
This method is called by MarvelChart when the trading system is deleted from the Chart or when the instance is released. It is necessary to implement an override of this method if the trading system uses Child Indicators, which must be released manually. Example:
For each Child Indicator used, it is necessary to execute a call to the context.ReleaseScript method to free the resources used.
Take-Profit and Stop-Loss
The Signal class from which the trading systems derive makes it possible to set Take-Profit and Stop-Loss exit orders via specific methods and properties.
SetTakeProfit
void SetTakeProfit(TakeProfitStopLossMode takeProfitMode, double takeProfitValue)
Sets the parameters for the Take-Profit exit order. The takeProfitMode parameter determines how the price of the exit order should be calculated. The allowed values are:
None- No Take-Profit exit order;Points- The price is calculated as a distance, in points, from the price of the Open Position. The distance in points is specified in thetakeProfitValueparameter;Percentage- The price is calculated as a distance, in percentage, from the price of the Open Position. The distance in percentage is specified in thetakeProfitValueparameter;Amount- The price is calculated so that the exit occurs with a Profit equal to the value set in thetakeProfitValueparameter. The exit price will therefore depend not only on the price of the Open Position, but also on the quantity and characteristics of the symbol;ExactPrice- The exit price will be equal to the value set in thetakeProfitValueparameter.
SetStopLoss
void SetStopLoss(TakeProfitStopLossMode stopLossMode, double stopLossValue)
Sets the parameters for the Stop-Loss exit order. The stopLossMode parameter determines how the price of the exit order should be calculated. The allowed values are:
None- No Stop-Loss exit order;Points- The price is calculated as a distance, in points, from the Open Position price. The distance in points is specified in thestopLossValueparameter;Percentage- The price is calculated as a distance, in percentage, from the Open Position price. The distance in percentage is specified in thestopLossValueparameter;Amount- The price is calculated so that the exit occurs with a Loss equal to the value set in thestopLossValueparameter. The exit price will therefore depend not only on the price of the Open Position, but also on the quantity and characteristics of the symbol;ExactPrice- The exit price will be equal to the value set in thestopLossValueparameter.
ClearTakeProfit
void ClearTakeProfit()
Resets all settings related to the Take-Profit exit order.
ClearStopLoss
void ClearStopLoss()
Clear all Stop-Loss exit order settings.
TakeProfit Properties
TakeProfitSettings TakeProfit { get; }
A read-only property that allows access to the current settings of the Take-Profit exit order.
StopLoss Properties
StopLossSettings StopLoss { get; }
A read-only property that allows access to the current settings of the Stop-Loss exit order
Cancelling Orders
If the trading system involves the use of orders that require long periods of time to be completely executed, it may happen that the algorithm calculates that a new order needs to be entered while a previous one is not yet completed. For these cases, the Signal class provides the CancelOrder method to cancel an order that has not yet been completed.
void CancelOrder(Order order, IScriptData data)
The order parameter specifies which order must be cancelled, while the data parameter contains the working data of the trading system.
Dynamic Indicators
Dynamic Indicators can be created in trading systems. Dynamic Indicators are indicators that the trading system automatically adds to the Chart when it is started.
Using Dynamic Indicators involves using the IndicatorsFactory property of the Signal class, which exposes the CreateIndicator and RemoveIndicator methods, used to add a Dynamic Indicator to the Chart and to remove it, respectively.
IndicatorsFactory.CreateIndicator
Guid CreateIndicator(IScript owner, Type indicatorType, Dictionary<string, object> indicatorInputParametersValues, Dictionary<string, PlotSettings> indicatorOutputs)
Adds a Dynamic Indicator to the Chart, and returns a Guid value that identifies it in MarvelChart. The input parameters are:
owner-Signalowner of the Dynamic Indicator, normally set tothis;indicatorType- Type of indicator;indicatorInputParametersValues- Input parameters of the indicator. If one of the indicator Inputs is not specified in this parameter, the indicator will use the default value.indicatorOutputs- Settings for the indicator outputs.
Example usage:
IndicatorsFactory.RemoveIndicator
void RemoveIndicator(Guid indicatorId)
Removes a Dynamic Indicator from the Chart, identified by the parameter indicatorId, whose value must be equal to the value returned by the call to the method IndicatorsFactory.CreateIndicator.
Output on Multi-Symbol Backtest
When using a trading system in the Multi-Symbol Backtest functionality, it is possible to make available additional information that will be displayed in the status messages list during the Backtest execution. The Signal class provides the OutputInfo method to add information to the message list. A row is added to the message list each time an order is generated. On the row, using the OutputInfo function, you can add columns containing additional information that you want to be visible in the Backtest window.
void OutputInfo(string name, object value, Color? foregroundColor = null, Color? backgroundColor = null, int fontSizeDelta = 0, FontStyle fontStyleDelta = FontStyle.Regular)
name- Header of the column to add to the message list;value- Value to display in the cell identified by the column specified by the name parameter and the current row of the message list;foregroundColor- Optional. Text color;backgroundColor- Optional. Background color of the cell;fontSizeDelta- Optional. Cell font size difference from the standard font, in points;fontStyleDelta- Optional. Cell font style difference from the standard font.
Import and export of Indicators and Trading Systems
In MarvelChart, using the appropriate menu items when choosing indicators or trading systems, you can start the import/export procedure.

To start the import/export procedure for Indicators and Trading Systems, from the Indicators menu click on "Import/Export scripts...".
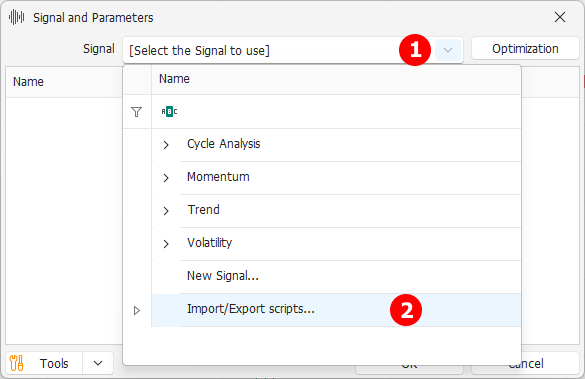
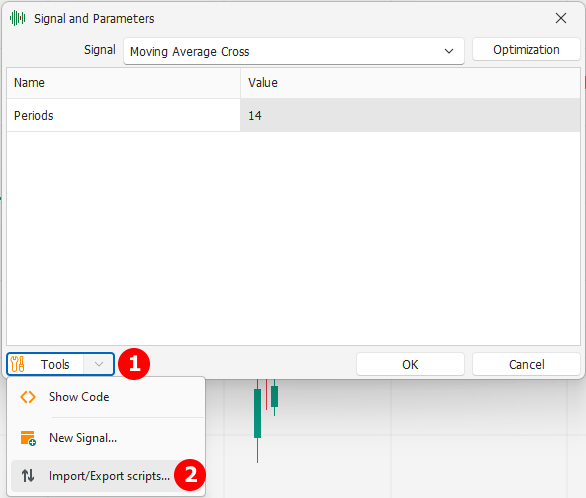
You can also start the import/export process for Indicators and Trading Systems from the Signal selection window for Multi-Symbol Backtest, Backtest, or Auto-Trade, in two ways:
Open the Signal selection menu and click the "Import/Export scripts..." button;
Click the "Tools" button and select "Import/Export scripts...".
Import of Indicators and Trading Systems via source code
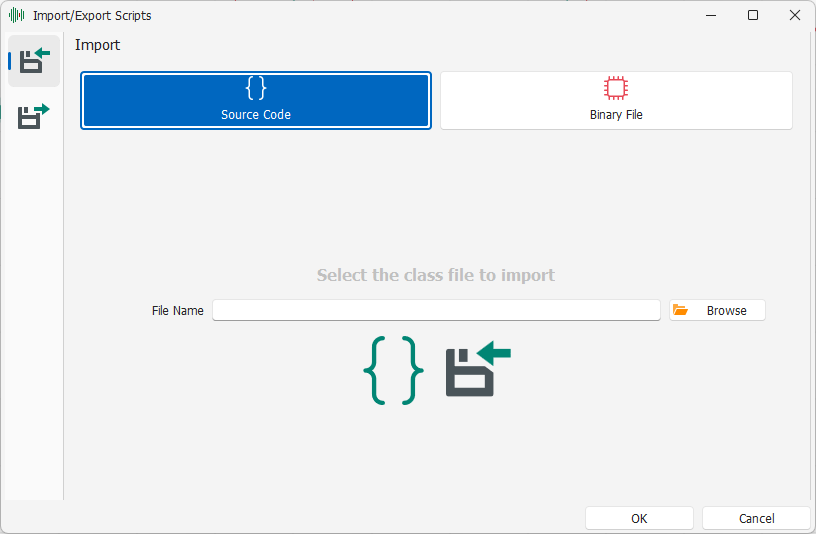
The import via source code is done by selecting the Import tab along the left edge of the window, then activating the Source Code view at the top of the tab. The import view via source code requires only one parameter, the name of the source file to import. Once the file has been selected, clicking on the OK button will start the import of the file (via copy), also starting the development environment for editing the imported file.
Importing Indicators and Trading Systems via a compiled binary file
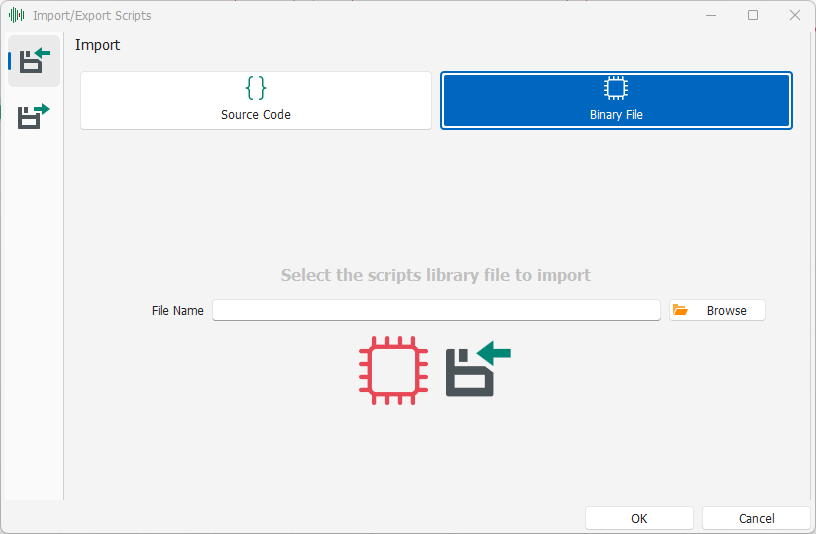
The import via a compiled binary file is done by selecting the Import tab along the left edge of the window, then activating the Binary File view at the top of the tab. The import view via a compiled binary file requires only one parameter, the name of the file to import. Once the file has been selected, clicking on the OK button will start the import of the file (via copy), making the indicators and trading systems present in the imported file immediately available in MarvelChart.
Exporting Indicators and Trading Systems via Source Code
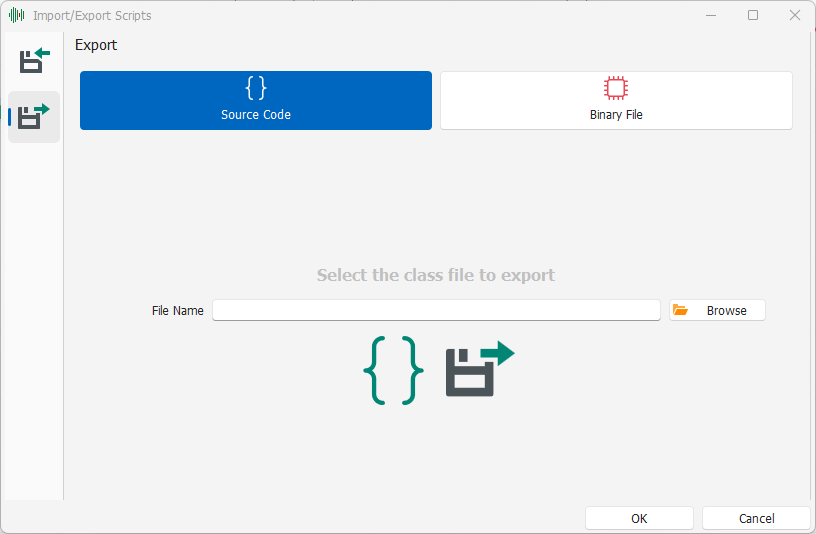
Exporting via source code is done by selecting the Export tab along the left edge of the window, then activating the Source Code view at the top of the tab. The export view via source code requires only one parameter, the name of the source file to export. Once the file is selected, clicking on the OK button will start the export of the file (via copy), requesting the name to assign to the exported file.
Exporting Indicators and Trading Systems via Binary Compiled File
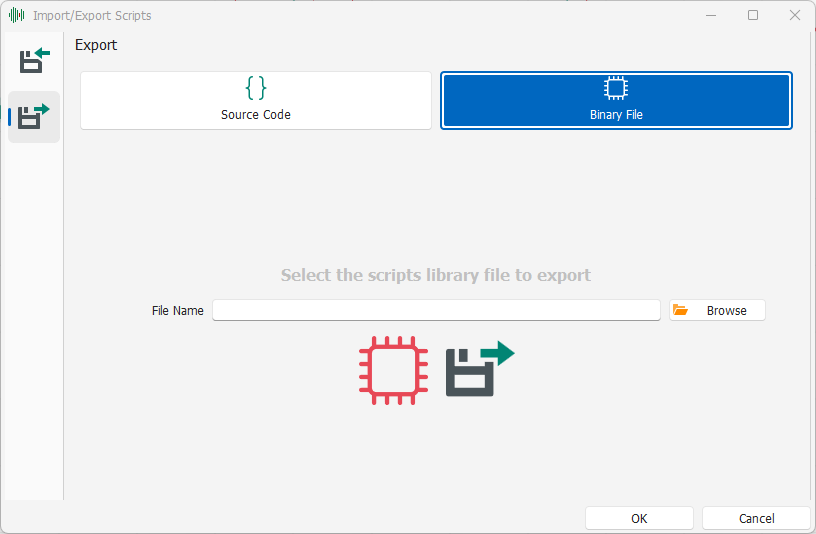
Exporting via binary compiled file is done by selecting the Export tab along the left edge of the window, then activating the Binary File view at the top of the tab. The export view via binary compiled file requires only one parameter, the name of the file to export. Once the file has been selected, clicking on the OK button will start the export of the file (via copy), requesting the name to assign to the exported file.
Creating extensions without using the wizards
To create extensions without using the MarvelChart wizards, simply create a new Class Library project for .NET Core 6 in your favorite development environment, in any language, and within the project create a new class for each new Indicator or Trading System that you want to implement. Classes that implement a new Indicator must derive from the NETScript.Indicator class, while classes that implement a new Trading System must derive from the NETScript.Signal class. It is therefore necessary to add a reference to the NETScript assembly in the project, which is located in the MarvelChart installation folder, typically
The assembly resulting from the compilation of the project must be copied to the folder where MarvelChart searches for extension files, typically
