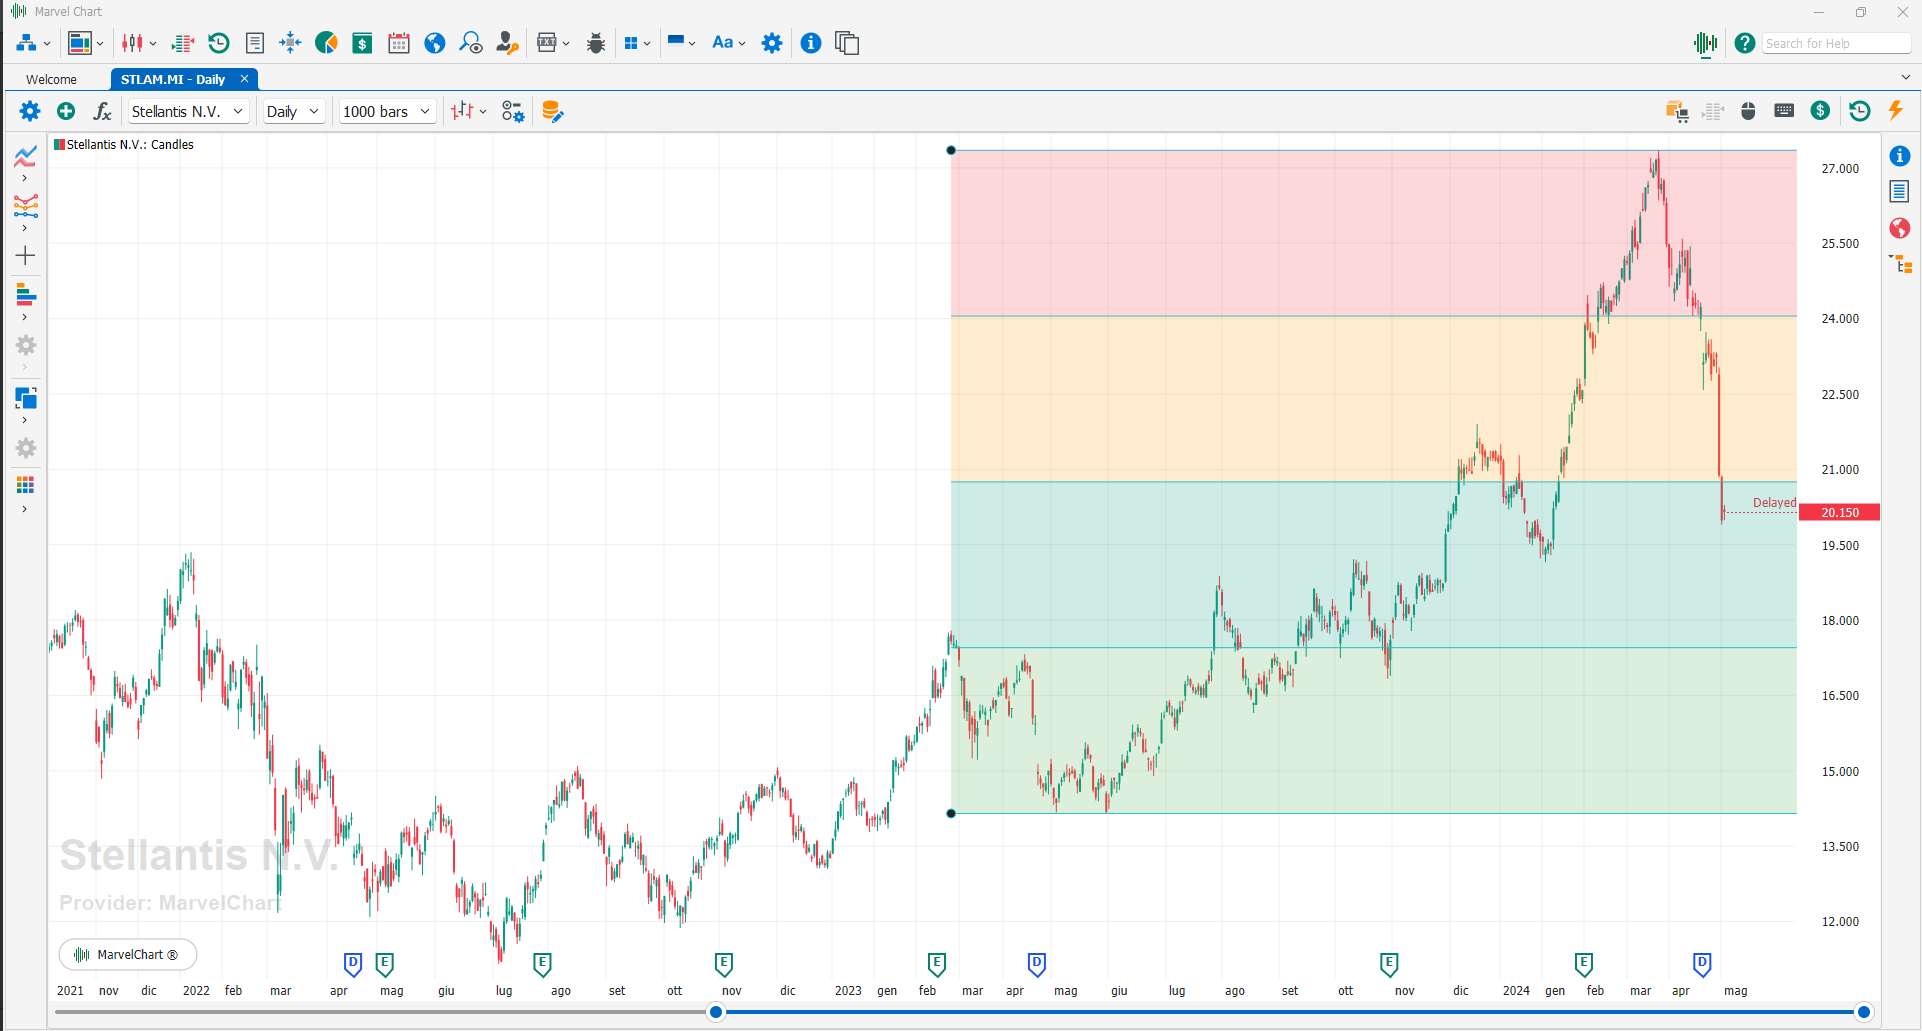
Quadrant Lines

It represents a channel made up of 5 horizontal lines equidistant from each other, automatically calculated starting from the prices included within the time interval defined by the channel itself. The upper line represents the Highest High of the period, the lower line represents the Lowest Low of the period, the distance between these two lines is finally divided into 4 parts determining the position of the 3 intermediate lines. To add the channel to the chart, simply click on the chart on the initial bar where you want to position it, hold down the mouse button and move to the final bar, and finally release the button. After adding the channel to the chart, you can move it by clicking on one of the control points to select it and then dragging it to the new position while holding down the left mouse button.
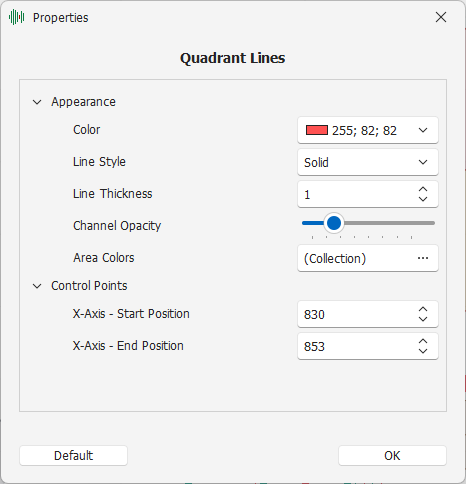
Settings

Appearance - Settings related to the drawing mode
Color - Color of the lines
Line Style - Style of drawing lines
Line Thickness - Thickness of the lines
Channel Opacity - Opacity of the channel enclosed by the lines
Area Colors - Editable list of colors used to draw the areas inside the channel
Control Points - Control points of the channel
X-Axis - Start Position - Initial position of the channel relative to the X-axis, expressed in bar number
X-Axis - End Position - Final position of the channel relative to the X-axis, expressed in bar number