Label

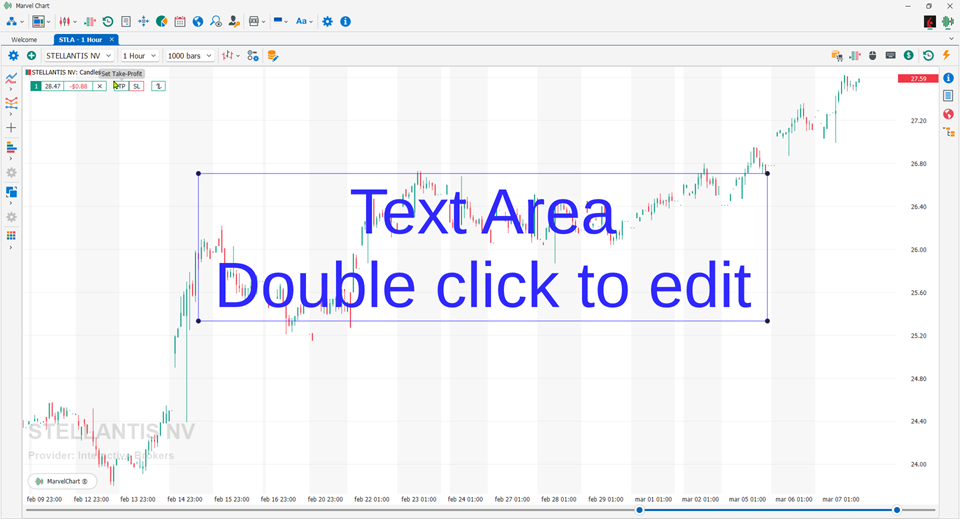
It represents a free text area on the graph. To add the text area to the graph, simply click on the position on the graph where you want to place it. After adding the text area to the graph, you can move it by clicking on it to select it and then dragging it to the new position while holding down the left mouse button. The text is always aligned to the center. The Label is automatically sized based on the text and the chosen Font.
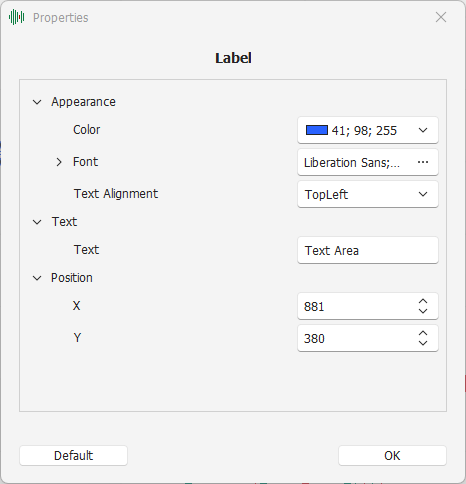
Settings

Appearance - Settings related to the drawing mode
Color - Text color
Font - Font with which to draw the text
Text Alignment - Alignment of the text with respect to the position of the Label on the Chart
Text - Settings related to the text
Text - Text of the Label, which can also be positioned on multiple lines
Position - Position of the Label on the Chart
X - X-axis coordinate, expressed as the bar number on the historical series
Y - Y-axis coordinate