Command Bars
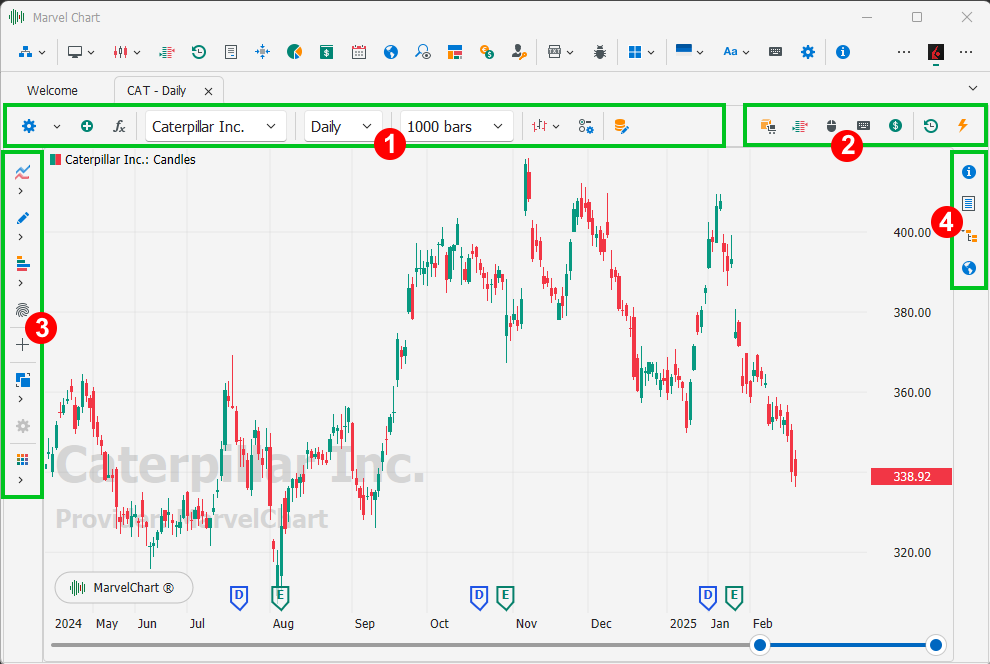
In each Chart document there are four command bars, two at the top, one along the left side and one along the right side. These bars are:
Selection and Settings Bar — Horizontal bar, visible at the top left;
Orders Bar — Horizontal bar, visible at the top right;
Toolbar — Vertical bar, visible on the left side;
Information Bar — Vertical bar, visible on the right side;
Selection and settings bar

This horizontal command bar, visible at the top of the Chart and aligned to the left edge, contains the main settings of the Chart. The available commands are:
View Settings — Settings of the chart graphic elements, such as colors, CrossHair and font. When there are multiple symbols on the same Chart, in the bar relating to the secondary series this button is replaced by the Spread Settings button;
View Settings Commands — Drop-down box which displays a menu of additional commands related to the settings of the chart's graphic elements. The available commands are:
Load from file — Load the set of chart's graphic elements settings from a file;
Save to file — Save the current set of chart's graphic elements settings to a file;
Use current settings as default — Sets the current set of chart's graphic elements settings as the default for new charts.
Add Symbol to Compare — Add a new historical series to the Chart relating to another symbol to make a comparison with the main series. See the chapter Comparison function for more information. When there are multiple symbols on the same Chart, in the bar relating to the secondary series this button is replaced by the Remove button;
Spread Settings — Visible only in the selection bars for the secondary time series used in comparison. Opens the Symbol Selection Window by presetting a spread on the symbols currently in use on the Chart;
Remove — Visible only in the selection bars for the secondary time series used in comparison. Allows you to remove the related time series from the comparison;
Select Symbol — Drop-down box, allows you to select a different symbol than the current one;
Select Time Frame — Drop-down box, allows you to select a different Time Frame than the current one;
Select number of Bars — Drop-down box, allows you to select the number of historical data bars to display in the Chart;
Chart Style — Drop-down menu, where you can choose which style to use to draw the chart;
Chart Settings — Opens the settings window for the currently selected style;
Edit Historical Data — Opens the historical data editing window;
Show/Hide additional series panels — Visible only in the selection bar for the main historical series when other historical series are used in comparison. Shows or hides the selection bars for the secondary historical series.
Historical Data Editor

Clicking on the 1 button displays the window containing the historical data present in the chart.
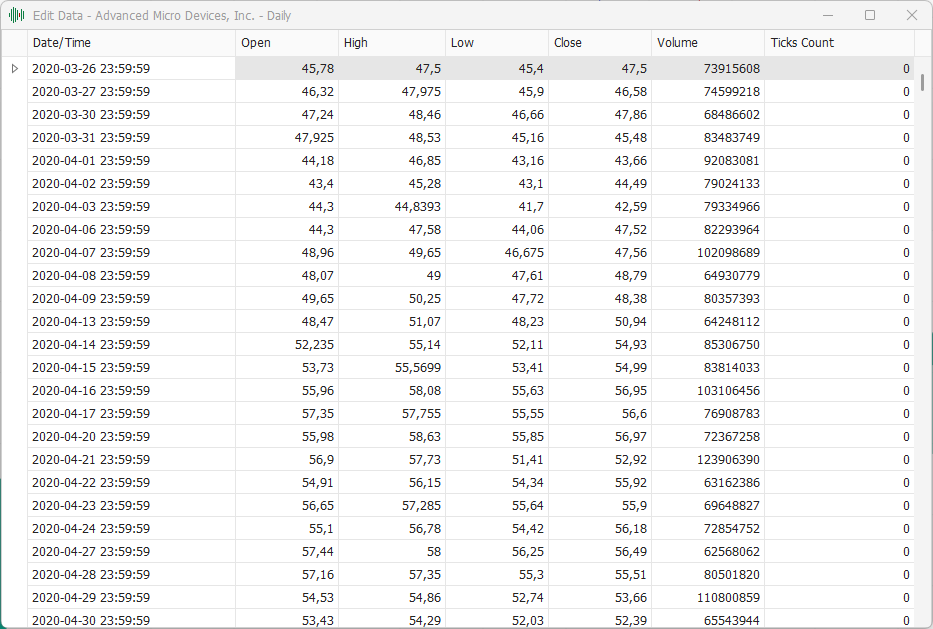
In the Edit Data window, all the data of the historical series drawn on the Chart are shown in numerical format in a table. It is possible to manually modify all the values present in the table, and the changes made are immediately drawn on the Chart. By highlighting a date and time cell and pressing the Delete key on the keyboard, the corresponding bar will be deleted from the Chart. This function is very important to be able to adjust incorrect data present in the historical series.
Orders Bar

This horizontal command bar, visible at the top of the Chart aligned to the right edge, contains the commands related to entering orders from the Chart. The available commands are:
Symbol Mapping for Orders — Opens the Symbol Mapping for Orders settings window;
DOM — Opens the DOM related to the symbol used in the chart for sending orders;
One-Click Mouse Trading — Activates/Deactivates the order entry mode on the chart via a single click of the left mouse button;
Keyboard Trading — Activates/Deactivates the mode of entering orders on the chart using the keyboard;
Profit / Loss — Shows/Hides the panel that displays the Profit/Loss realized since the beginning of the day and the one not yet realized relating to the current Open Position. If an Open Position is present, its equivalent value is also shown. The values can refer to the Auto-Trade system only or to all orders executed during the day;
Backtest on this chart — Shows/Hides the panel for setting and executing the Backtest using the historical data visible in the Chart;
Auto-Trade — Shows/Hides the panel for setting and executing the Auto-Trade on the Chart;
Toolbar
This vertical command bar, visible along the left edge of the Chart, contains the commands related to the tools that can be applied to the chart:

Indicators — Menu for inserting a new indicator on the Chart;
Drawings — Menu for inserting a new drawing on the Chart;
Candlestick Patterns — Menu for activating or deactivating the search for Japanese candlestick Patterns;
Crosshair — Activates/Deactivates the Crosshair function. The activation or deactivation of this function occurs on all Charts at the same time;
Group — Menu for choosing the group to associate the Chart with;
Template — Menu for using templates.
Information Bar

This vertical command bar, visible along the right edge of the Chart, contains the commands related to the information data that can be displayed for the Chart and the selected symbol. All the commands in this bar open a vertical tab aligned to the right edge of the chart containing the information related to the selected command. The size of the panel can be changed by dragging the left edge of the panel with the mouse. The commands in this bar are all the Active/Inactive type, and only one of them can be active. The available commands are:
Company Profile — Opens a tab that shows the company profile of the selected symbol;
Watchlist — Opens a tab with a Watchlist to monitor the performance of the symbols;
Object Tree — Opens a tab that shows the list of indicators and drawings present on the Chart, from which it is possible to modify or delete each entry;
News — Opens a News Reader document and places it in the bottom part of the MarvelChart window.
Company Profile
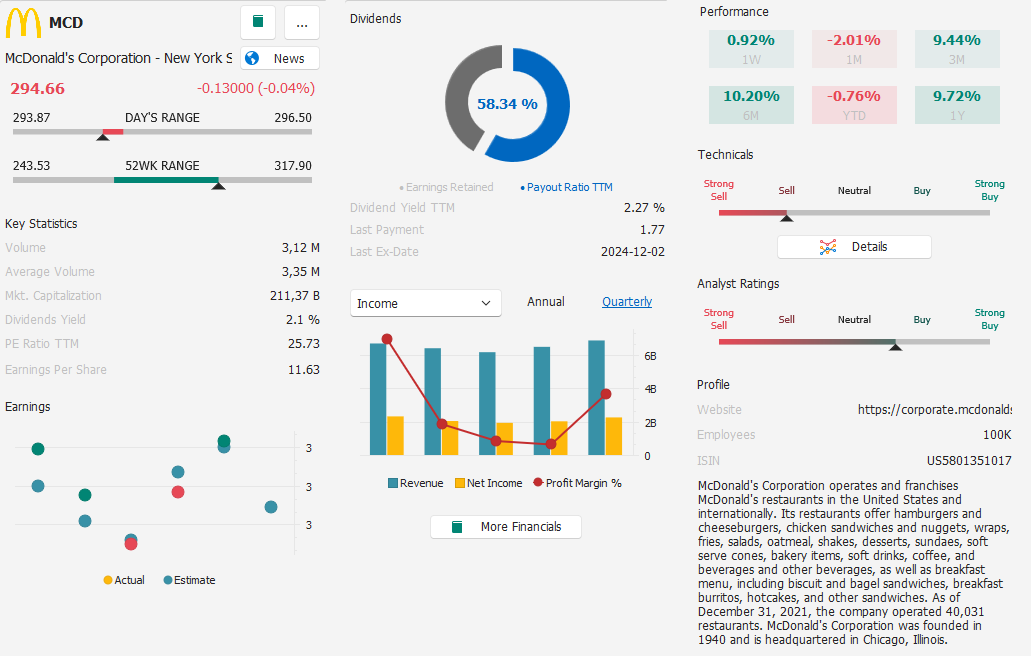
The Company Profile panel provides a series of comprehensive information about the Chart symbol. In the upper right corner of the panel there are some buttons:
More Financials — Opens the Financial Informations window;
Selection of the elements to display on the panel;
Swiping from top to bottom, the information displayed is:
Logo and abbreviated symbol;
Full name and stock exchange;
Last price and variation compared to the opening price of the session;
Price range of the day: the two extreme prices represent the Low and High prices of the day, while the central part highlights the Open and Last prices, in green if Last is greater than Open, or in red if Last is less than Open;
Price range at 52 weeks, for which the same considerations as in point 6 apply;
Main statistics of the symbol;
Earnings chart;
Dividends chart and data;
Income, Balance or Cash Flow chart, annual or quarterly;
More Financials button to open the Financial Informations window;
Performance grid with weekly, monthly, quarterly, half-yearly, year-to-date and annual time frames;
Indication of the trend through technical analysis;
Button to display the window with technical analysis details for trend indication;
Analyst ratings;
Company profile.
Technical Analysis Details for Trend Indication
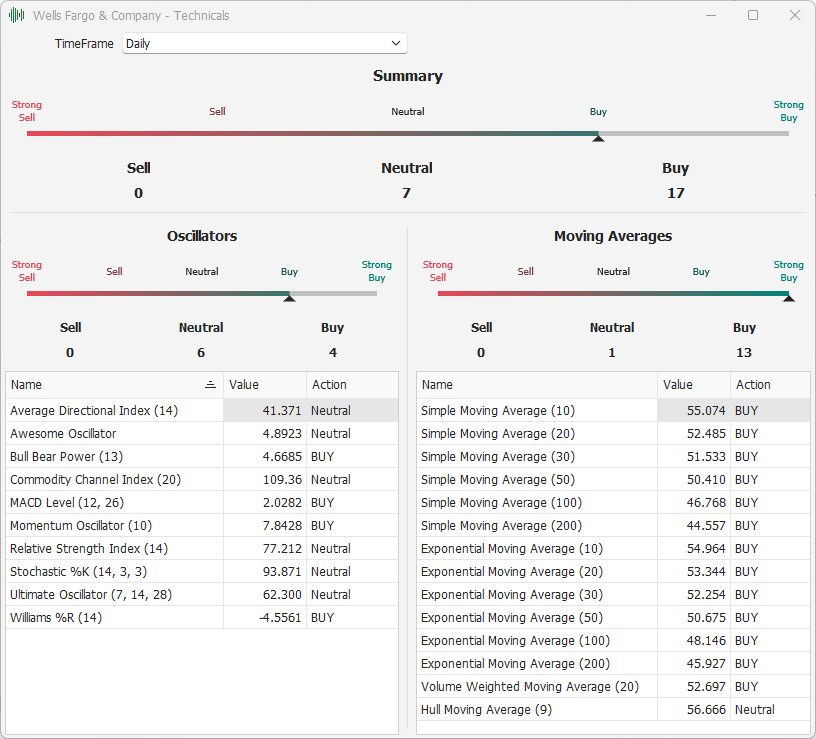
This window displays the details of the technical analysis performed to determine the trend indication. At the top of the window there is a drop-down box from which you can change the TimeFrame of the historical data with which to perform the analysis. Below is a general summary, which represents the result of the analysis, and the details of the indicators used in the calculation, divided into oscillators and moving averages. For each indicator the numerical value and the relative trend indication are shown.
Watchlist
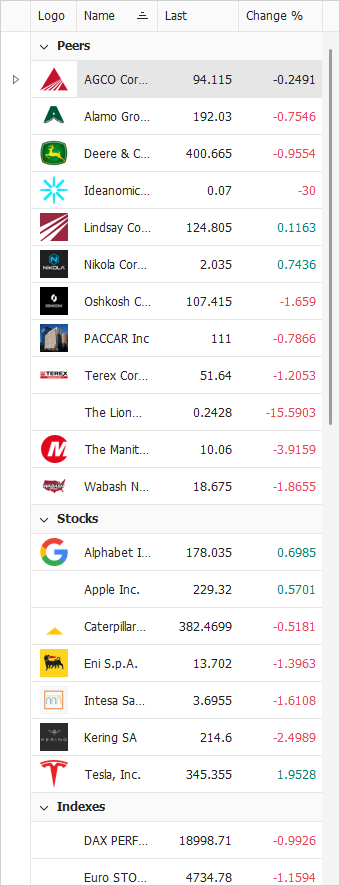
The Watchlist panel displays real-time prices and their variation from the opening price of a set of symbols, grouped in different lists, some of which are predefined by MarvelChart:
Peers — Available only when the chart symbol datafeed provides the list of symbols corresponding to the chart symbol. The symbols in this list are not customizable.
Stocks — Most common stocks. The list of symbols is customizable;
Indexes — Major world indices. The list of symbols is customizable;
Forex — Major currency exchanges. The list of symbols is customizable;
Crypto — Major cryptocurrencies. The list of symbols is customizable;
Futures — Most common futures. The list of symbols is customizable;
MarvelChart's predefined symbol lists cannot be removed.
Customize the Watchlist
Right-clicking on the Watchlist will open a menu that allows you to customize the Watchlist.
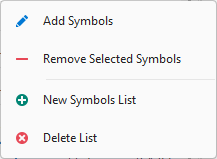
Add Symbols — Allows you to add more symbols to the currently selected list;
Remove Selected Symbols — Removes the selected symbols from the watchlist;
New Symbols List — Creates a new list of symbols, whose name can be chosen by the user;
Delete List — Deletes the entire selected list of symbols. This command is only available for user-created symbol lists.
You can also use the Del key on the keyboard to delete symbols from the Watchlist.
All Watchlist symbol lists can be collapsed or expanded.
Object Tree
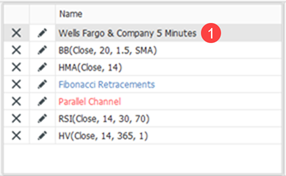
The Object Tree panel displays the list of elements present on the chart, including:
Time series;
Indicators;
Drawings;
Volume Overlays.
The list is sorted by:
Chart panel, from the top to the bottom;
Element type, in order, time series, indicators, drawings, volume overlays;
Displayed name on the Object Tree, alphabetical order.
The main time series always takes precedence over other time series.
For each element displayed in the Object Tree there are buttons to delete it and to open the related settings window. The main time series 1 cannot be removed from the Chart.