Drawings
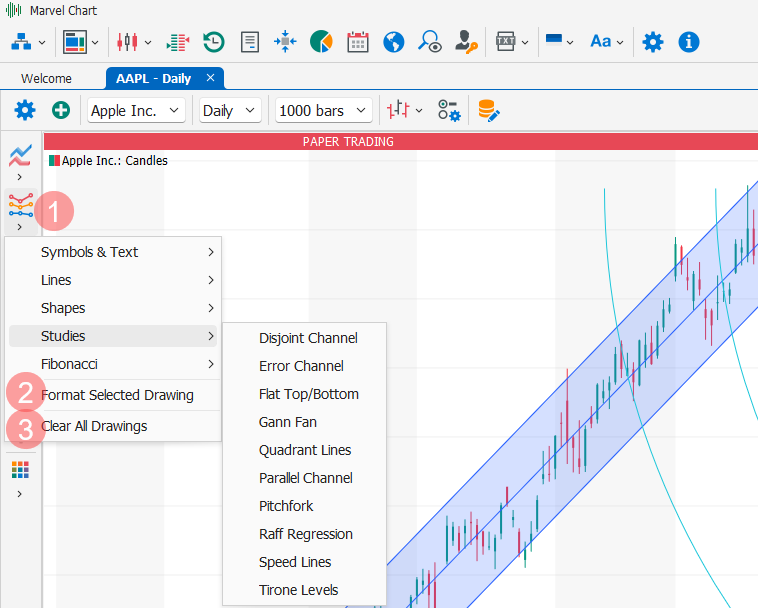
To access the Drawings click on the 1 button in the Chart window and then select the drawing category and then the name. By clicking on the 2 button, the window for setting the parameters of the selected Drawing will be displayed. By clicking on the 3 button, all the Drawings present on the chart will be deleted.
Drawings represent drawings that can be added manually to the Chart, each with its own distinctive characteristics and settings. The Drawings are grouped by categories:
To insert new Drawings you need to use the relative drop-down button in the toolbar of the Chart, and select from it the type of Drawing to add. Follow the specific instructions for the type of Drawing chosen for the correct insertion on the Chart.
Adding Drawings
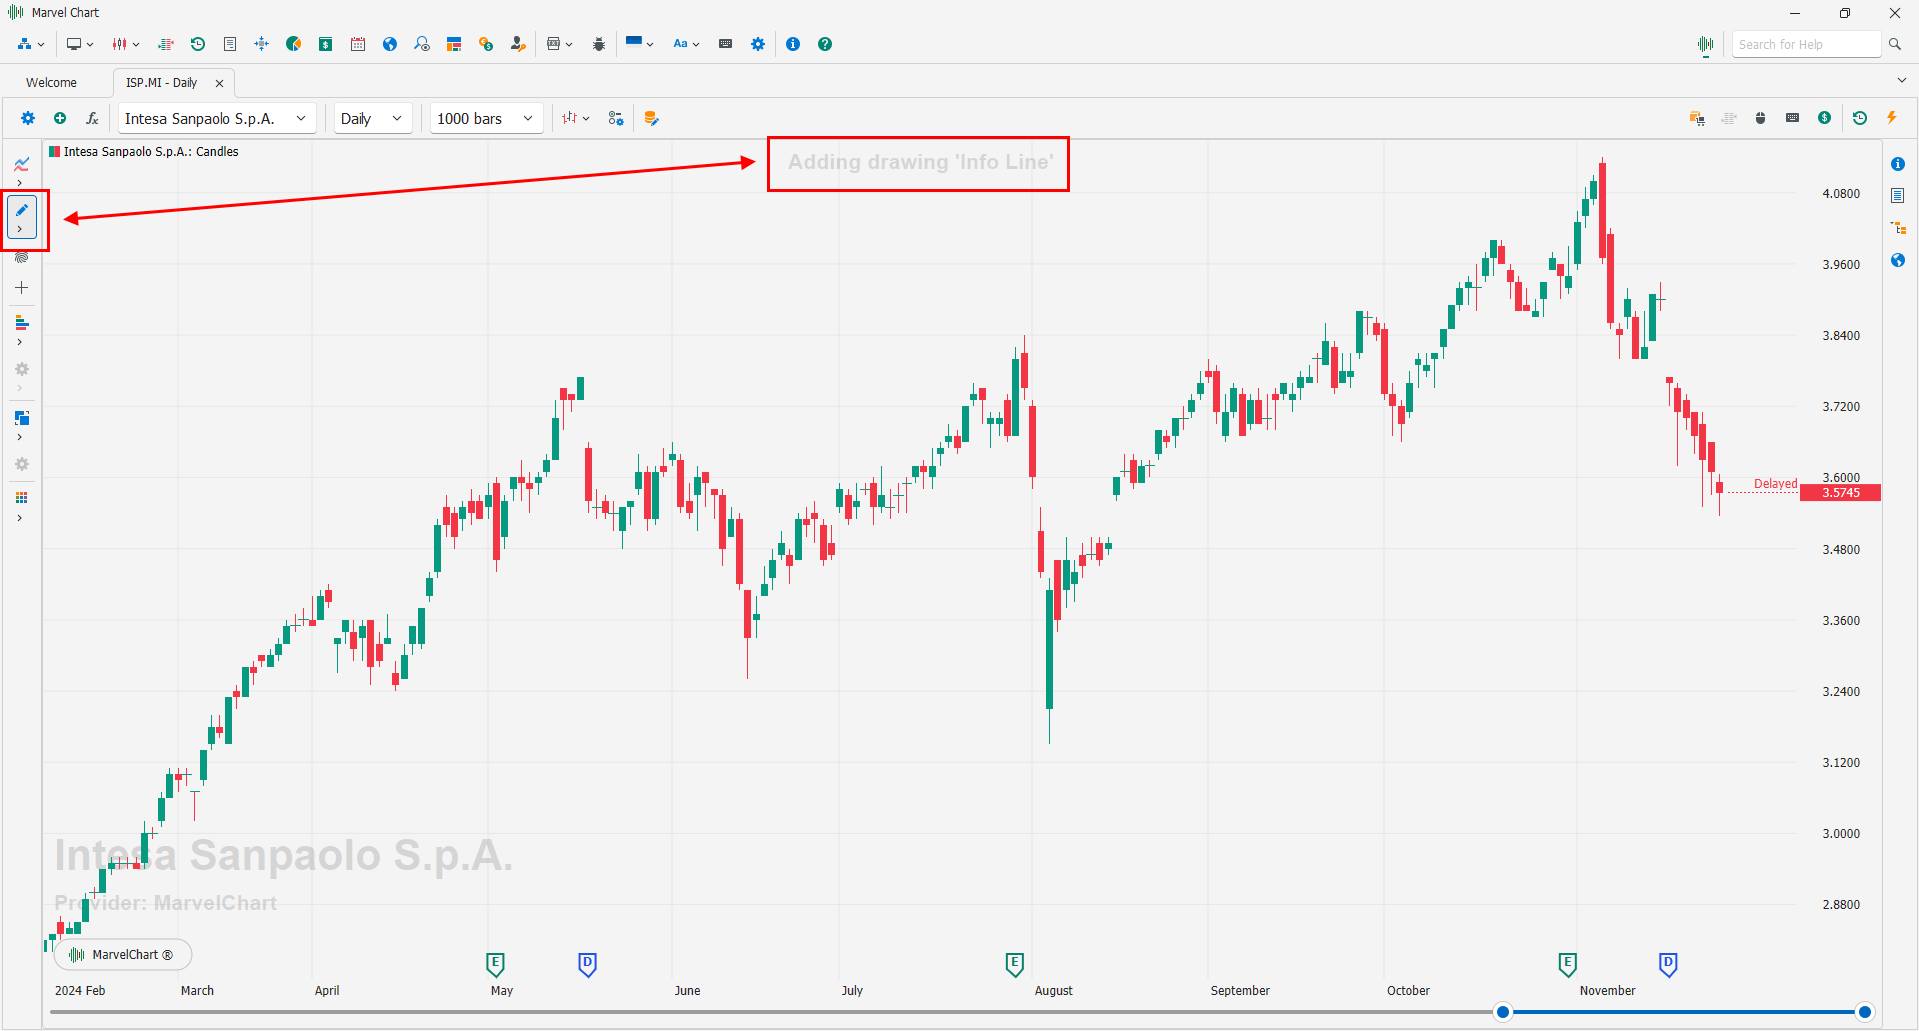
After choosing the type of Drawing to add to the Chart, the chart highlights the Drawings insertion mode with two indications: the button on the toolbar remains active, and at the top of the chart it is specified which type of Drawing is being added to the Chart.
To deactivate the Drawing insertion mode, click the button on the toolbar again or right-click on the Chart.
Drawings Settings
After placing a Drawing on the Chart, you can open the settings panel, if provided, using one of the following methods:
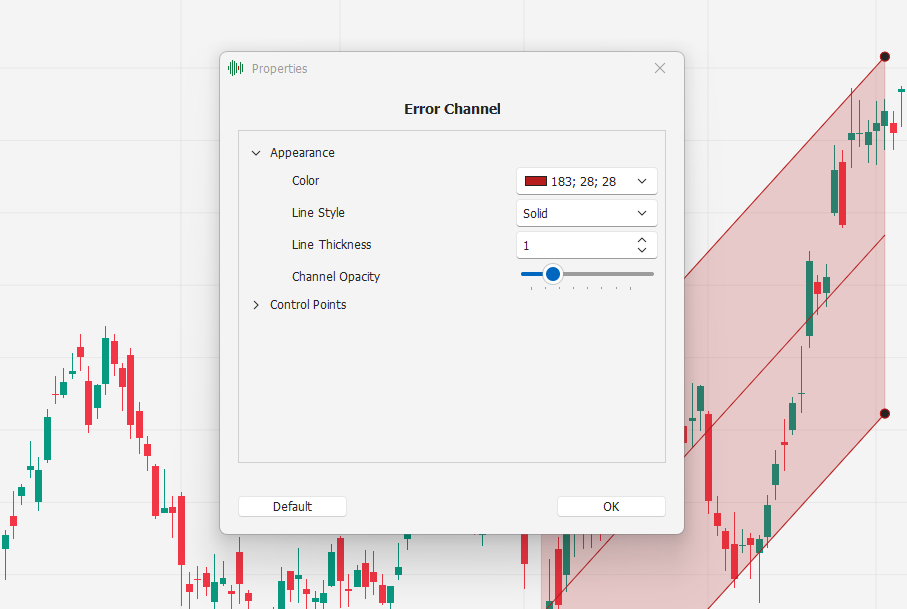
Double click on the Drawing;
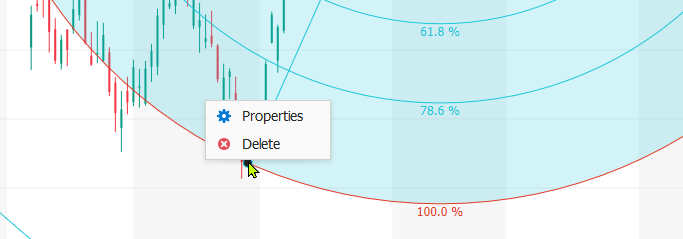
Right-click on one of the points that highlight the selection of the Drawing, and from the context menu choose the Properties item;
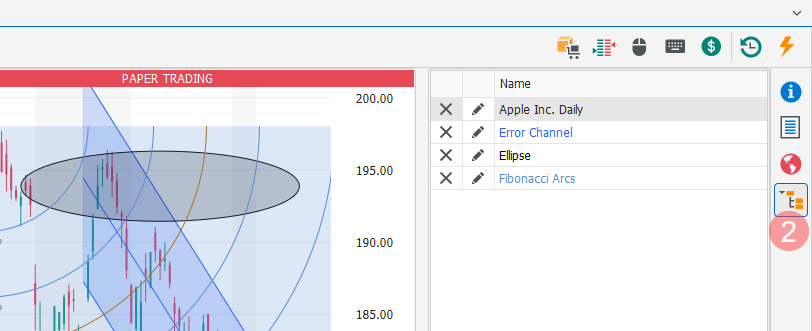
Using the Object Tree 2 function in the information bar of the Chart.
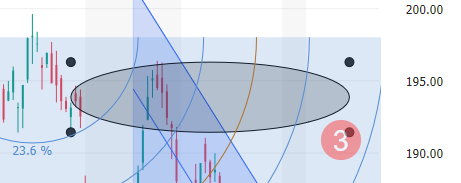
For some Drawing types, you can change their positioning, size, and orientation by acting on the control points 3 displayed when the drawing is selected.
