Time Zones

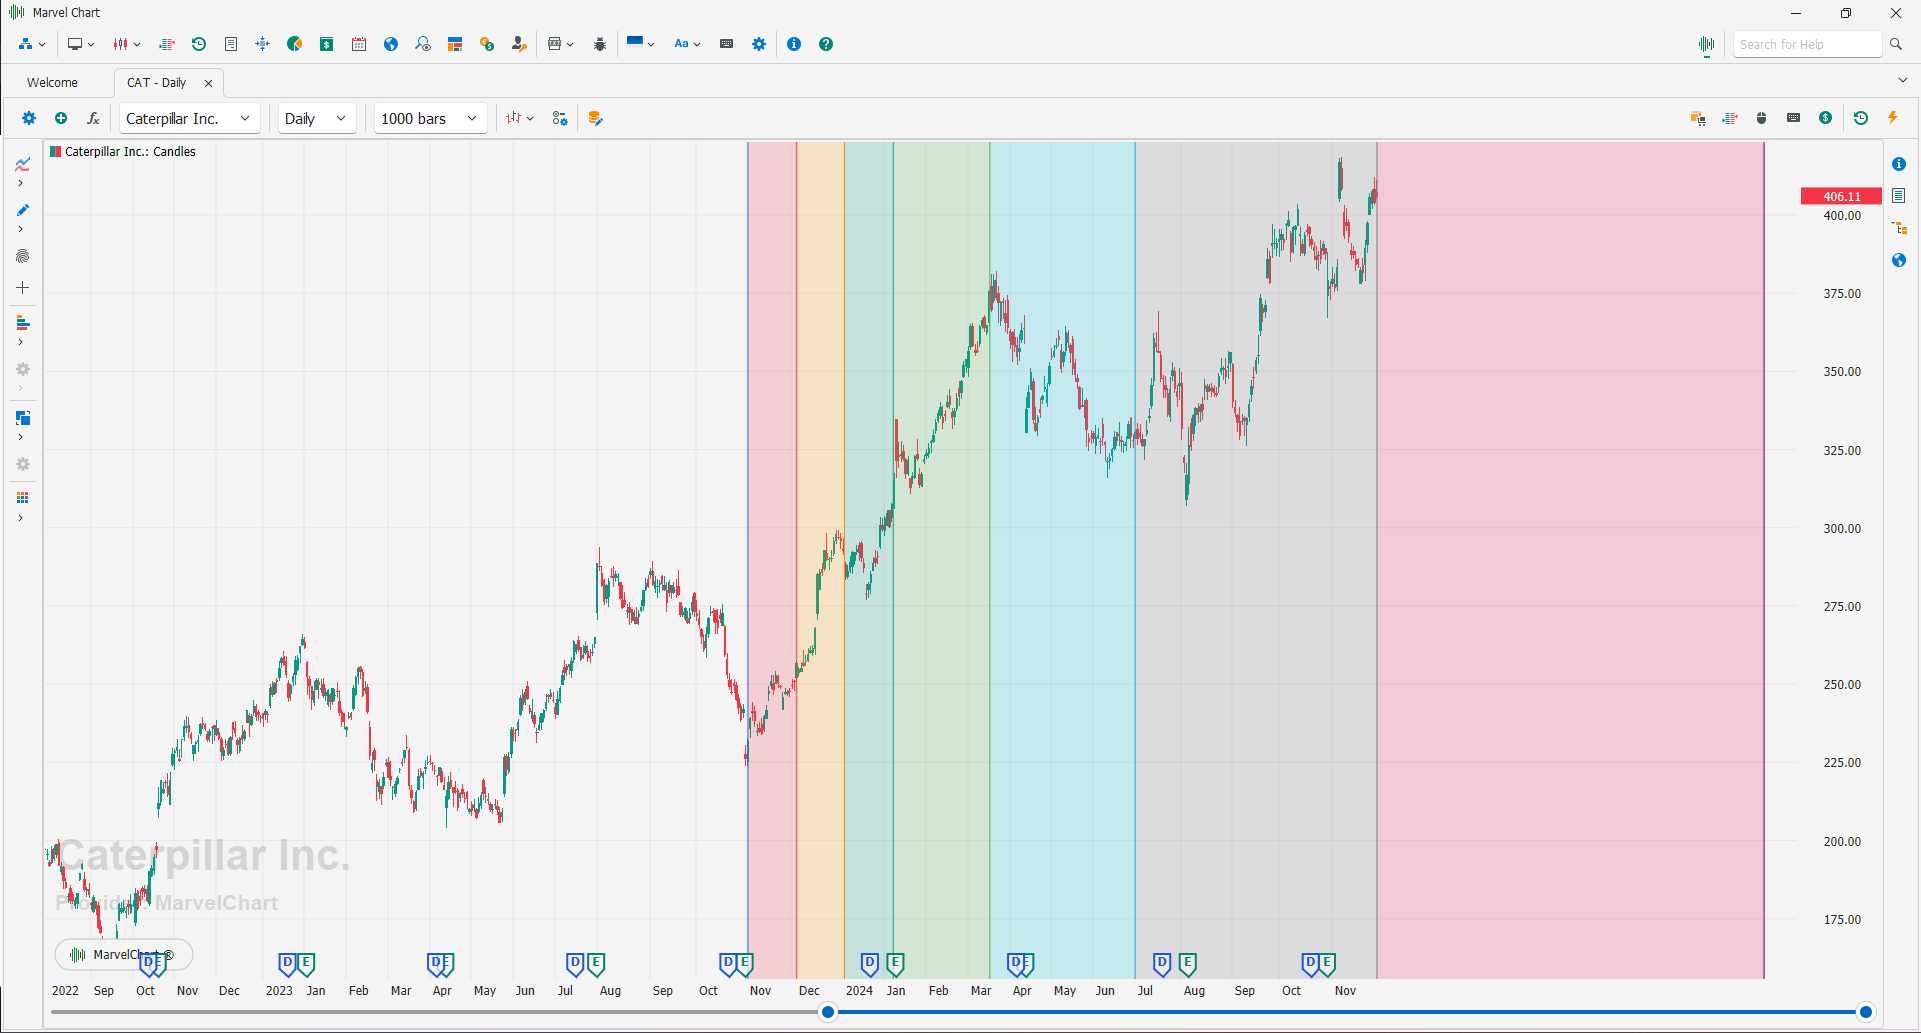
Fibonacci Time Zones are made up of a series of 8 vertical lines, whose position is calculated starting from the horizontal distance between the two control points that define them. Considering the horizontal position of the first control point to be 0% and that of the second control point to be 100%, the other lines are drawn at 4.8%, 9.5%, 14.3%, 23.8%, 38.1%, and 61.8%. To add Fibonacci Time Zones to the chart, simply click on the chart at the position of the first control point, hold down the mouse button and move to the position of the second control point, and finally release the button. After adding Fibonacci Time Zones to the chart, you can move them by clicking on one of the control points to select it and then dragging it to the new position while holding down the left mouse button.
Settings

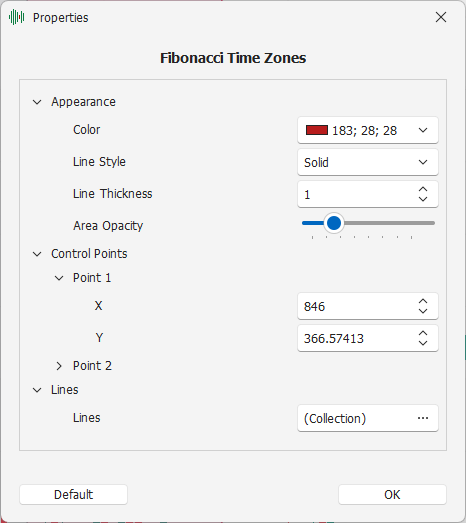
Appearance - Settings related to the drawing mode
Color - Color of the lines
Line Style - Style of drawing lines
Line Thickness - Thickness of the lines
Area Opacity - Opacity of the area enclosed by the Fibonacci Time Zones
Control Points - Control points of the Fibonacci Time Zones
Point 1 - First control point of the Fibonacci Time Zones
X - Position relative to the X-axis, expressed as a bar number
Y - Position relative to the Y-axis
Point 2 - Second control point of the Fibonacci Time Zones
X - Position relative to the X-axis, expressed as a bar number
Y - Position relative to the Y-axis
Lines - Fibonacci Time Zones lines
Lines - Editable list of Fibonacci Time Zones lines
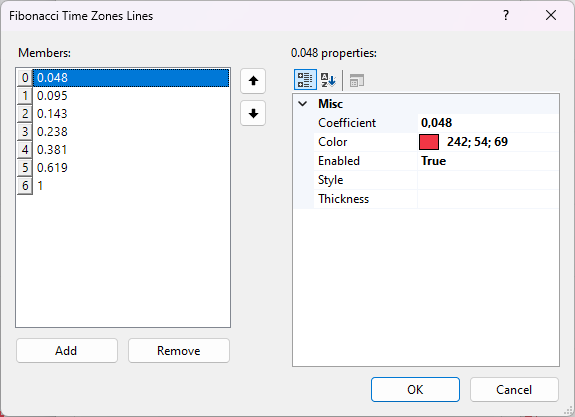
Fibonacci Time Zones Lines Settings

For each line, the following settings are present:
Coefficient - Fibonacci coefficient ot the line
Color - Color of the line, if left empty it uses the general color of the Fibonacci Time Zones
Enabled - Activate/Deactivate the line drawing
Style - Line drawing style, if left empty it uses the general style of the Fibonacci Time Zones
Thickness - Line thickness, if left empty it uses the general thickness of the Fibonacci Time Zones