Multi-Symbol Backtest
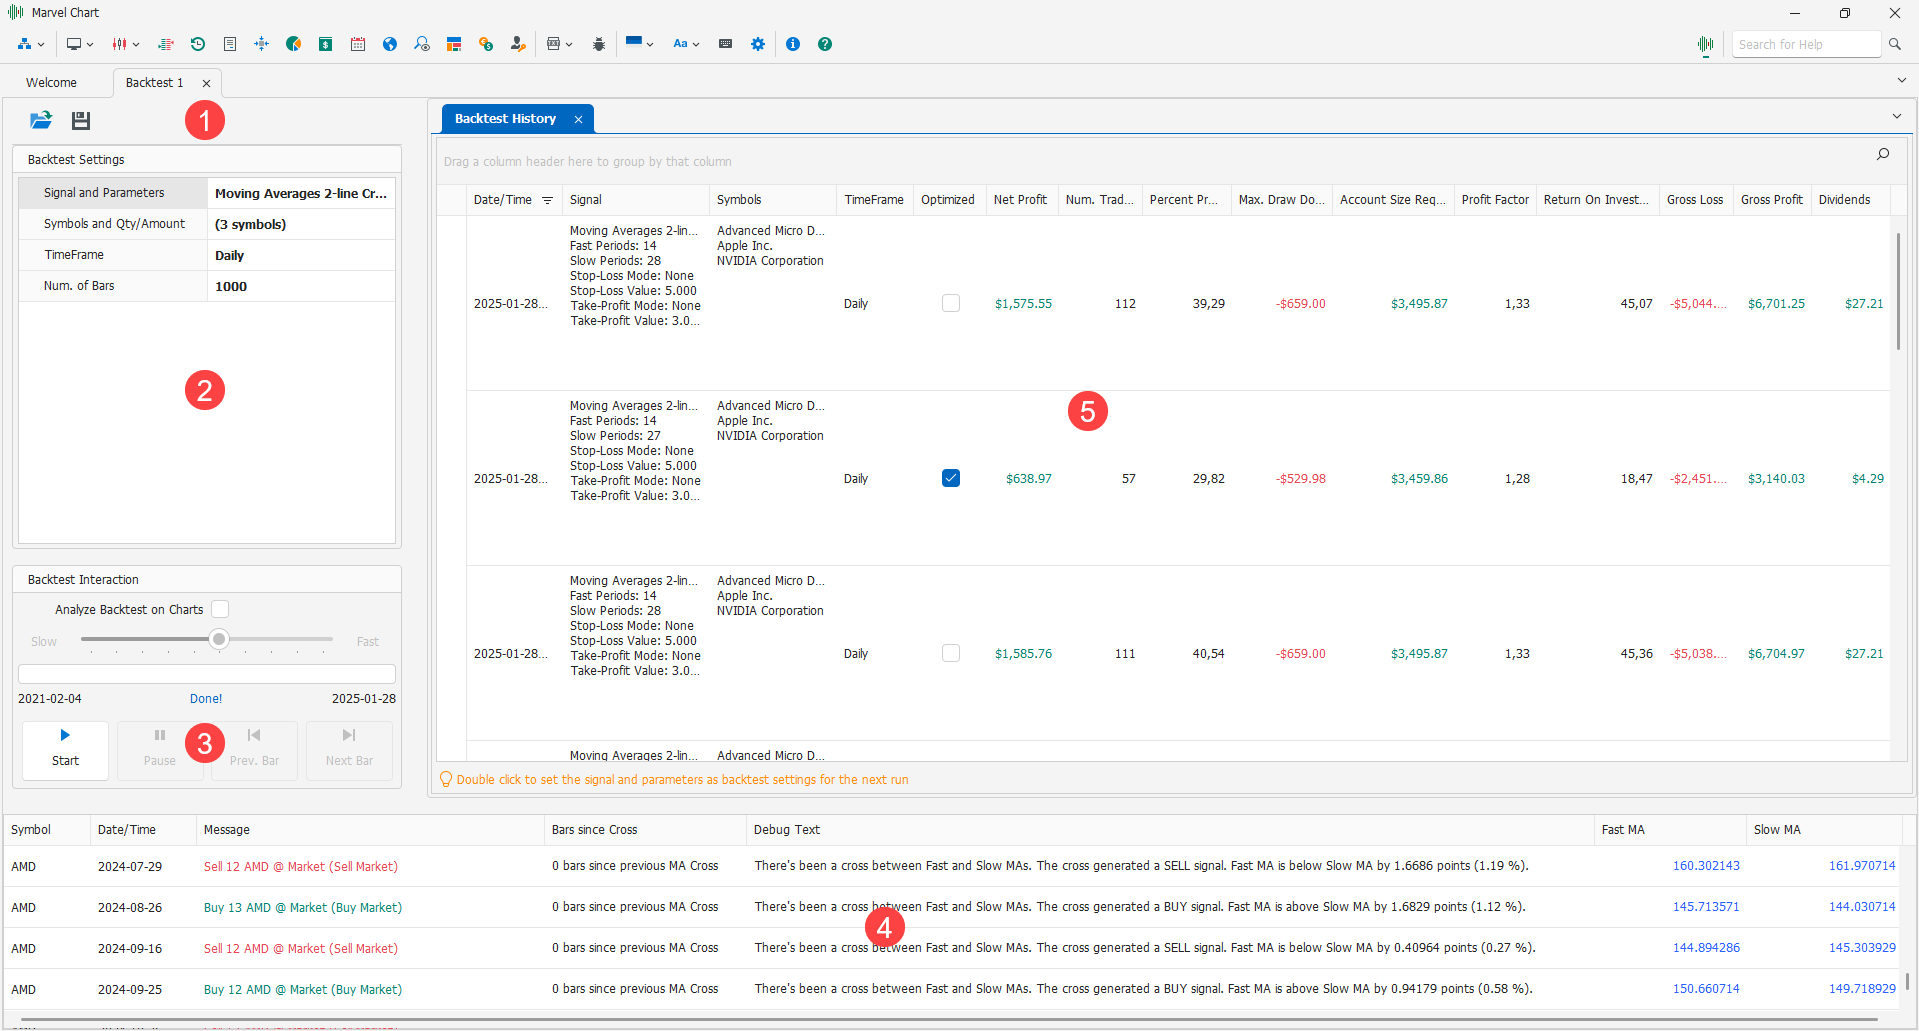
The Multi-Symbol Backtest feature allows you to perform Backtests and optimizations of a trading system applied to one or more symbols simultaneously and analyze the results obtained both in aggregate mode (a single result) and for each symbol. The document is divided into five sections:
Command Bar
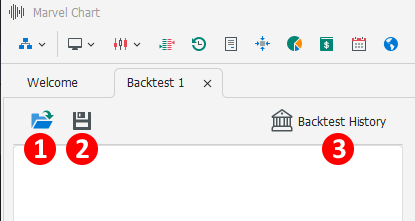
In the upper left part of the document is the Backtest command bar, which provides the following buttons:
Open Backtest - Opens a Multi-Symbol Backtest settings file from a previously saved file;
Save Backtest - Saves the current Multi-Symbol Backtest settings to file;
Backtest History - Shows the history of Multi-Symbol Backtests performed on the PC, including settings data and results. Using the Backtest History feature, it is possible to compare a result obtained some time ago with one just obtained.
Backtest Settings
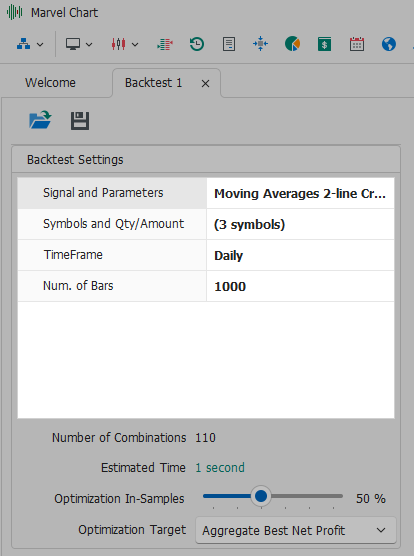
In this section there are the Backtest settings to be performed, they are divided into:
Signal and Parameters - Choice of the trading system to use and interaction with the related parameters;
Symbols and Qty/Amount - Choice of symbols to which to apply the trading system and related quantity and countervalue settings;
TimeFrame - Choice of the TimeFrame of the historical data on which to apply the trading system;
Num. of Bars - Number of historical data bars on which to apply the trading system;
Signal and Parameters
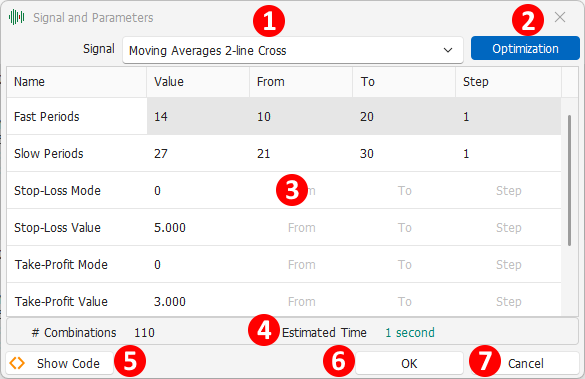
The trading system selection and parameter setting window allows you to customize the operation of the trading system for use in the Backtest. The window is composed of the following elements:
Signal - Drop-down box through which to choose the trading system to use in the Backtest. The trading systems are listed through a tree view and are grouped by category;
Optimization - On/Off button, enables or disables the Backtest optimization parameters setting. Any numeric parameter can be optimized. When optimization is active, three additional columns are displayed in the 3 parameter table: From, To and Step;
Parameters Table - Shows a list of the trading system's Input parameters. The available columns are:
Name - Name of the Input parameter;
Value - Value of the parameter;
From - Minimum value to use in the Inputs optimization;
To - Maximum value to use in the Inputs optimization;
Step - Inputs optimization range;
Preview of the combinations for optimization - If optimization is active, the number of Inputs combinations that have been configured and an estimate of how much time will be needed to complete the optimization of the trading system are shown below the 3 parameter table;
Show Code - Shows the source code of the trading system currently selected in the 1 Signal drop-down box. If not already installed on your PC, MarvelChart suggests installing the Microsoft Visual Studio development environment. However, you can view the source code in any text editor;
OK - Confirms the current settings and closes the window;
Cancel - Cancels the current settings and closes the window.
Symbols and Qty/Amount
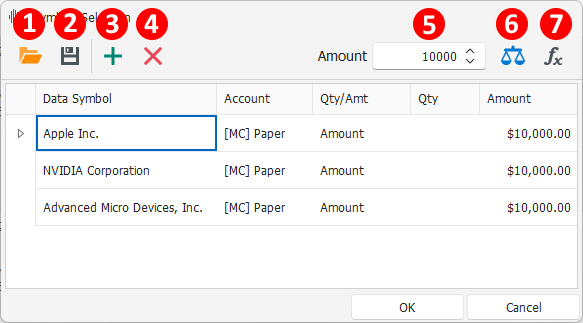
The window for setting the symbols you want to use in the Backtest and their quantities allows you to run the Backtest on more than one symbol in a single step. The window includes a bar with the following commands:
Open Symbols List - Opens a previously saved file containing the list of symbols and their quantity or amount values;
Save Symbols List - Saves the current list of symbols to a file, each with its own quantity or amount setting;
Add - Adds one or more symbols to the list;
Remove - Deletes the selected symbols from the list;
Amount - Amount to use for all symbols in the list, using the following buttons;
Equal Amount - Sets the same Amount value in all the symbols in the list;
Split Amount - Divides the Amount among all the symbols present in the list. Example: if the Amount is set to 100K, and there are 2 symbols in the list, each symbol will have an amount of 50K.
The symbols list is displayed as a table with the following columns:
Data Symbol - Name of the symbol used to obtain the historical data on which to apply the trading system;
Account - Account associated with the symbol on which to simulate the Backtest orders;
Qty / Amt - Allows you to configure the calculation method of the order quantity. The available choices are:
Fixed Quantity - Fixed quantity, generally used for Future or similar symbols;
Amount - Counter value, the quantity of each order will be calculated in such a way as to be equivalent to the Amount value set for the symbol. Generally used for Stock and similar symbols.
Qty - Quantity of the order, available only if Fixed Quantity has been chosen in the Qty / Amt box;
Amount - Amount of the order, available only if Amount has been chosen in the Qty / Amt box.
When adding symbols such as Stocks and similar, the default setting is Amount 1,000, while in all other cases, such as Future contracts, the default setting is Fixed Quantity 1.
Once you have completed the settings of the symbols and their quantities, you must confirm your choices by clicking on the OK button.
Optimization Settings
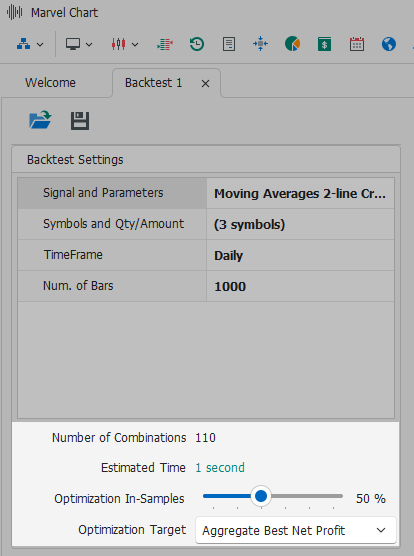
If at least one parameter optimization has been enabled in the Signal and Parameters section, an additional section appears at the bottom of the settings panel, consisting of:
Number of Combinations - Number of possible combinations of the parameters that have been set as to be optimized;
Estimated Time - Estimated time needed to complete the optimization, given the number of combinations, the number of symbols and the number of historical bars on which to run the Backtest. During optimization, the Backtest Commands and Interaction with the Historical Graph bar will display a continuously updated estimate of the time needed to complete the optimization;
Optimization In-Samples - Setting what percentage of the historical data to use to perform the optimization of the parameters. The remaining part will constitute the part of the historical data used to calculate the results of each possible combination of the Backtest. If the Optimization In-Samples parameter is set to 100%, the optimization will use all the historical bars to calculate the best possible combination of parameters, and these values will constitute the results of the Backtest itself, since there will be no historical data available to perform an Out-of-Samples calculation;
Optimization Target - Drop-down box from which to select how to calculate the best possible result during optimization. The available choices are:
Aggregate Best Net Profit - Calculates the best possible result using the same combination of optimization parameters on all symbols selected for the Backtest;
Individual Best Net Profit - Calculates the best possible result using different combinations of optimization parameters for each symbol selected for the Backtest.
Backtest Commands and Interaction with the Historical Chart
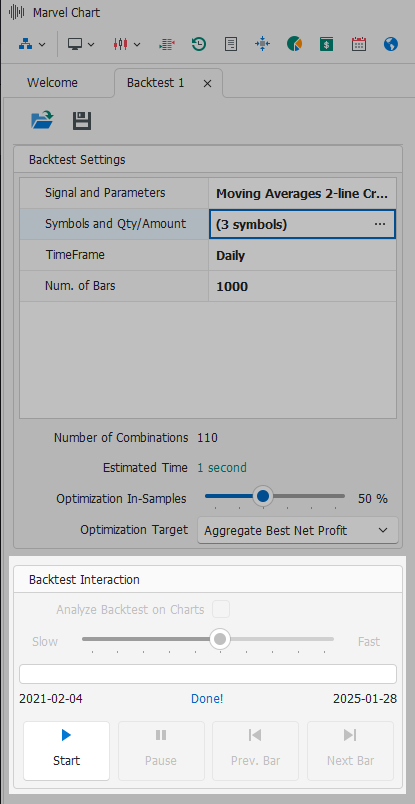
In this section of the Multi-Symbol Backtest document, there are commands to start and manage the Backtest execution. The section is composed of the following elements:
Analyze Backtest on Charts - allows you to activate the interaction of the Backtest with the historical charts of the selected symbols, so that you can analyze in detail the behavior of the Trading System applied to the Backtest. This setting is available only if no Trading System parameter has been set to be optimized. If at least one parameter has been set to be optimized, it will not be possible to interact with the Backtest via the historical charts of the symbols;
Backtest execution speed setting bar - with this bar you can vary the speed at which the Backtest is executed, slower by dragging the slider to the left, faster by dragging the slider to the right. The Backtest speed setting is only available when the Analyze Backtest on Charts box is active;
Progress bar, which indicates the percentage of progress of the Backtest compared to the available historical bars;
Start/Stop button, starts or stops the Backtest execution;
Pause/Resume button, which allows you to pause the Backtest execution to resume it at a later time. To interact via the historical data graph it is recommended to pause the Backtest execution;
Back button, which moves the Backtest execution back by one bar of historical data;
Forward button, which executes the Backtest for a single bar of historical data.
To interact with the historical data graph, it is recommended to set a low Backtest execution speed via the 2 bar and then pause the Backtest execution, using the Pause/Resume button 5 described above. Varying the speed and using the Pause button is useful to be able to see the graph and any indicators that scroll over time, then evaluate if/what changes to make to the Trading System.
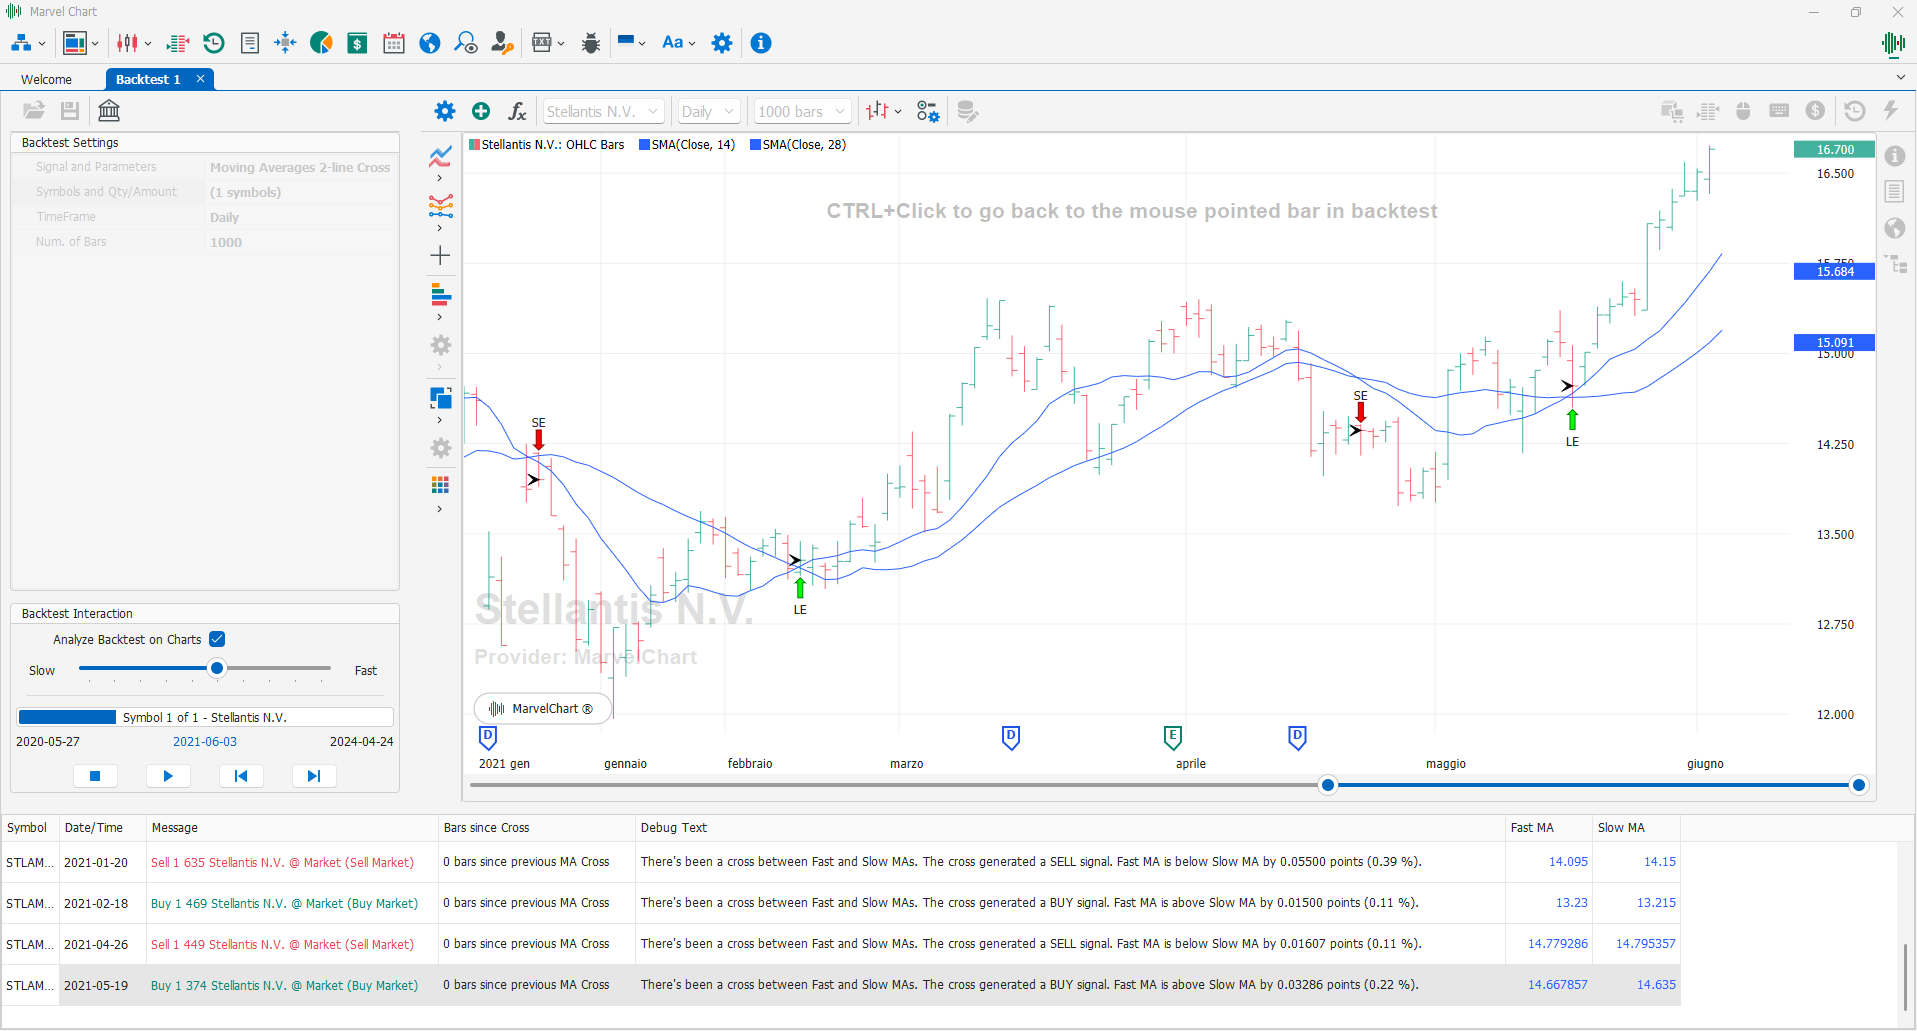
On the historical graph, holding down the CTRL key on the keyboard and clicking the left mouse button on a specific bar, the Backtest execution will be brought to that bar, moving the Backtest forward or backward in time.
Messages and Notifications

This section of the Multi-Symbol Backtest document shows the messages and notifications generated by the system during the execution of the trading system. The messages and notifications include:
Starting and completing the Backtest execution;
Downloading the historical data on which the Backtest is executed;
Moving the Backtest execution forward and/or backward;
New orders generated by the execution of the trading system.
The notifications related to the new orders generated by the execution of the trading system can include additional information, configured within the source code of the trading system signal. For more information, see the chapter Extending MarvelChart.
Backtest Results
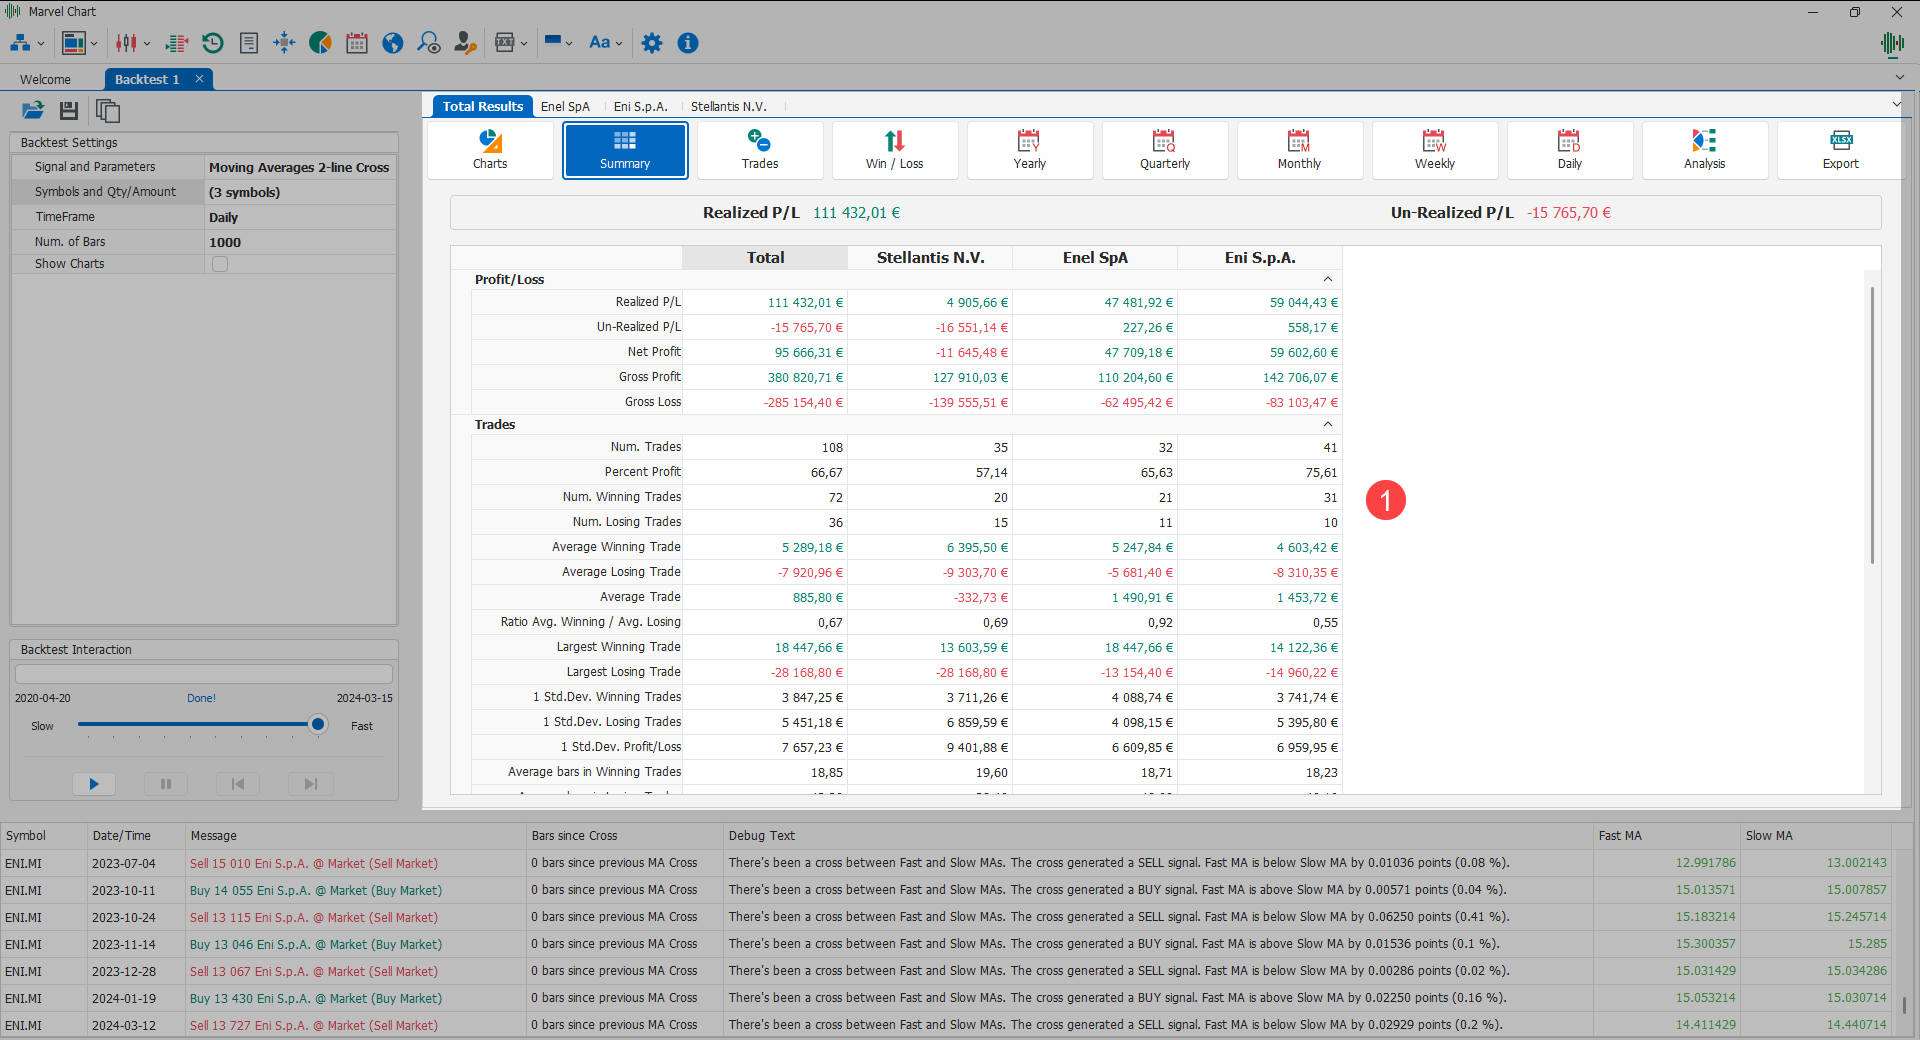
The Multi-Symbol Backtest Results panel 1 is the largest area of the document. Inside this panel, depending on the state of the Backtest system, the following views are shown:
Information panel, displayed when the Backtest is in a non-interactive state, during the download of historical data and/or during execution when the interaction between Backtest and historical data chart is not available or during optimization;
Historical data chart, displayed when it is possible to interact with the Backtest directly from this chart;
Results Panel without optimization if no Trading System parameter has been set to be optimized, or Results Panel with optimization if at least one Trading System parameter has been set to be optimized.
Backtest Results Panel without optimization

When the Backtest is run without optimization of any parameter the results are presented in a panel composed of:
An Aggregate Performance Report that contains the overall results of all the symbols selected in the Backtest;
A simple Performance Report for each symbol selected in the Backtest that contains the specific results of the symbol itself.
Results Panel for Backtest with Optimization
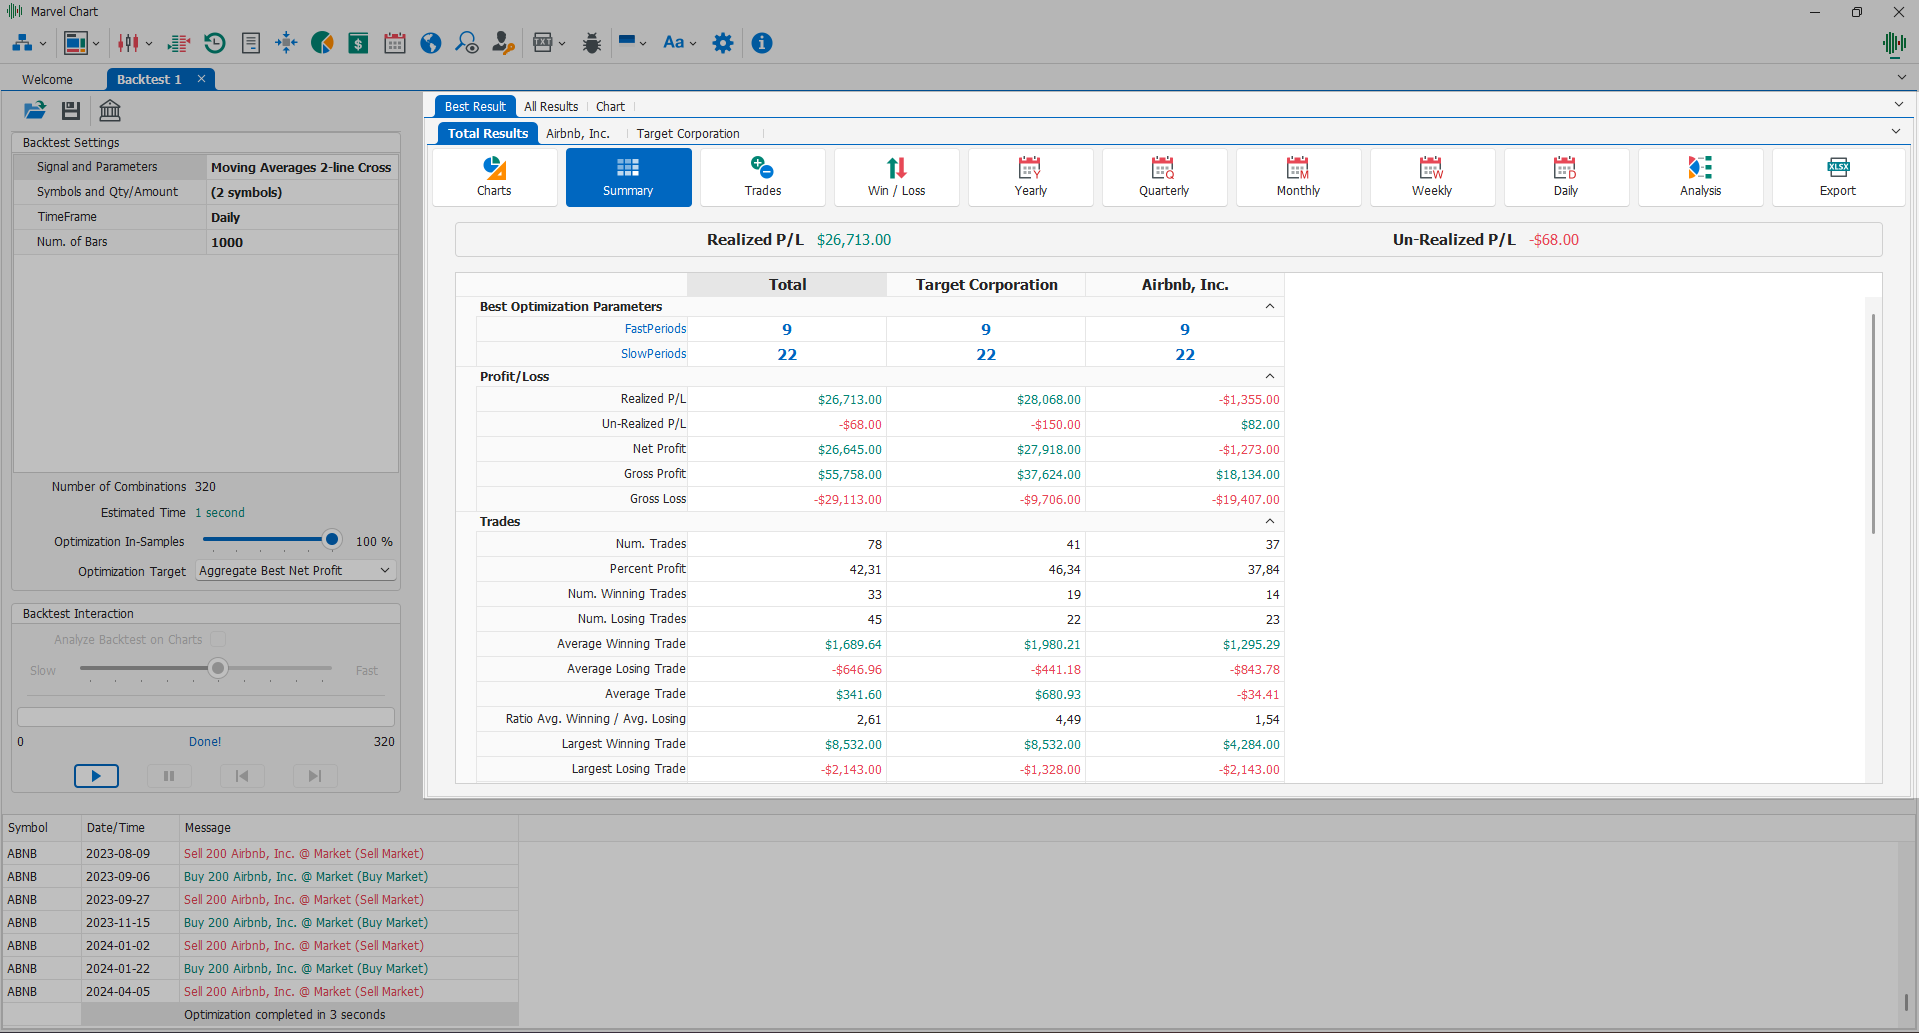
If you have set the optimization of at least one parameter in the Backtest, the results will be presented through a panel composed of different views. The list of views depends on the value chosen in the Optimization Target parameter.
Results with Optimization Target equal to Aggregate Best Net Profit
If Optimization Target is set to the value Aggregate Best Net Profit the results panel will show the tabs:
Results with Optimization Target equal to Individual Best Net Profit
If Optimization Target is set to Individual Best Net Profit the results panel will show the tabs:
Inside the Best Result tab, in the reports related to the individual symbols on which the backtest was performed, an additional tab, Optimization, will be presented, which will display the list of Backtest combinations that were tested and the related results, in tabular form.
In this case the All Results and Chart tabs are not present as the results are calculated independently for each symbol.
Best Result

This tab presents the best results obtained through the optimization of the Backtest parameters. The best result is calculated by extracting the Net Profit measure obtained from all possible combinations of the Backtest optimization parameters.
It is presented through a panel composed exactly like the Backtest Results Panel without optimization, with the only difference that in the Summary view a section is added that shows the values of the optimization parameters that led to obtaining that particular result.
All Results
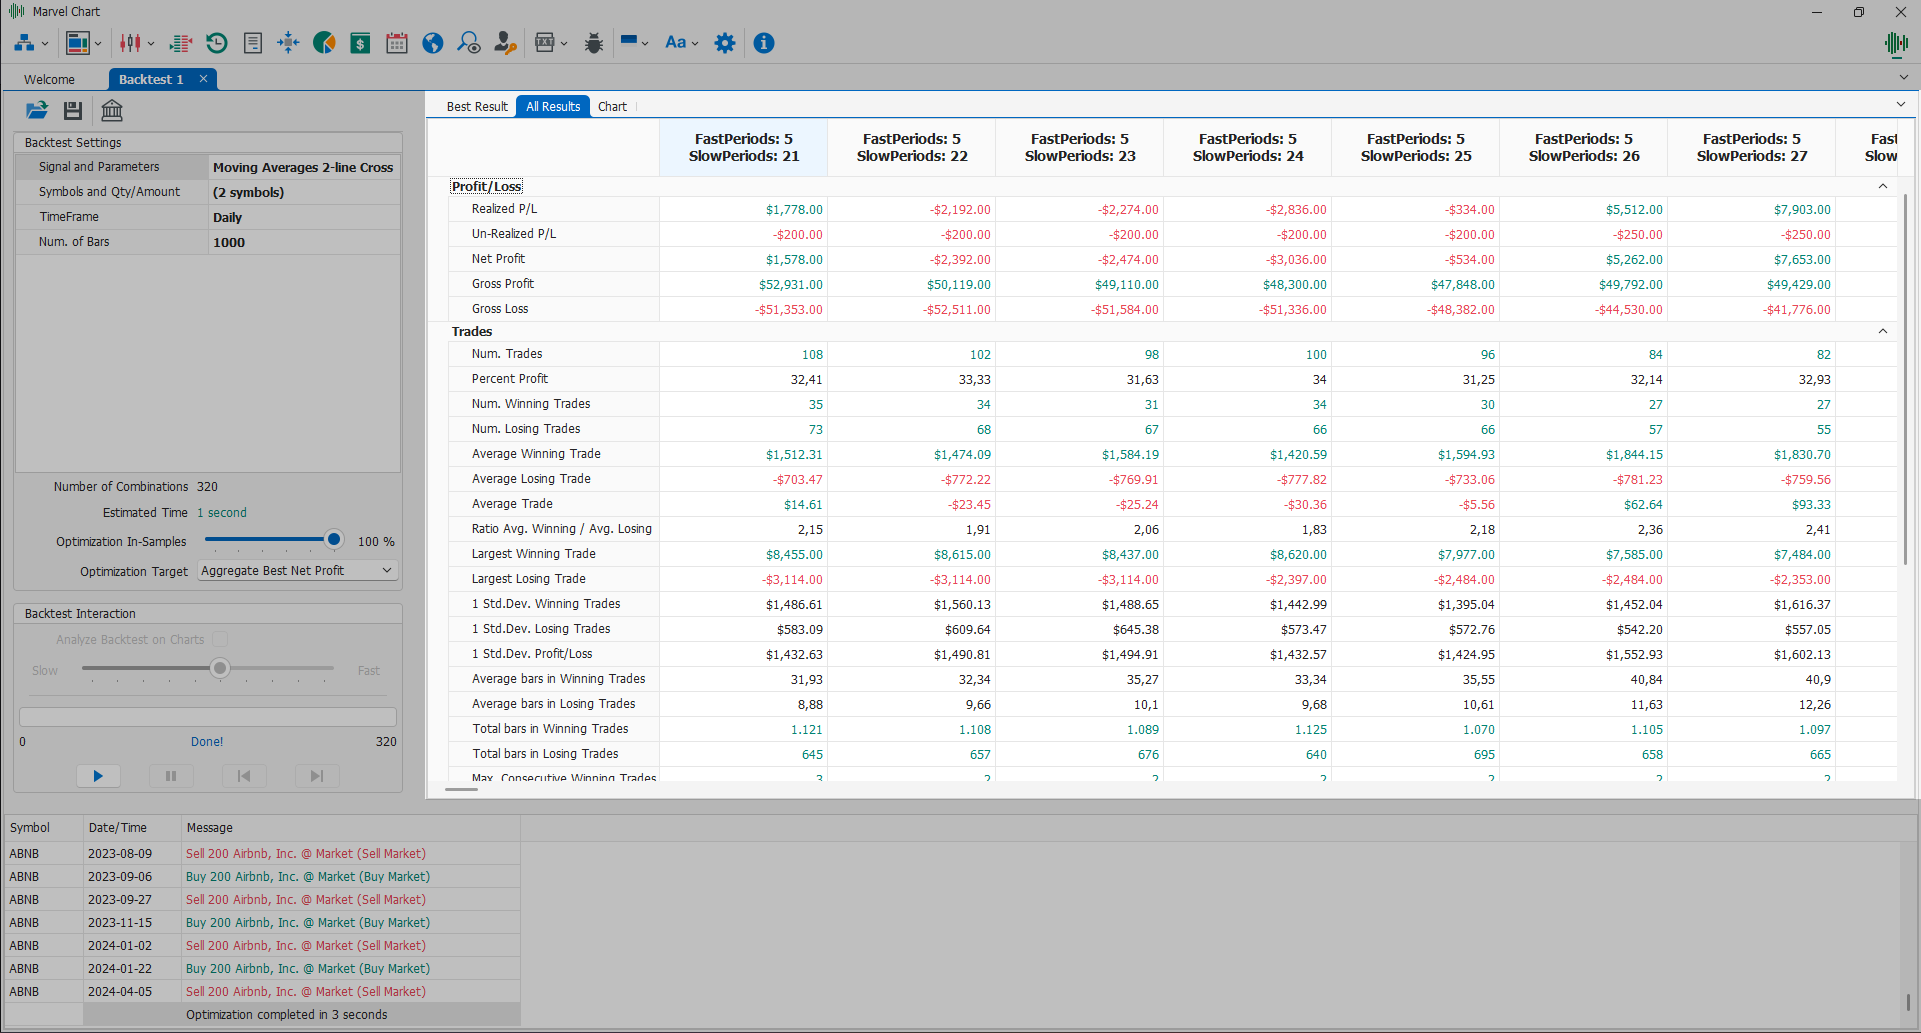
This tab shows the results obtained for each combination of the Backtest optimization parameters. The results are presented through a grid, with a column for each combination of the optimization parameters, while the result measures are listed as rows.
Chart
This tab can present two types of views:
2D Chart View - This view is present only when the optimization consists of a single parameter;
3D Chart View - This view is present only when the optimization consists of multiple parameters at the same time;
2D Charts
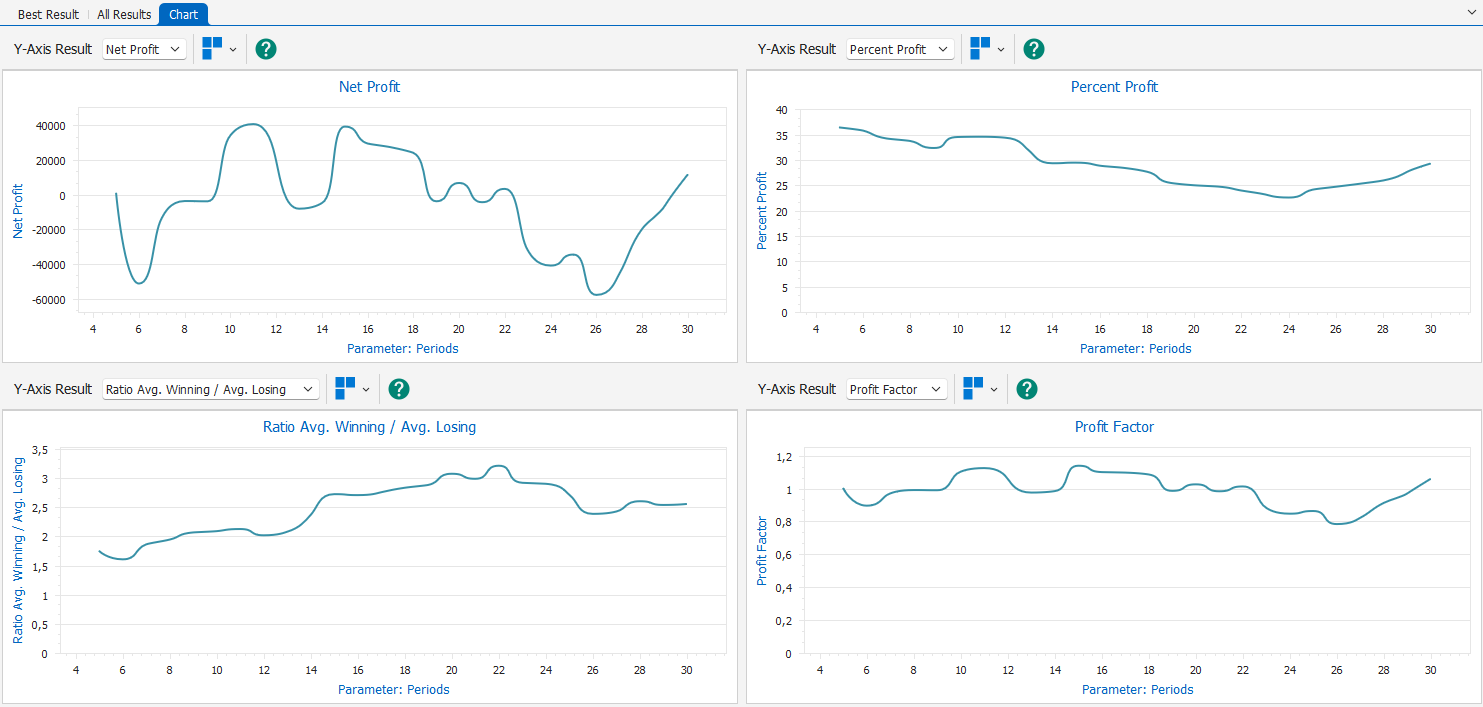
In this type of view it is possible to display 1, 2 or 4 two-dimensional charts, which show the trend of various measures of the Backtest results depending on the value of the only optimized parameter. In the command bar of each chart the following buttons are available:
Measure Selection - Drop-down box from which to choose the measure to display in the corresponding graph;
Number of Graphs - Menu from which to choose how many graphs to have in the tab, the layout of the graphs is predetermined;
Help - Shows/Hides a help text that describes the characteristics of the displayed measure.
In each chart there is a Cross-Hair that displays the data relating to the position of the mouse cursor, indicating the name of the optimization parameter, its value for that specific position, and finally the value of the selected measure of the Backtest results. It is also possible to Zoom in on each graph using the mouse wheel.
3D Chart
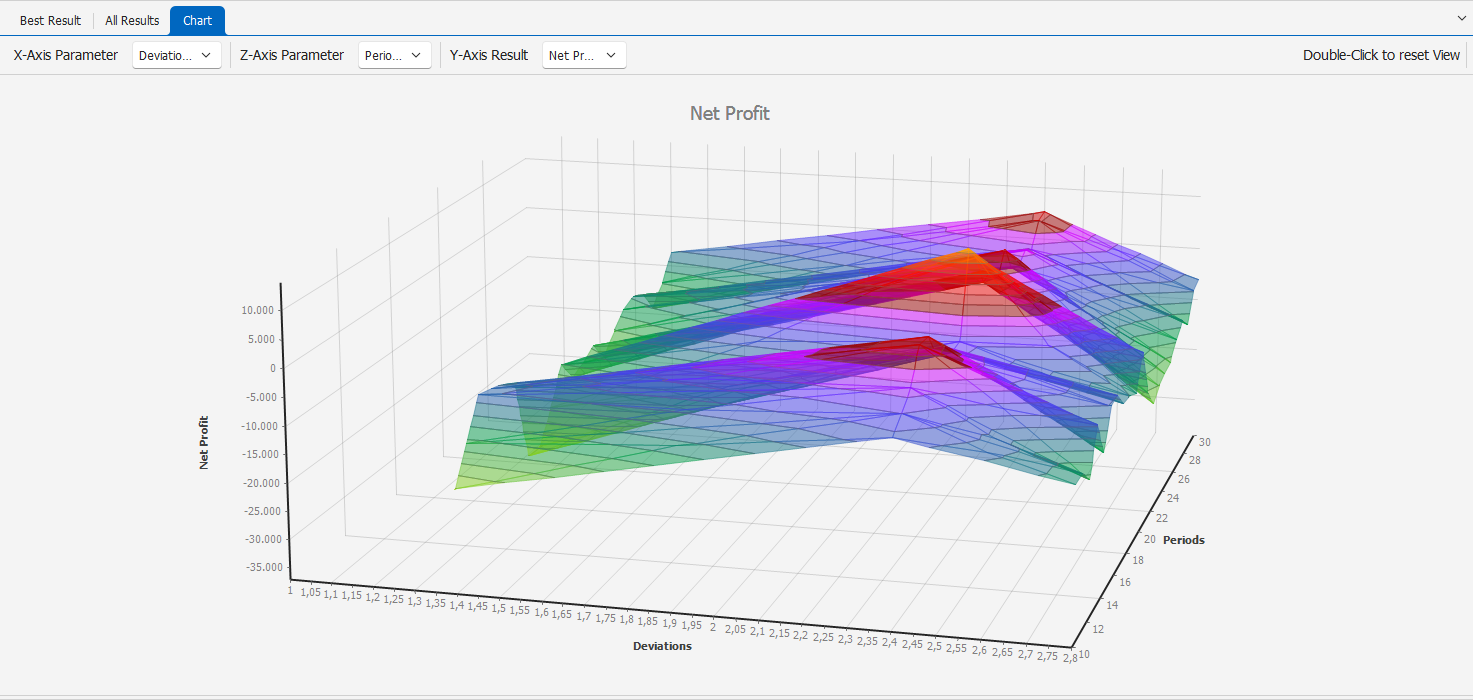
In this type of view, a three-dimensional chart is shown that can represent the trend of a specific measure of the Backtest results based on the combinations of 2 optimization parameters. At the top of the view there is a bar with the commands:
X-Axis Parameter - Drop-down box to select the optimization parameter to use for the X-axis of the chart;
Z-Axis Parameter - Drop-down box to select the optimization parameter to use for the Z-axis of the chart;
Y-Axis Result - Drop-down box to select the measure of the Backtest results to display in the chart.
You can interact with the chart using the mouse:
Zoom - To change the zoom of the chart use the mouse wheel;
Rotation - Hold down the left mouse button to rotate the graph in all directions.
To restore the Zoom and Rotation features to their initial values, simply double-click the left mouse button on the graph.
Backtest History
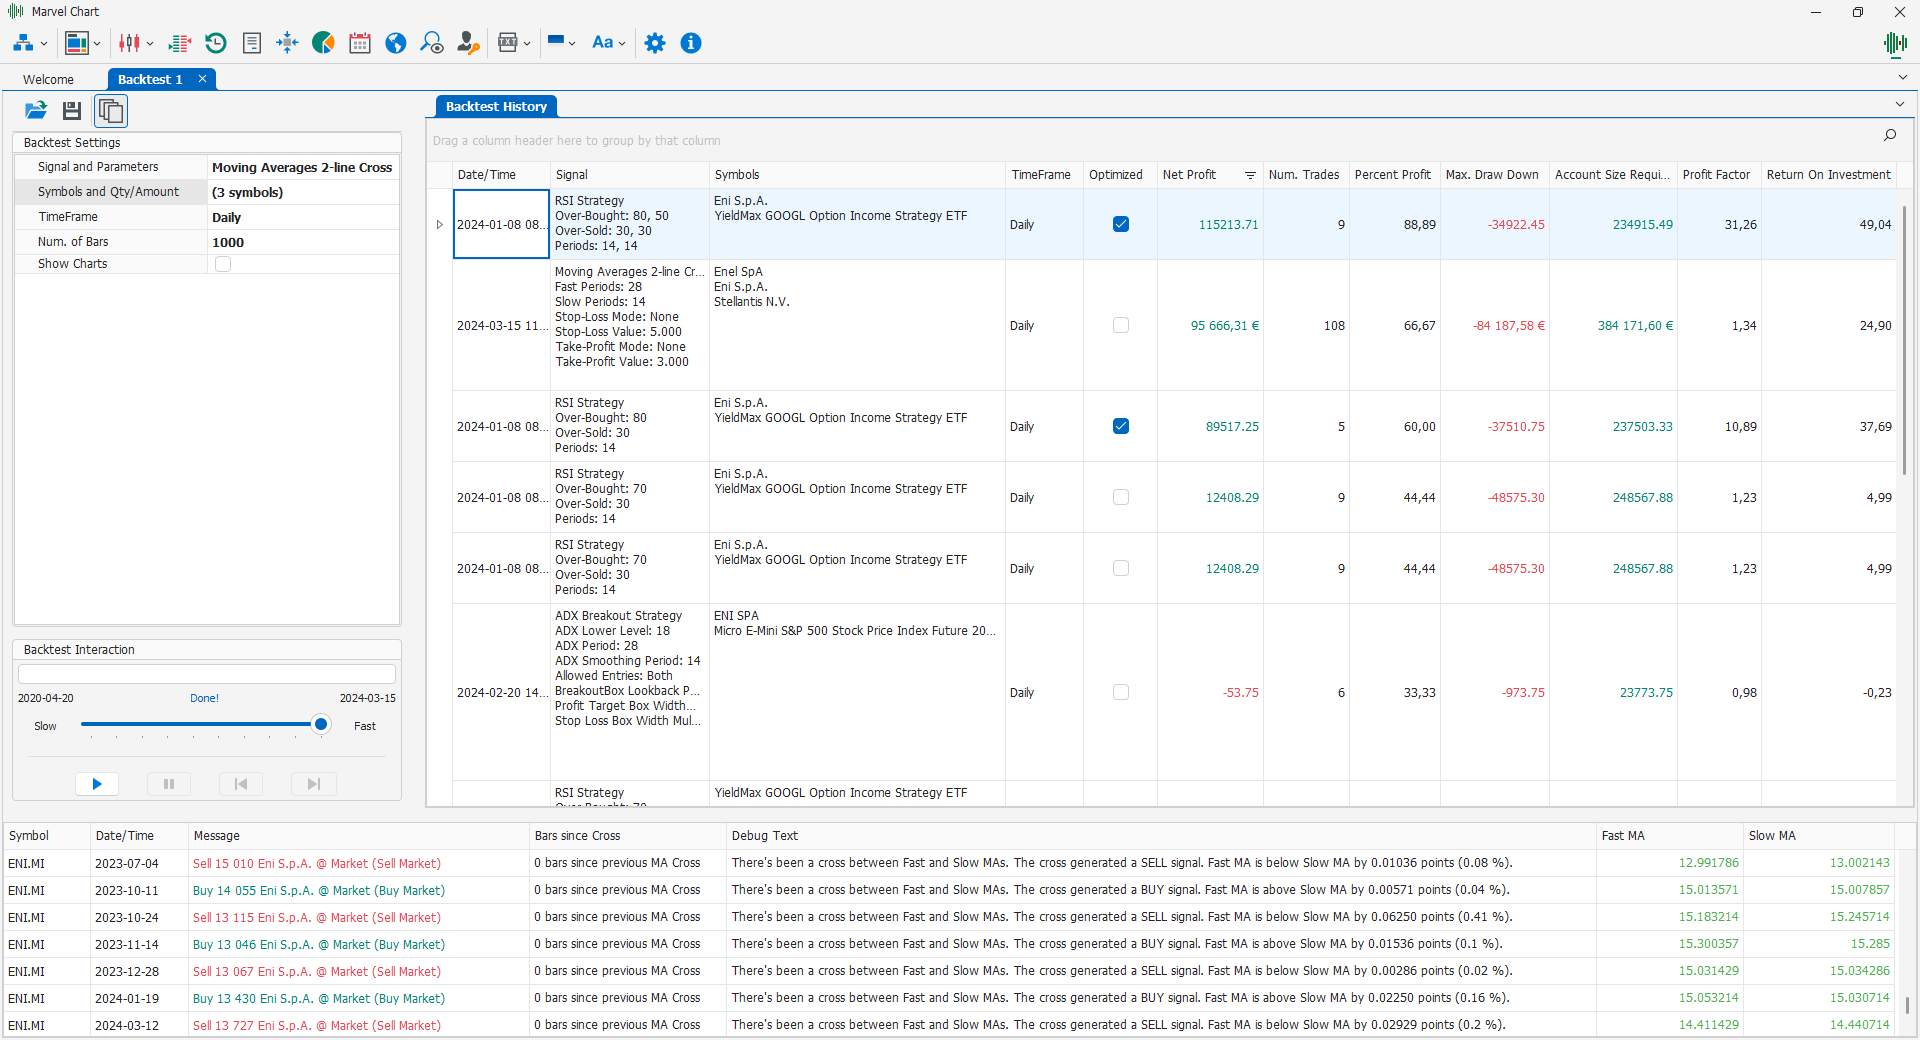
This view presents a list of settings and results of up to 500K Multi-Symbol Backtests executed over time. The available columns are:
Date/Time - Date and time the Backtest was executed;
Signal - Name of the signal and its parameters;
Symbols - List of symbols on which the Backtest was executed;
TimeFrame - TimeFrame of the historical data;
Optimized - Checkbox indicating whether the Backtest had optimization parameters;
Realized P/L - Profit/Loss realized;
Un-Realized P/L - Unrealized Profit/Loss resulting from any Open Position still in existence;
Net Profit - Net profit, equal to the sum of Realized P/L and Un-Realized P/L;
Num. Trades - Number of trades executed;
Percent Profit - Percentage of profitable trades;
Max. Draw-Down - Maximum Draw-Down, i.e. maximum potential loss of trades;
Account Size Required - Amount necessary to execute the trading system, such as to sustain the Max. Draw-Down but at the same time have sufficient liquidity to completely execute the new trades;
Profit Factor - Statistical value equal to the ratio between Gross Profit and Gross Loss;
Return On Investment - Statistical value equal to the ratio between Net Profit and Account Size Required, expressed as a percentage;
Gross Profit - Sum of Profits of profitable trades only;
Gross Loss - Sum of Losses of unprofitable trades only;
Num. Winning Trades - Number of profitable trades;
Num. Losing Trades - Number of unprofitable trades;
Average Winning Trade - Average Profit of profitable trades;
Average Losing Trade - Average Loss of unprofitable trades;
Average Trade - Average Profit/Loss of all trades, profitable and unprofitable;
Ratio Avg. Winning / Avg. Losing - Ratio between Average Winning Trade and Average Losing Trade;
Largest Winning Trade - Maximum among Profits of profitable trades;
Largest Losing Trade - Maximum among Losses of unprofitable trades;
1 Std. Dev. Winning Trade - Standard Deviation of Profit of profitable trades, i.e. distance from the relative mean;
1 Std. Dev. Losing Trade - Standard Deviation of Loss of unprofitable trades, i.e. distance from the relative mean;
1 Std. Dev. Profit/Loss - Standard Deviation of Profit/Loss of trades, both profitable and unprofitable, i.e. distance from the relative mean;
Average bars in Winning Trades - Average duration of profitable trades, expressed as number of historical bars;
Average bars in Losing Trades - Average duration of unprofitable trades, expressed as number of historical bars;
Total bars in Winning Trades - Total duration of profitable trades, expressed as number of historical bars;
Total bars in Losing Trades - Total duration of unprofitable trades, expressed as number of historical bars;
Max. Consecutive Winning Trades - Maximum number of consecutive profitable trades;
Max. Consecutive Losing Trades - Maximum number of consecutive unprofitable trades;
Max. Contracts/Lots Held - Maximum number of shares/contracts/lots held;
Kelly Bet Fraction (K%) - The Kelly criterion (also known as Kelly strategy or Kelly Bet) is the result of a formula useful for sizing the amount to invest in the trading system;
Sharpe Ratio - Statistical value that measures the Extra-Return compared to the Risk-Free Rate;
Sortino Ratio - Statistical value, similar to the Sharpe Ratio, that measures the Extra-Return compared to the Risk-Free Rate;
Time From Start - Time elapsed between the opening of the first trade and the closing of the last.
You can remove one or more results from the list by selecting the relevant rows and pressing the Del key on the keyboard, or by moving columns by holding down the left mouse button on the column header. For more information, see the chapter Data Grid Features.
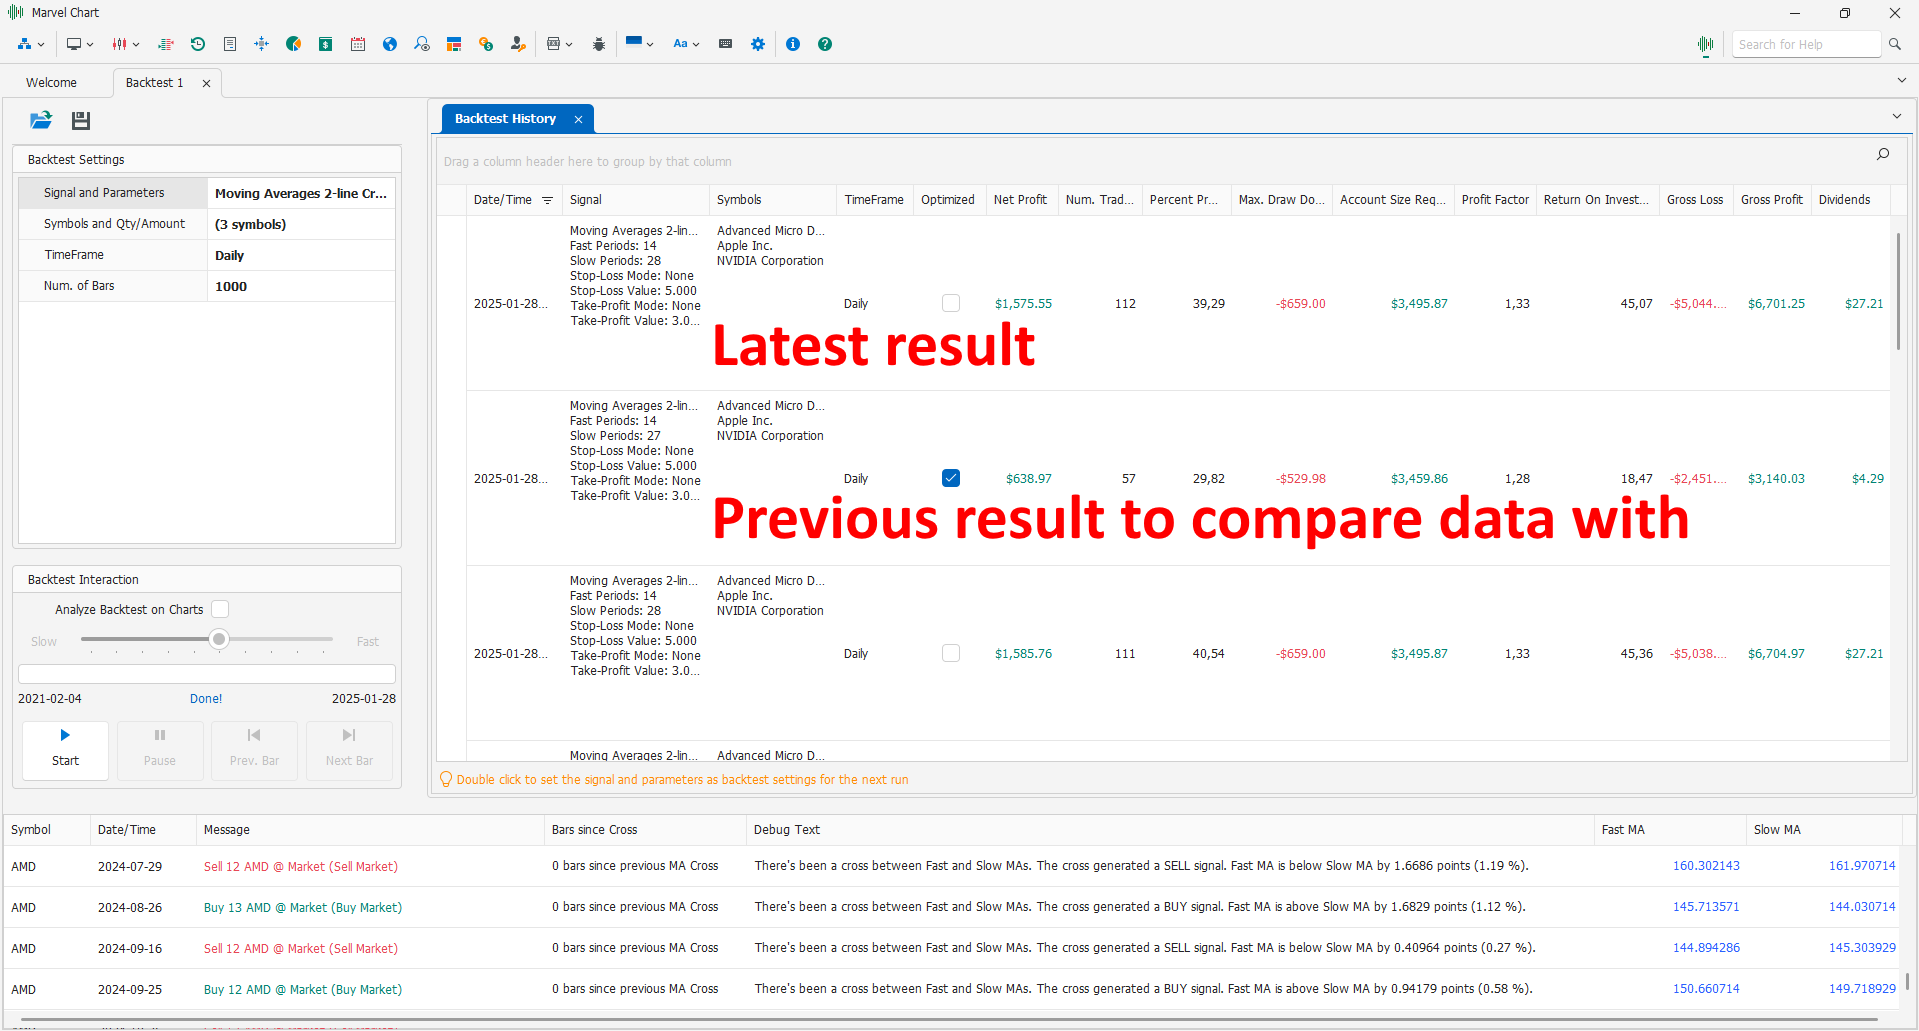
Using the Backtest History feature, you can compare a result obtained some time ago with one just obtained.