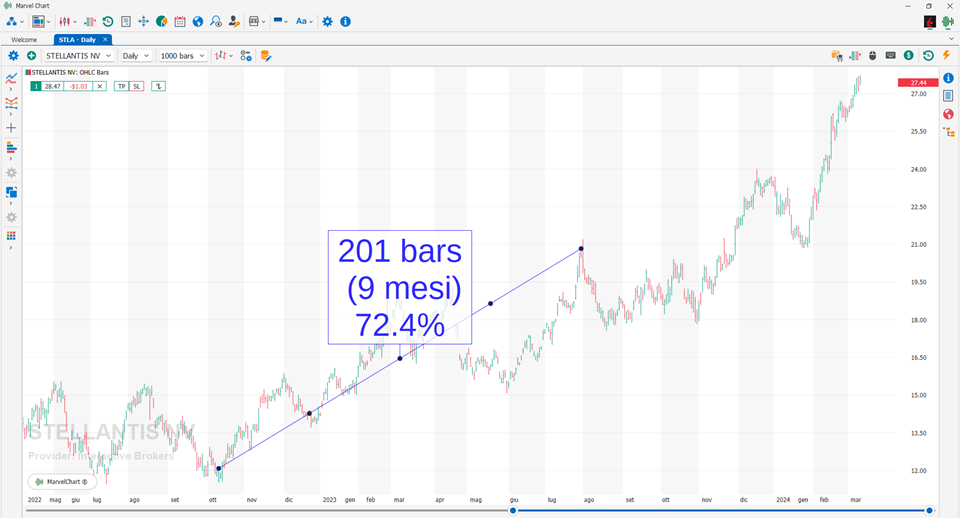
Info Line

It represents a line drawn between two points chosen on the chart, showing the difference in time and value between them. To add the line to the chart, simply click on the position on the chart where you want to place it, hold down the mouse button and move to the second point, and finally release the button. After adding the line to the chart, you can move it by clicking one of the control points of the line itself to select it and then dragging it to the new position while holding down the left mouse button.
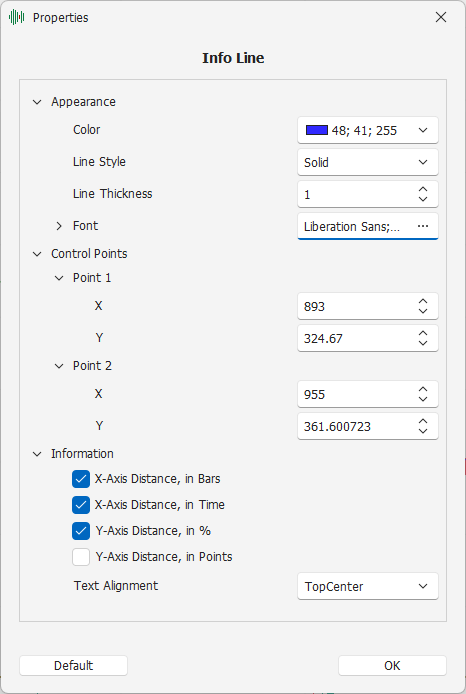
Settings

Appearance - Settings related to the drawing mode
Color - Color of the line
Line Style - Drawing style of the line
Line Thickness - Thickness of the line
Font - Font used to draw the text associated with the line
Control Points - Control points of the line
Point 1 - First control point of the line
X - Position relative to the X-axis, expressed as a bar number
Y - Position relative to the Y-axis
Point 2 - Second control point of the line
X - Position relative to the X-axis, expressed as a bar number
Y - Position relative to the Y-axis
Information - Settings related to the data to be displayed
X-Axis Distance, in Bars - Toggles the display of the time distance expressed in number of bars
X-Axis Distance, in Time - Toggles the display of the time distance expressed as calendar time
Y-Axis Distance, in % - Toggles the display of the distance of the values expressed as a percentage
Y-Axis Distance, in Points - Toggles the display of the distance of the values expressed in points
Text Alignment - Select the position where to display the information texts