Chart


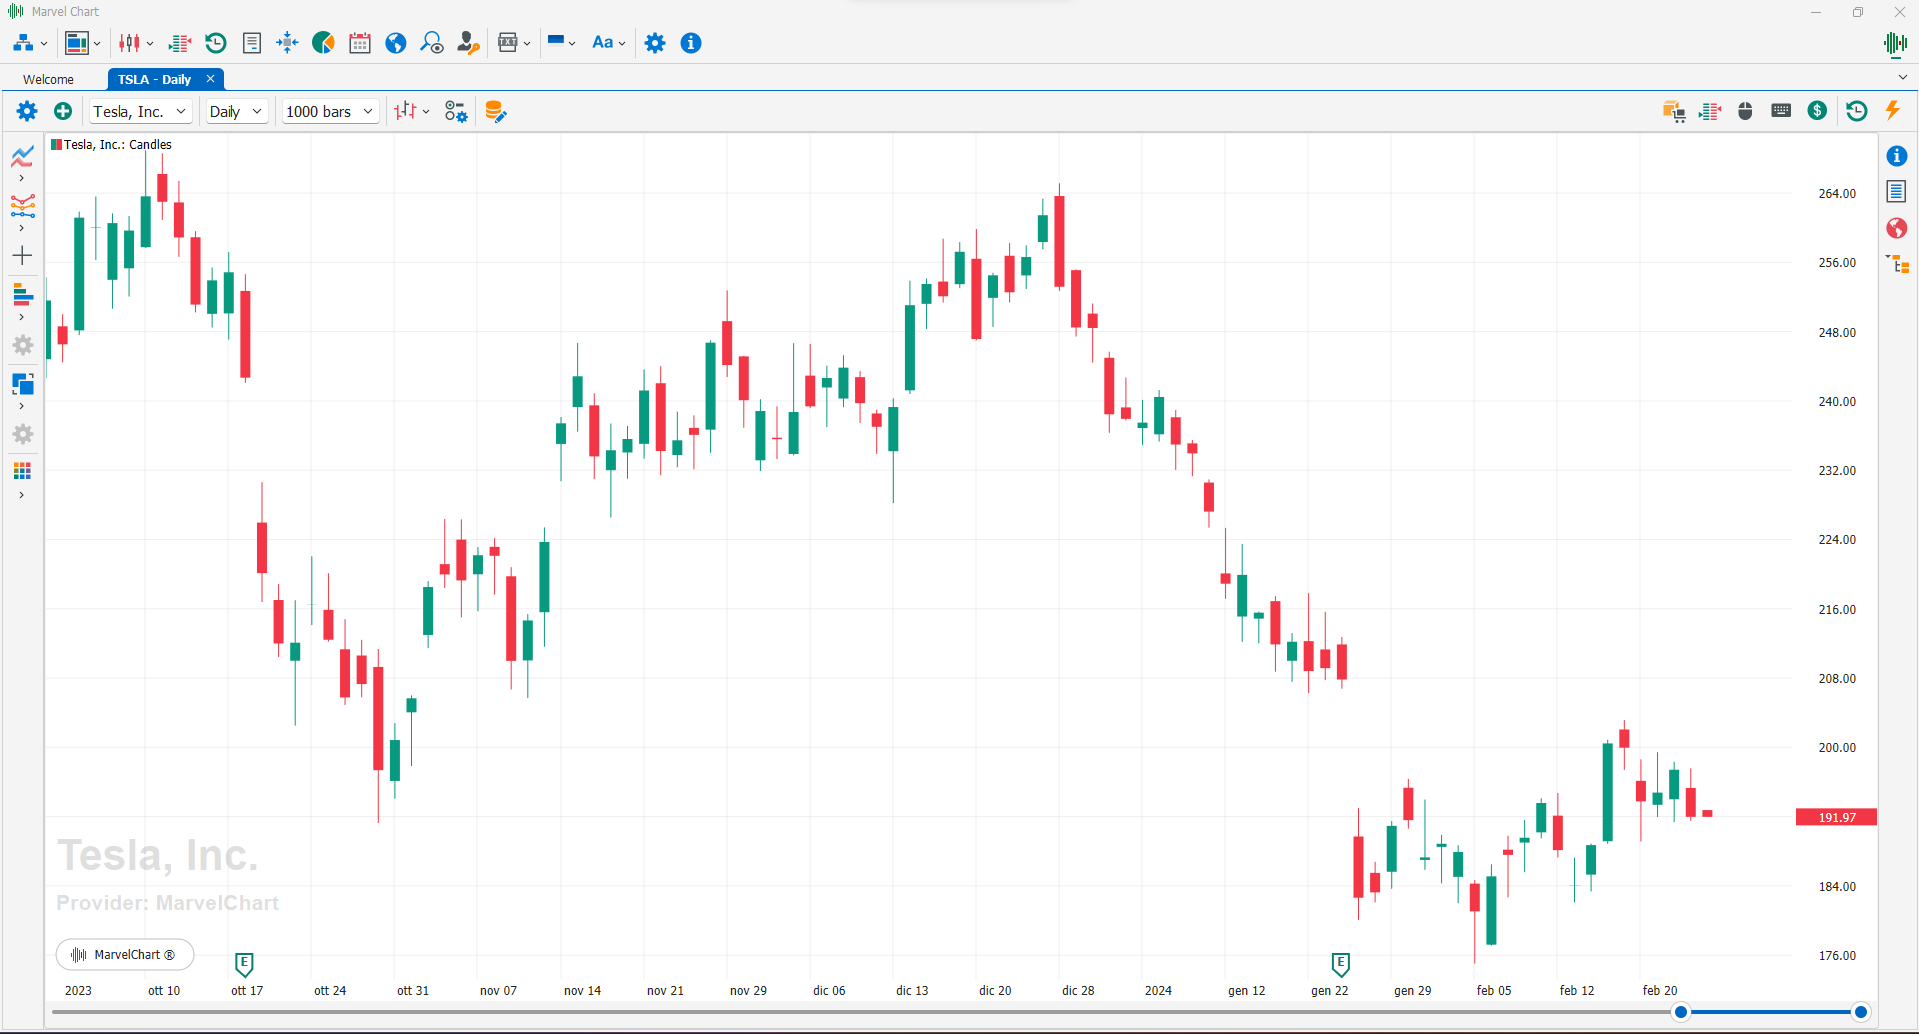
The Chart feature is the main feature of MarvelChart. This window is accessed by clicking on the Chart button on the Welcome Page 1 or from the drop-down button 2 on the main Marvel bar.

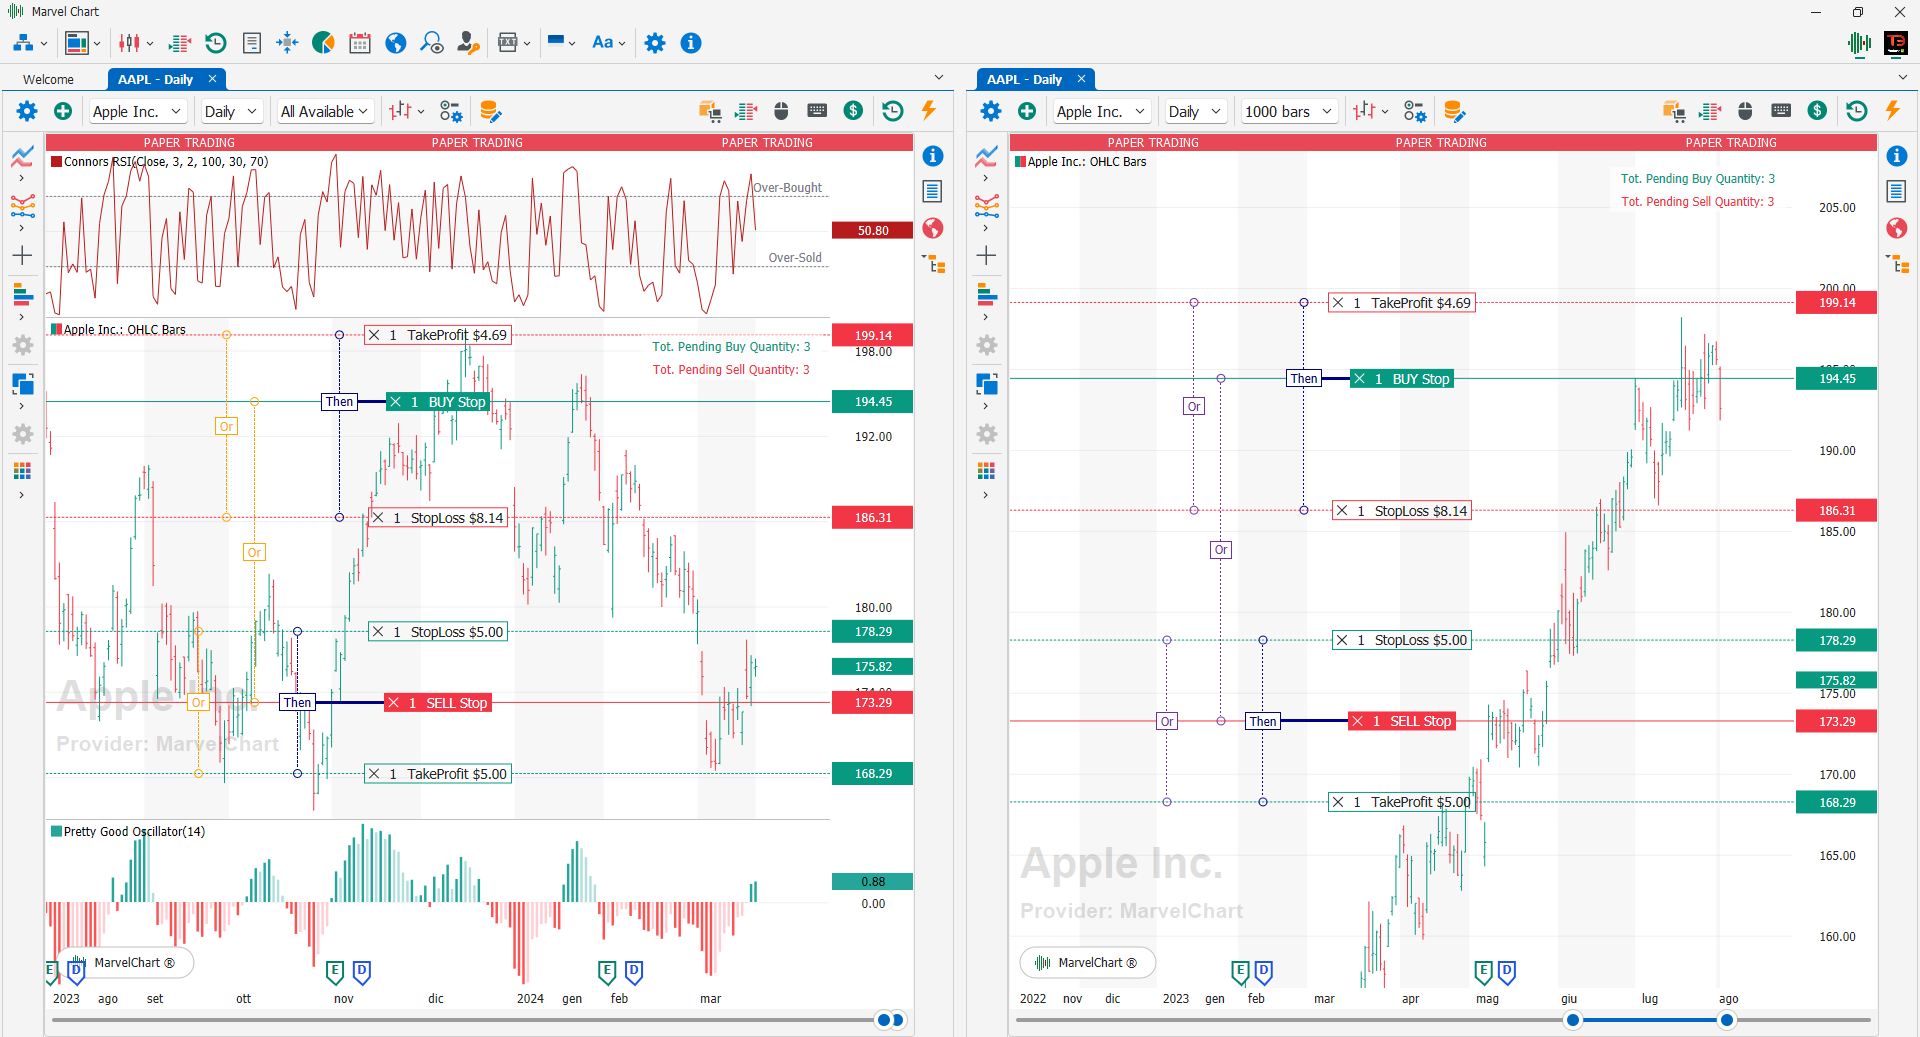
In the Chart you can set the chart style you want to display, add one or more indicators from over 200 types, enter, modify and remove buy and sell orders with all the settable types, Order Cancel Order, Limit Order, Stop Order, Market Order. Link groups of self-excluding orders, direct orders to a Broker or more Brokers, different from the one from which you are receiving the data. Run Backtest and Automatic Trading, program Trading Systems and indicators. It is possible to analyze volumes with over 900 types of visualizations, view the Company Profile on which the chart is being studied, have news and, through the Object Tree interact with the indicators on the chart. Use the One-Click Mouse Trading function, the Keyboard Trading function, have a watchlist of favorite assets and perform a complete fundamental analysis of the stock. Have the Y-axis prices displayed on a percentage or logarithmic scale. See, if connected to the MarvelChart data source, the Dividends, Earnings and Stock Splits. It is also possible to compare multiple symbols and build spreads between two or more stocks by subtracting or adding the values of the stocks that make up the spread. From the Chart you can decide to have multiple stocks on the same window using the Docking function. Along the edges of the Chart are positioned some command bars to access the many functions provided.