Dividends, Earnings and Splits
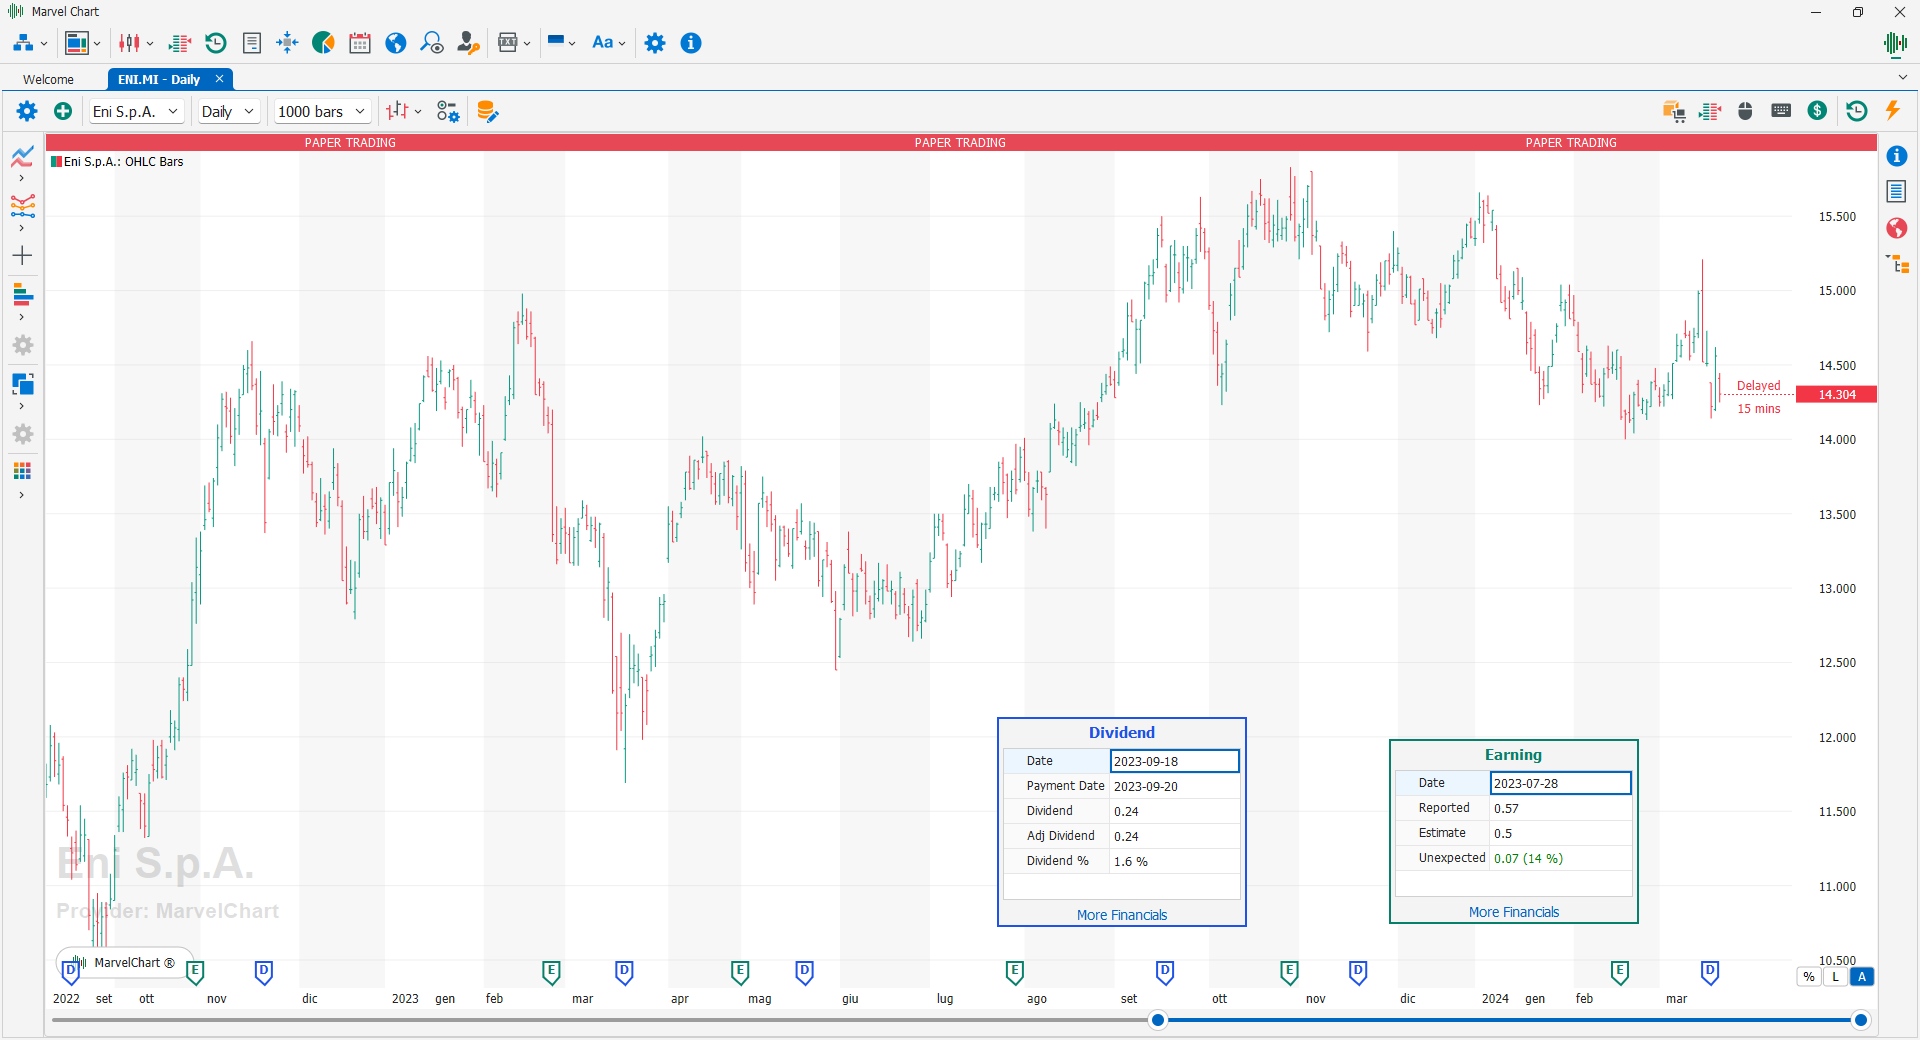
MarvelChart has the function of displaying dividends, earnings and stock splits directly within the Chart.
The presence of dividends, earnings and splits is highlighted by colored markers arranged along the X-axis of the Chart, corresponding to the dates associated with the aforementioned events, using different colors and indications depending on the type of event:
Dividends - They are highlighted by blue markers and the letter D;
Earnings - They are highlighted by green markers and the letter E;
Splits and Merge - They are highlighted by orange markers and the letters S and M respectively.
Left-clicking on one of the markers will display a detail window for the related event.
Details for Dividends type events
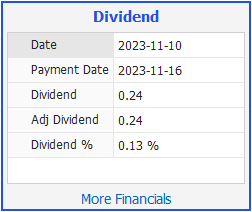
Date - Dividend ex-dividend date;
Payment Date - Dividend payment date;
Dividend - Dividend amount per single share;
Adj. Dividend - Dividend amount per single share, adjusted based on previous Splits;
Dividend % - Percentage value of the dividend compared to the Last price on the ex-dividend date;
More Financials - Opens the Financial Data Details window.
Details for Earnings events
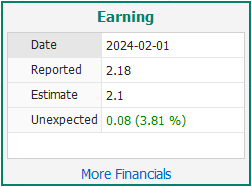
Date - Earnings date;
Reported - Actual Earnings (EPS);
Estimate - Estimate of Earnings before Actual;
Unexpected - Difference between Reported and Estimate, also as a percentage of Estimate;
More Financials - Opens the Financial Data Details window.
Details for Splits and Merges
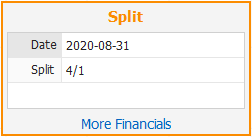
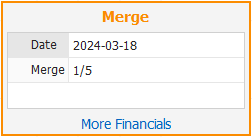
Date - Date of the split or merge;
Split/Merge - Split or merge ratio. A ratio greater than 1 indicates that a stock has been split into multiple parts, while a ratio less than 1 indicates that multiple stocks have been merged into a single stock. In the example on the left, a ratio of 4 to 1 indicates that each individual stock has been split into 4 parts. In the example on the right, a ratio of 1 to 5 indicates that 5 stocks have been merged into a single stock;
More Financials - Opens the Financial Data Details Window.
