Financial Information

Financial Information is accessed by clicking on the 1 button of the MarvelChart main commands bar.
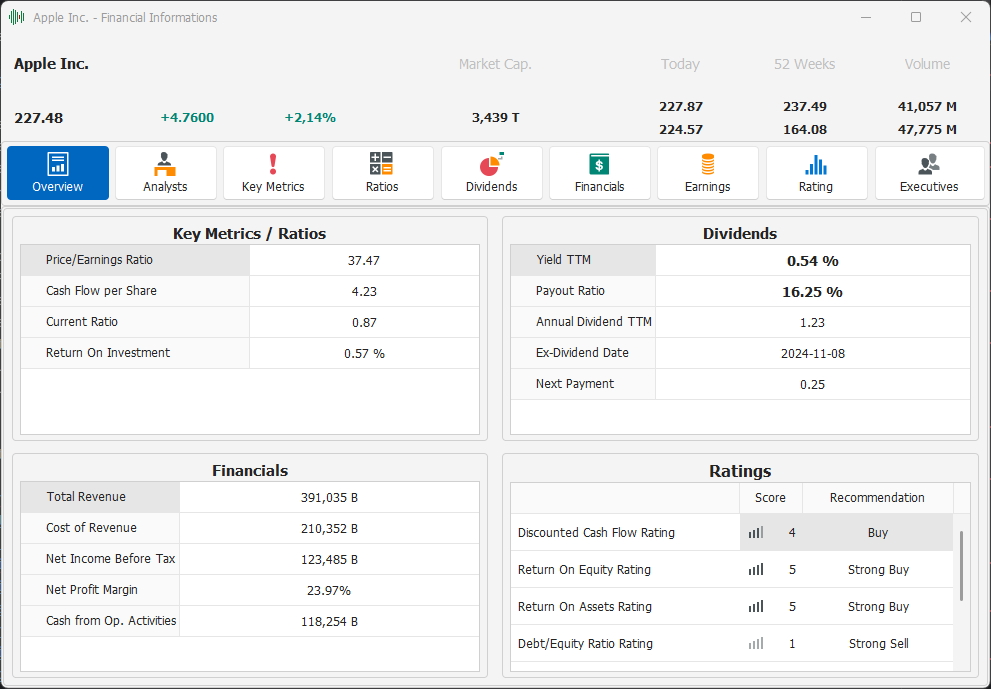
The Financial Information window allows you to view the financial data of the selected symbol in detail. The data available in the various tabs that make up the Financial Information window allow for a detailed financial analysis of the asset. The upper part of the window shows some essential information relating to the symbol. By clicking on the buttons you have access to additional data that will allow a complete evaluation of the asset. The essential information is:
Name of the asset;
Last Price;
Change from the opening price of the day;
Change from the opening price of the day in percentage;
Market capitalization;
Maximum and minimum price of the day;
Maximum and minimum price of the last 52 weeks;
Daily and average trading volume of the last 52 weeks.
The central part of the window displays the details of the financial information of the asset, divided into different sections:
Overview - General preview;
Analysts - Data regarding analysts' opinions;
Key Metrics - Main financial information;
Ratios - Financial information, usually expressed as ratios;
Dividends - Dividends;
Financials - Public financial data;
Executives - Information about executives;
Overview
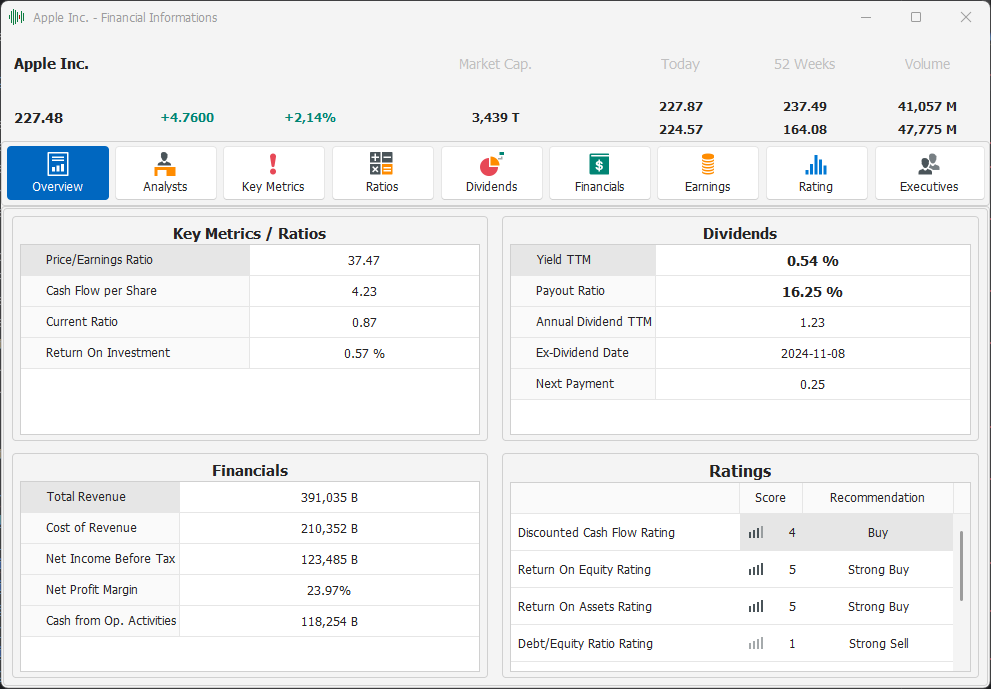
This tab shows a summary with some parameters related to financial data. The tab groups the data to be displayed in different blocks of information. Left-clicking on the header of a block will open the tab with all the detailed information related to the block itself.
Analysts
This tab shows the data related to analysts' evaluations. It is divided into 3 sections:
Summary - Summary of the data provided by analysts;
Recommendations - Analysts' recommendations;
Price Targets - Price targets provided by analysts;
Summary
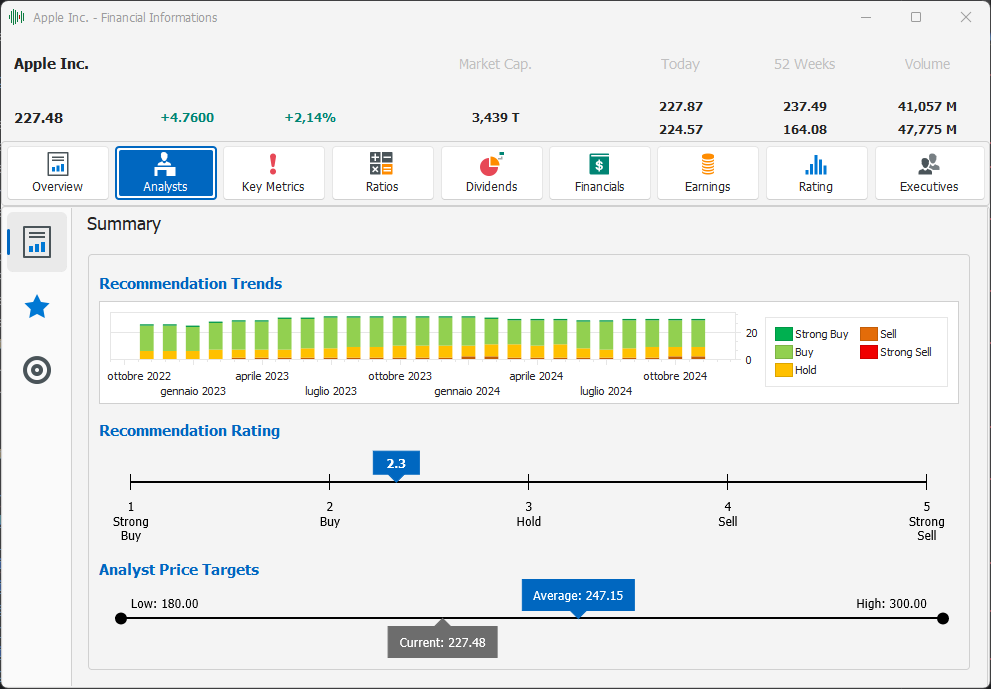
This view shows a summary of the data provided by analysts, including a chart with the recommendations and their trend over time, a bar showing the current average of the recommendations, and a bar showing the minimum, maximum and average price targets, in addition to the Last price position.
Recommendations
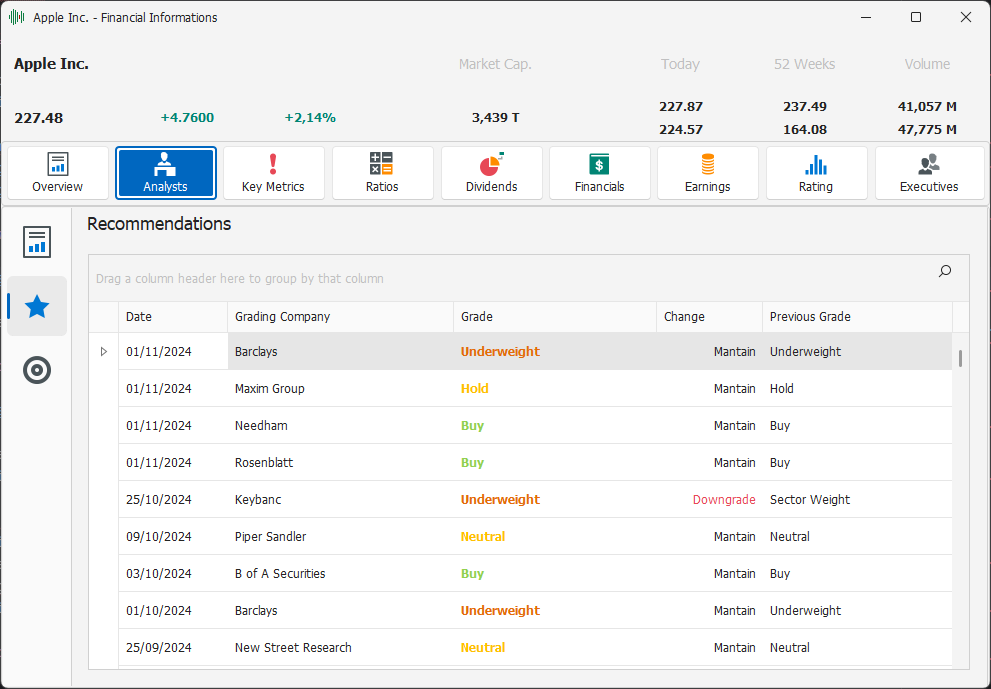
This view displays recommendations provided by analysts. The available information includes:
Date - Date the recommendation was published;
Grading Company - Rating Company that provided the recommendation;
Grade - Current recommendation;
Change - Change on the previous recommendation;
Previous Grade - Previous recommendation.
Price Targets
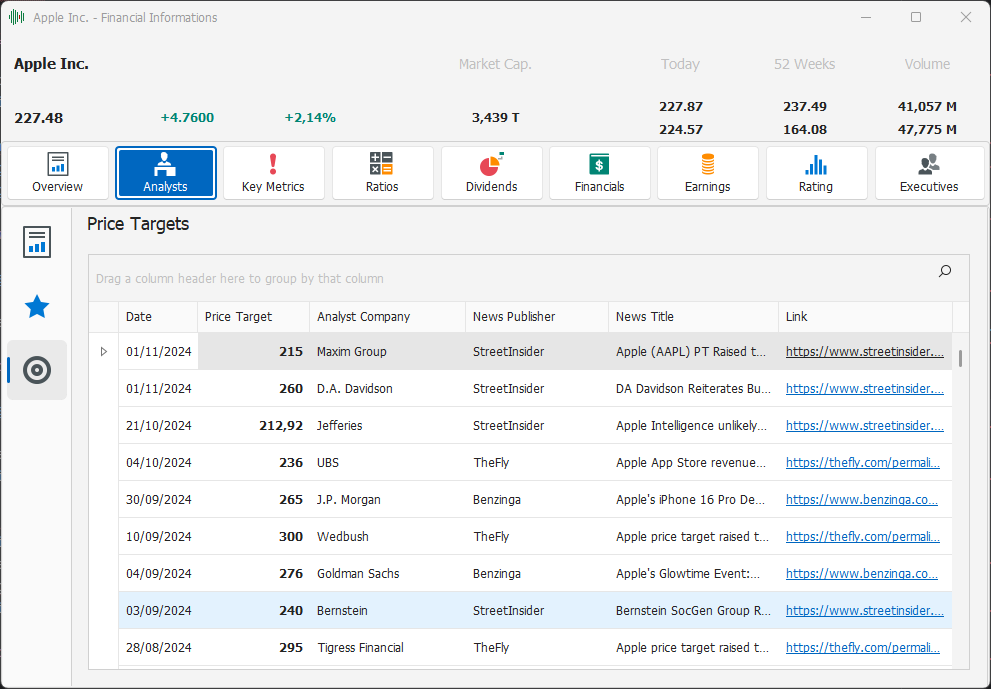
This view displays the price targets provided by analysts. The information available includes:
Date - Date of publication;
Price Target - Price target;
Analyst Company - Analyst company that provided the price target;
News Publisher - Source of the new price target news;
News Title - Title of the new price target news;
Link - Link to the web page with the new price target news;
Adj. Price Target - Dividend-adjusted target price;
Analyst Name - Name of the analyst that provided the price target;
News Publisher Link - Link to the source of the news of the new price target;
Price when posted - Price of the asset at the time of publication of the new price target.
Key Metrics
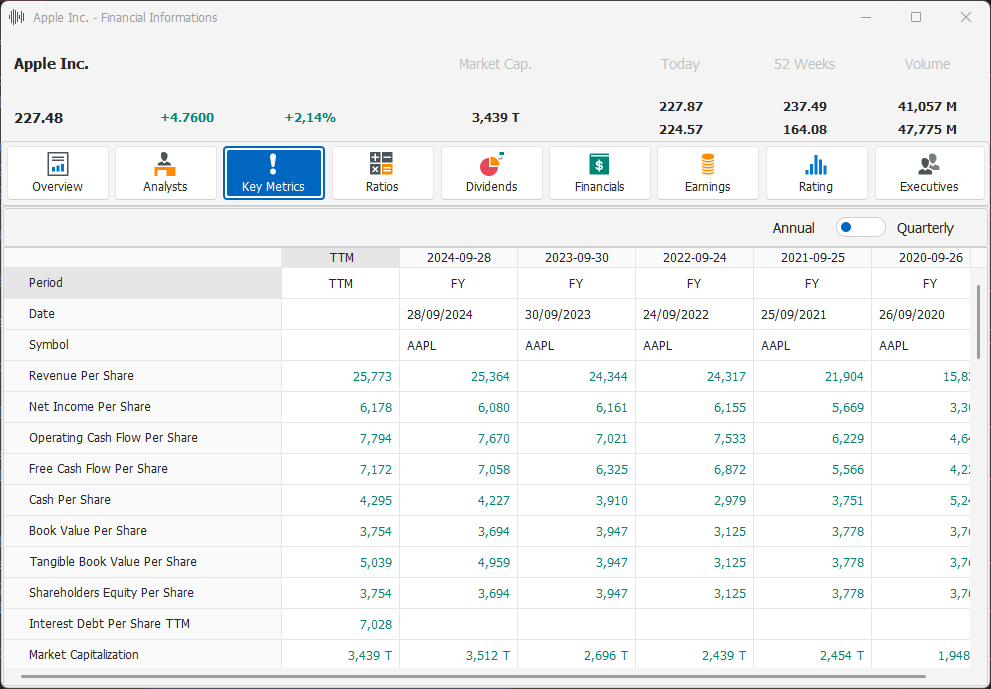
This tab shows the main information of the financial data of the selected asset. You can display annual or quarterly data. The annual data also includes the TTM (Trailing-Twelve-Months, last 12 months) data. The data for each analysis period is displayed in columns, ordered from most recent to least recent, with the TTM values always at the top of the list.
Ratios
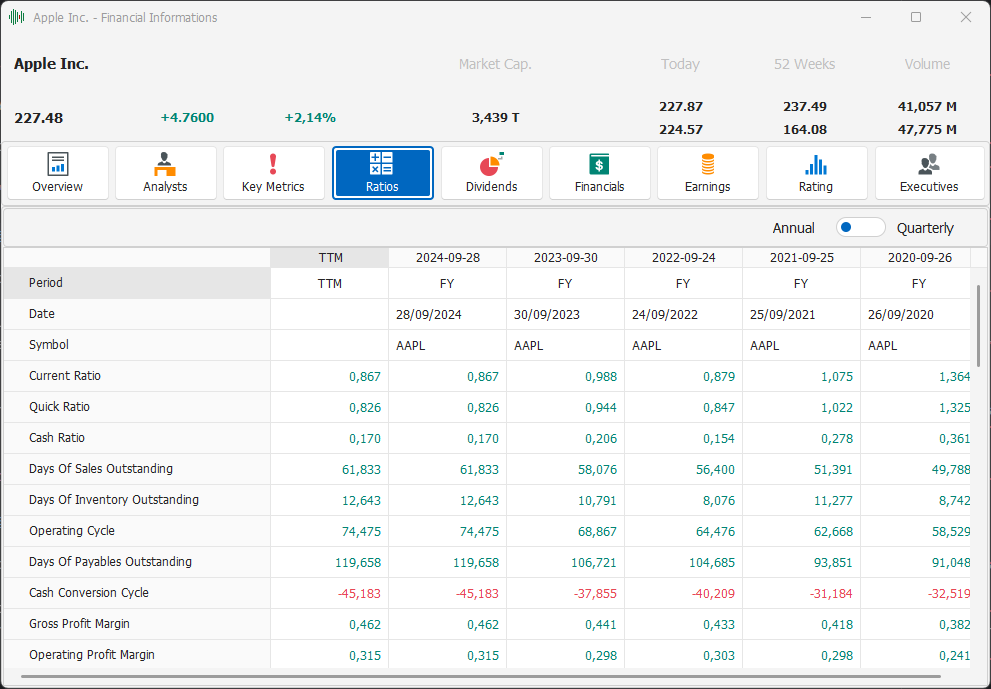
This tab displays secondary information about the selected asset's financial data, that is, information that is normally expressed as a ratio between other financial information. You can display annual or quarterly data. Annual data also includes TTM (Trailing-Twelve-Months, last 12 months) data. Data for each analysis period is displayed in columns, sorted from most recent to least recent, with TTM values always at the top of the list.
Dividends
The Dividends tab allows you to analyze the dividends detached from the selected asset. I divided into two sections:
Historical Dividends - Historical dividends;
Dividends Calendar - Calendar of the next dividends that the asset will pay.
Historical Dividends
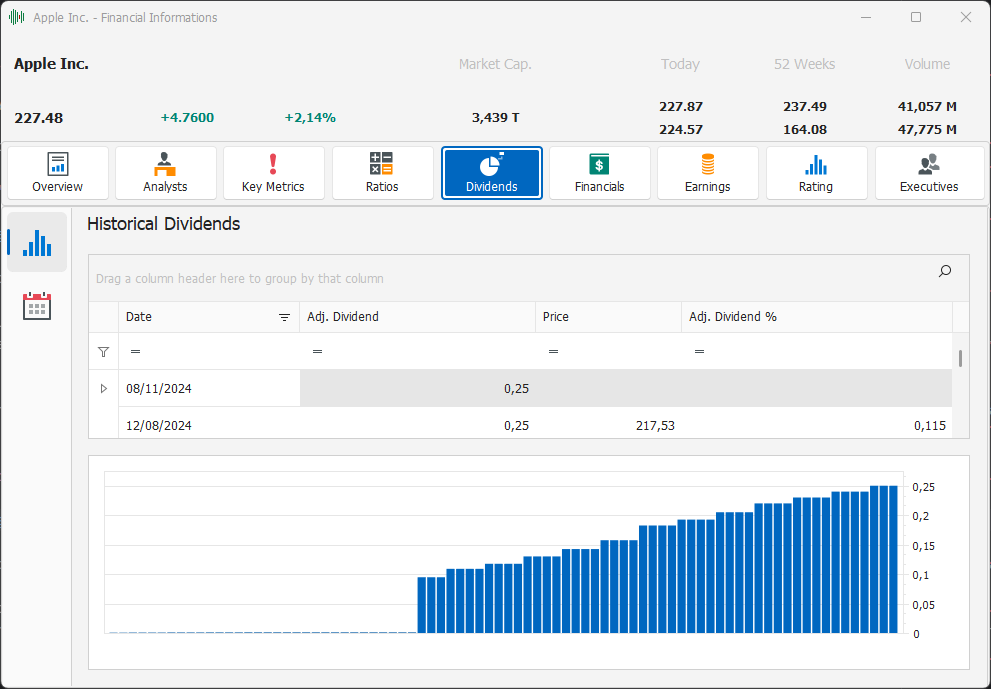
This view contains information on the dividends released by the asset over time. The data is displayed using a grid and a graph. The available information includes:
Date - Ex-dividend date;
Adj. Dividend - Dividend adjusted for subsequent splits/merges;
Price - Price of the asset at the time of the ex-dividend;
Adj. Dividend % - Dividend adjusted for subsequent splits/merges, expressed as a percentage of the asset's price at the time of the ex-dividend.
Dividends Calendar
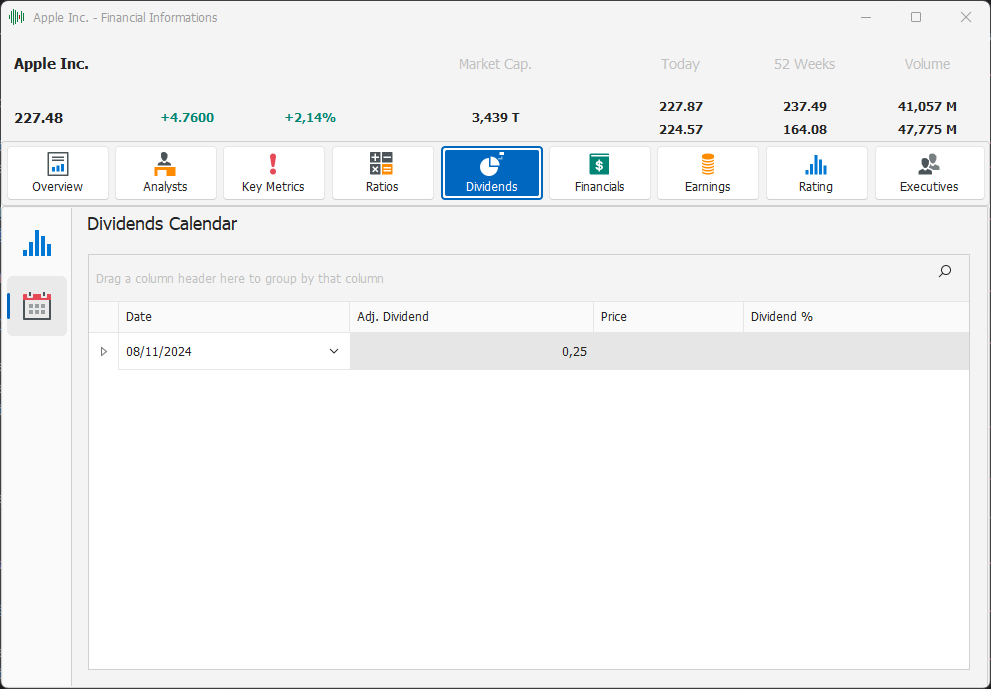
This view allows you to view the calendar of upcoming dividends expected for the selected asset. The available information includes:
Date - Ex-dividend date;
Adj. Dividend - Dividend adjusted for subsequent splits/merges;
Price - Price of the asset at the time of the ex-dividend;
Adj. Dividend % - Dividend adjusted for subsequent splits/merges, expressed as a percentage of the asset's price at the time of the ex-dividend.
Financials
This tab displays all the public financial data for the selected asset. The tab is divided into three sub-sections:
Income Statement
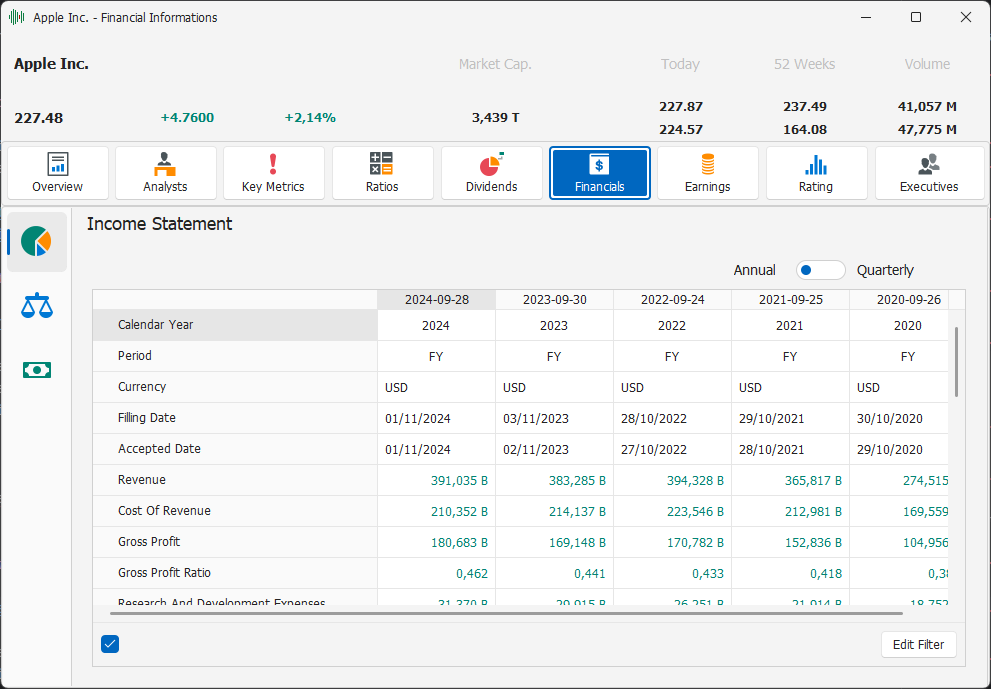
This view displays data related to the public Income Statements for the selected asset. You can display annual or quarterly data. The data for each analysis period is displayed in columns, sorted from most recent to least recent.
Balance Sheet
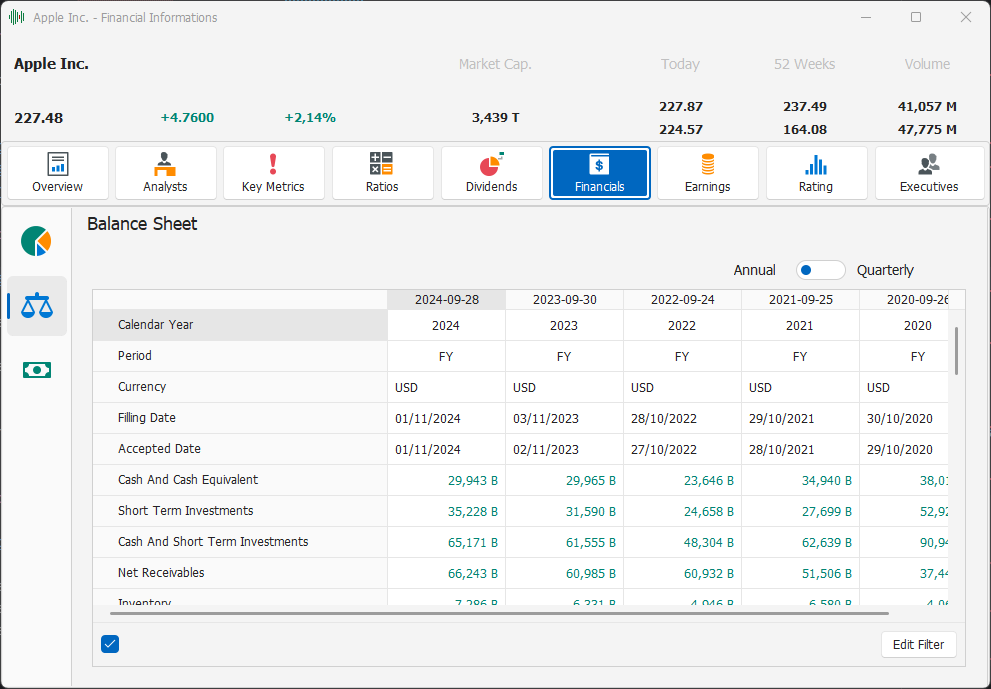
This view displays data relating to the public Balance Sheets for the selected asset. Either annual or quarterly data can be displayed. The data for each analysis period is displayed in columns, ordered from most recent to least recent.
Cash Flow
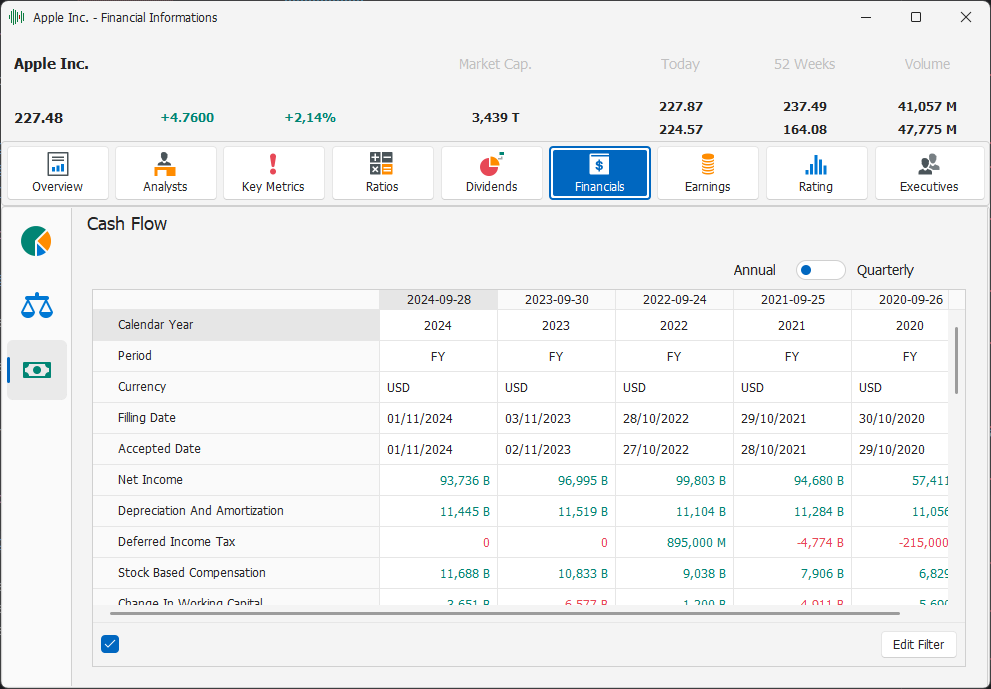
This view displays data from public Balance Sheets for the selected asset. You can display annual or quarterly data. The data for each analysis period is displayed in columns, sorted from most recent to least recent.
Earnings
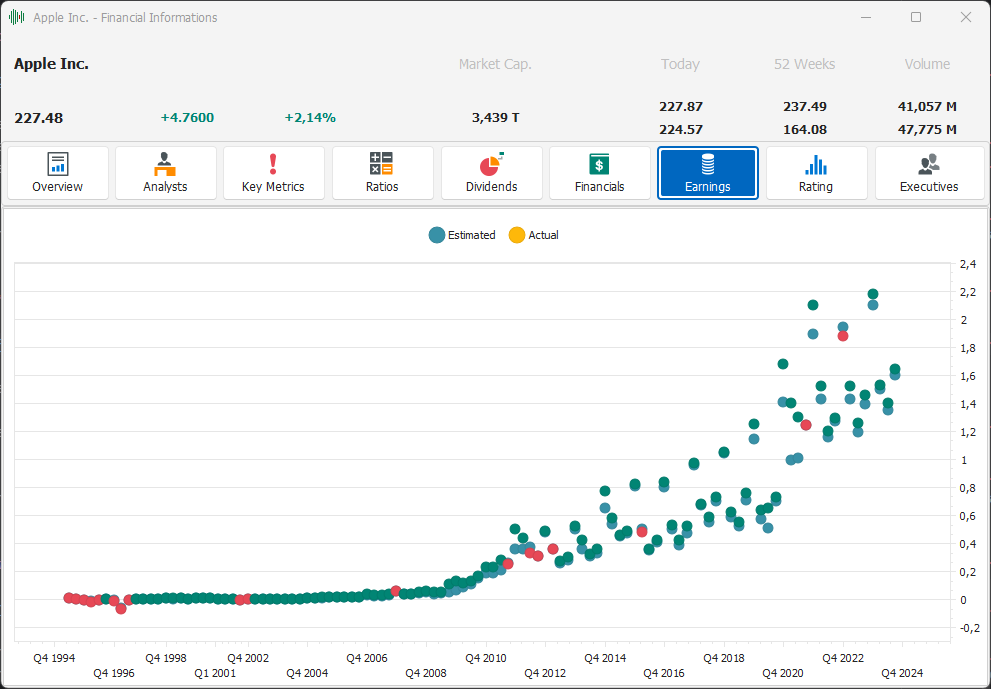
The Earnings tab displays the Earnings data, in the form of a graph that shows its trend over time. For each period there are up to two points on the graph, one relating to the value of the expected Earnings, and one relating to the actual Earnings. This last point is colored green if the actual Earnings have exceeded those expected, in red if the actual Earnings have been lower than those expected.
Rating
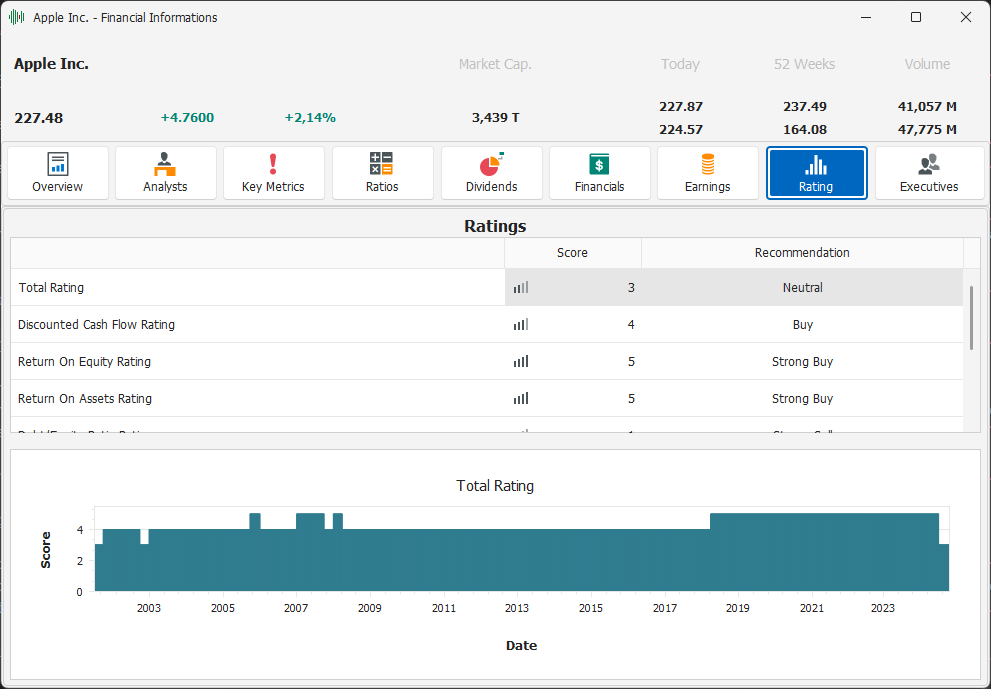
This tab shows the Rating values of the selected asset. The card has a grid at the top where the current values of all available Ratings are listed, while the upper part highlights the trend over time of the Rating selected in the top grid. The Rating values range from a minimum of 1 to a maximum of 5.
Executives
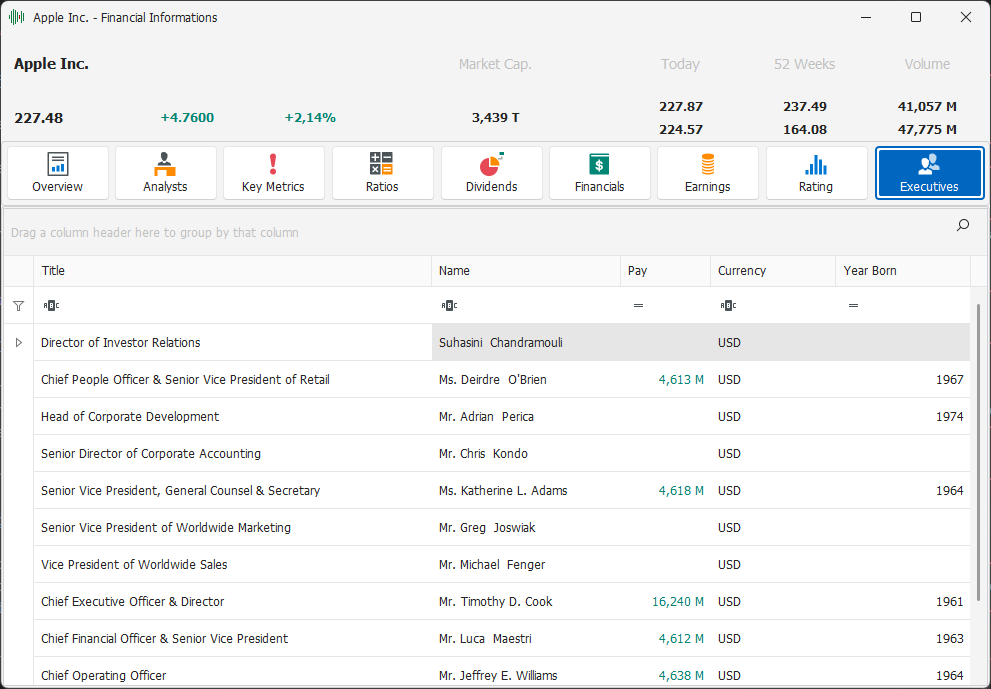
This tab displays data about the company's top executives. The information available is:
Title - Title of the executive within the company;
Name - Name of the executive;
Pay - Annual salary;
Currency - Currency of salary;
Year Born - Year of birth of the executive.