Compare Symbols

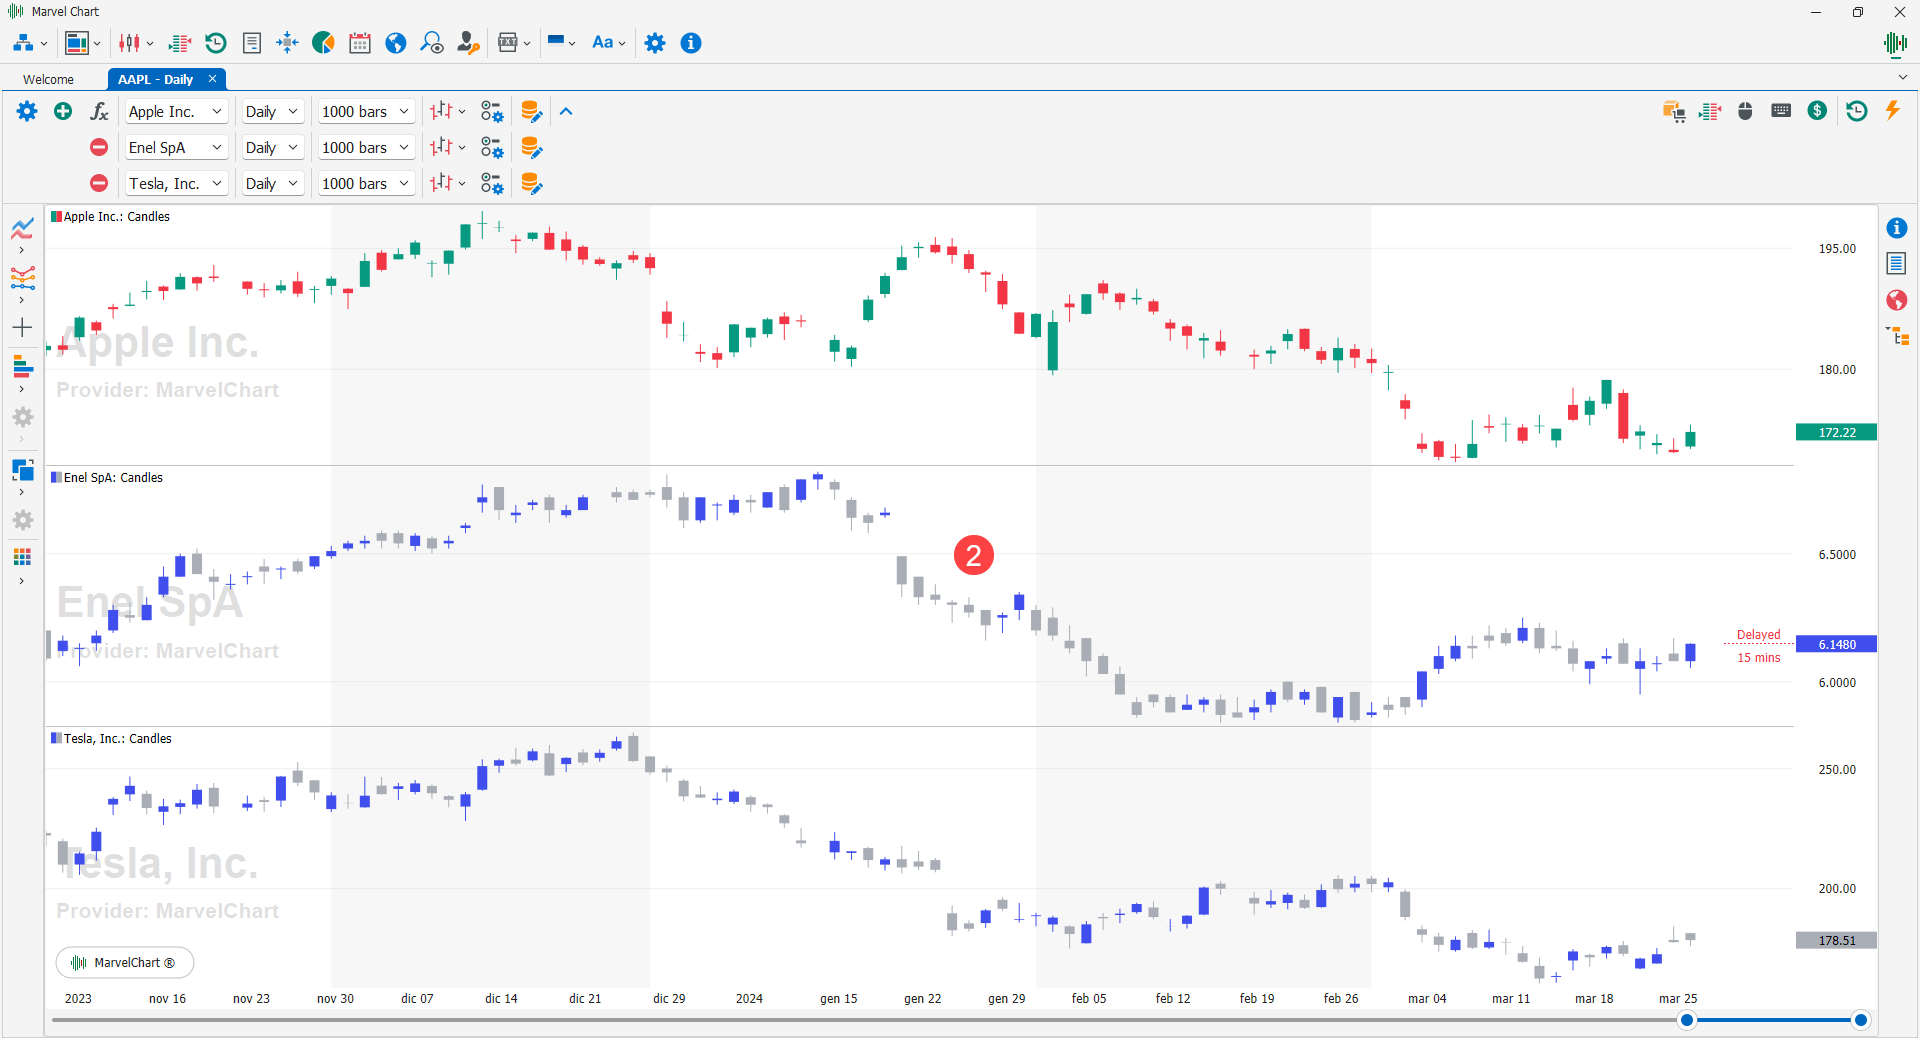
MarvelChart integrates the historical series comparison function 1, which can be used to check and compare the price trend over time of two or more series, related to different assets 2, or to different Time Frames.
Comparison of different assets
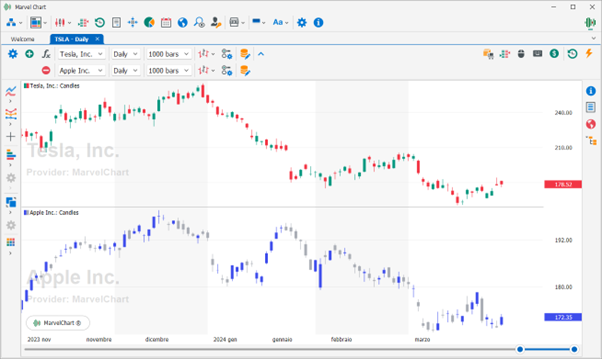
This is the most common use case of this feature. In MarvelChart, the historical series are drawn in separate panels on the Chart, but synchronized on the X-axis of time. When adding new historical series to the Chart, the settings related to Time Frame, number of bars, drawing style and related settings are all retrieved from the main series. In any case, it is possible to modify them via the selection command bar, visible in the upper left part of the Chart document.
Comparison of different Time Frames
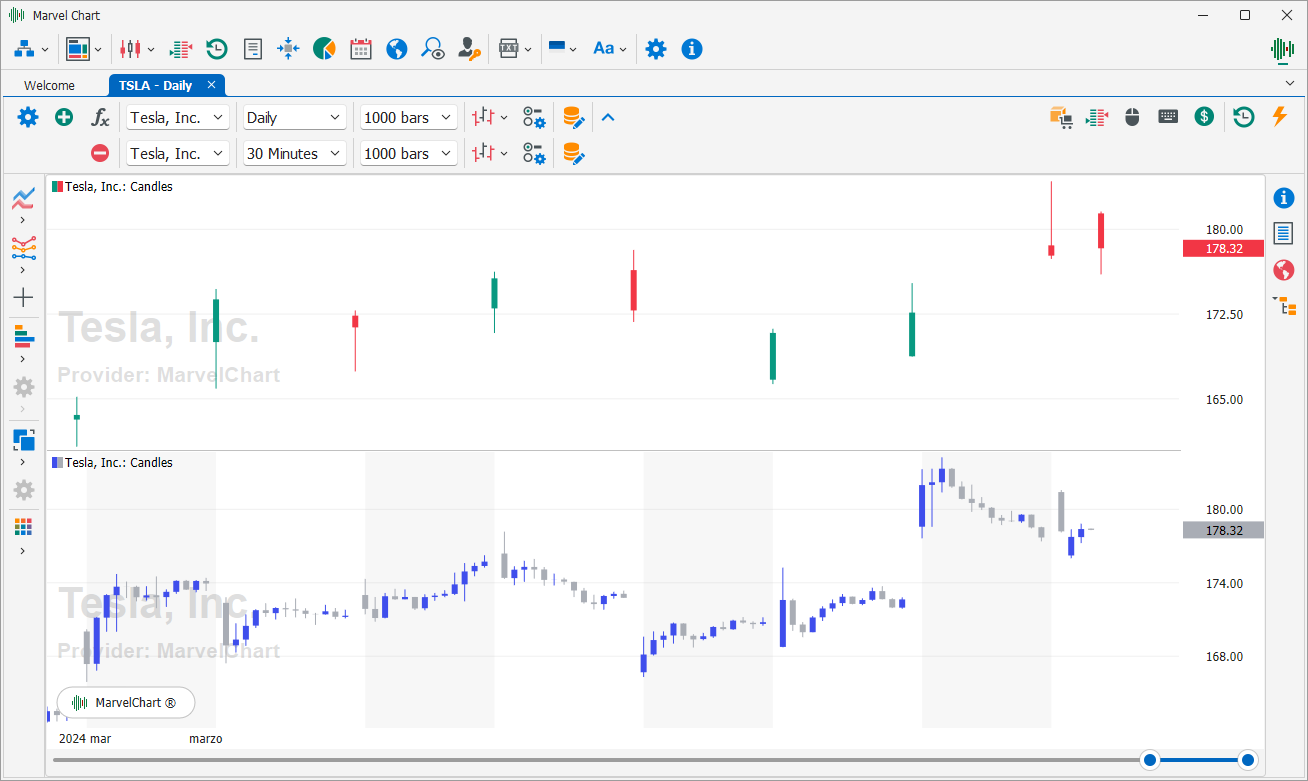
This comparison method, which makes sense if done on the same asset, is used to check how the historical bars with a higher Time Frame were formed, using the data with a lower Time Frame. For a better understanding, it may be easier to move the different historical series on a single panel.
Using the Chart Panels
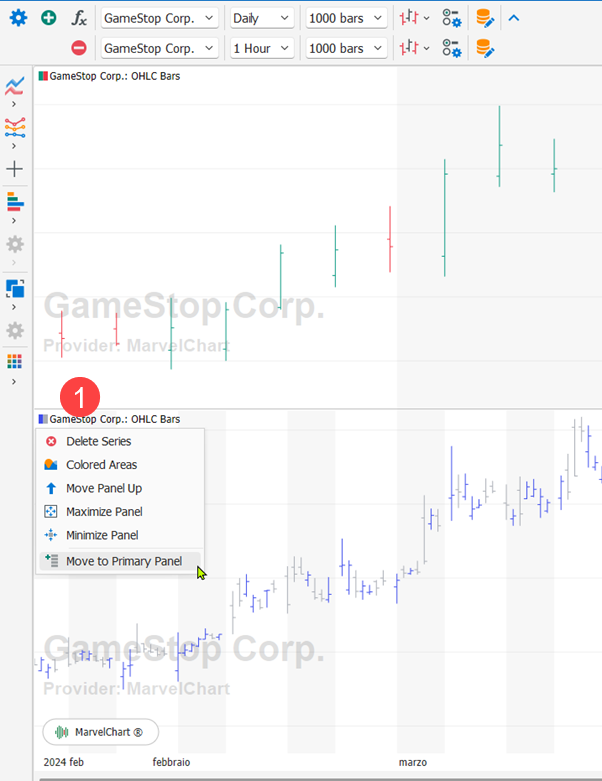
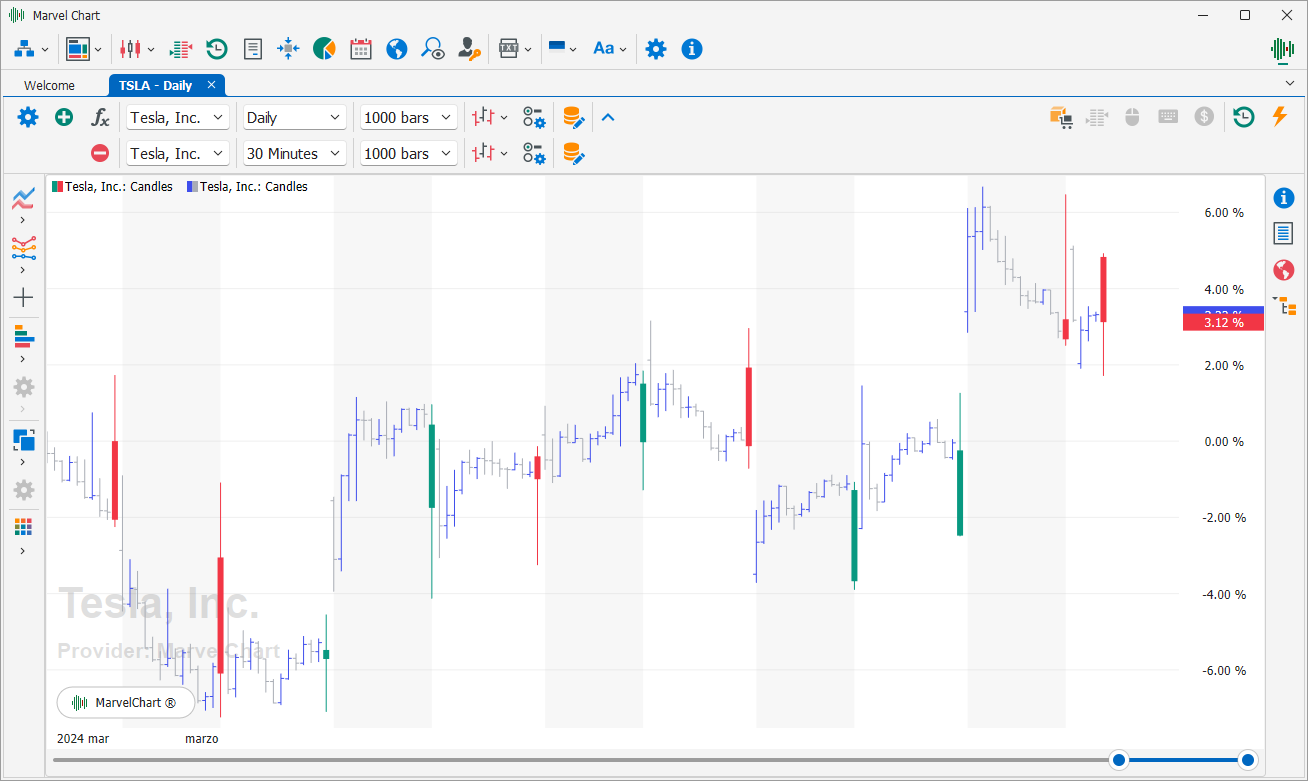
By left-clicking on the header of the secondary time series on the Chart 1, a menu will appear with a “Move to Primary Panel” item. By clicking this menu item, the time series will be moved to the main panel of the Chart, and therefore drawn in overlap with the main time series. The Y-axis of the main panel will automatically be set to Percentage mode, so as to make the comparison between the different time series always easily understandable, even if the prices are very different from each other.
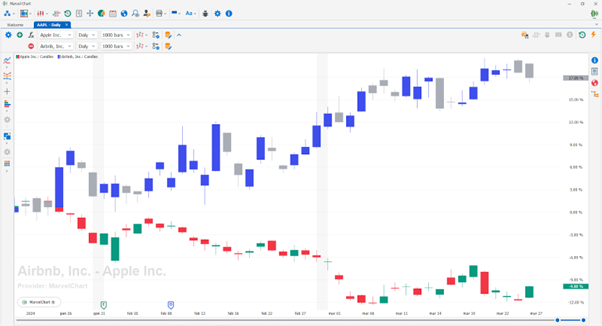
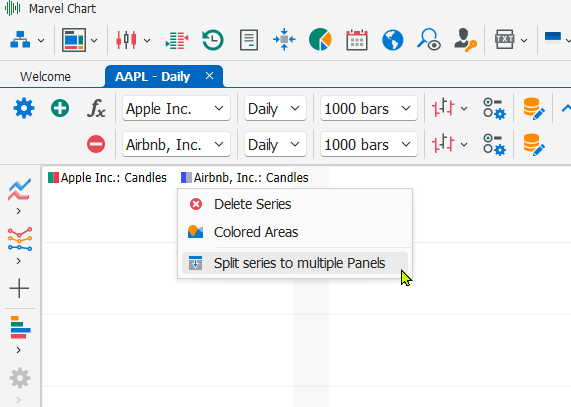
When multiple time series are plotted on the same panel, clicking on the header will bring up a menu with the item “Split series to multiple panels”. Clicking on this menu item will move the time series to a separate panel of the Chart and the Y-axes will be restored to display the actual prices of the series.
Requirements for the compare function
The compare function is available only when the Chart drawing style is set to one of the following modes:
These styles can be compared with other styles of a similar type because the X-axis depends exclusively on the date and time of the historical data and not on the price trend over time, while for example for the Point & Figure style the X-axis also depends on the price trend over time.
Limitations
When multiple time series are plotted on the same Chart panel, using the Move to Primary Panel function described above, the manual order entry features will be disabled. It will not be possible to use any of the modes described in the Chart Trading chapter to send market orders.