Indicators

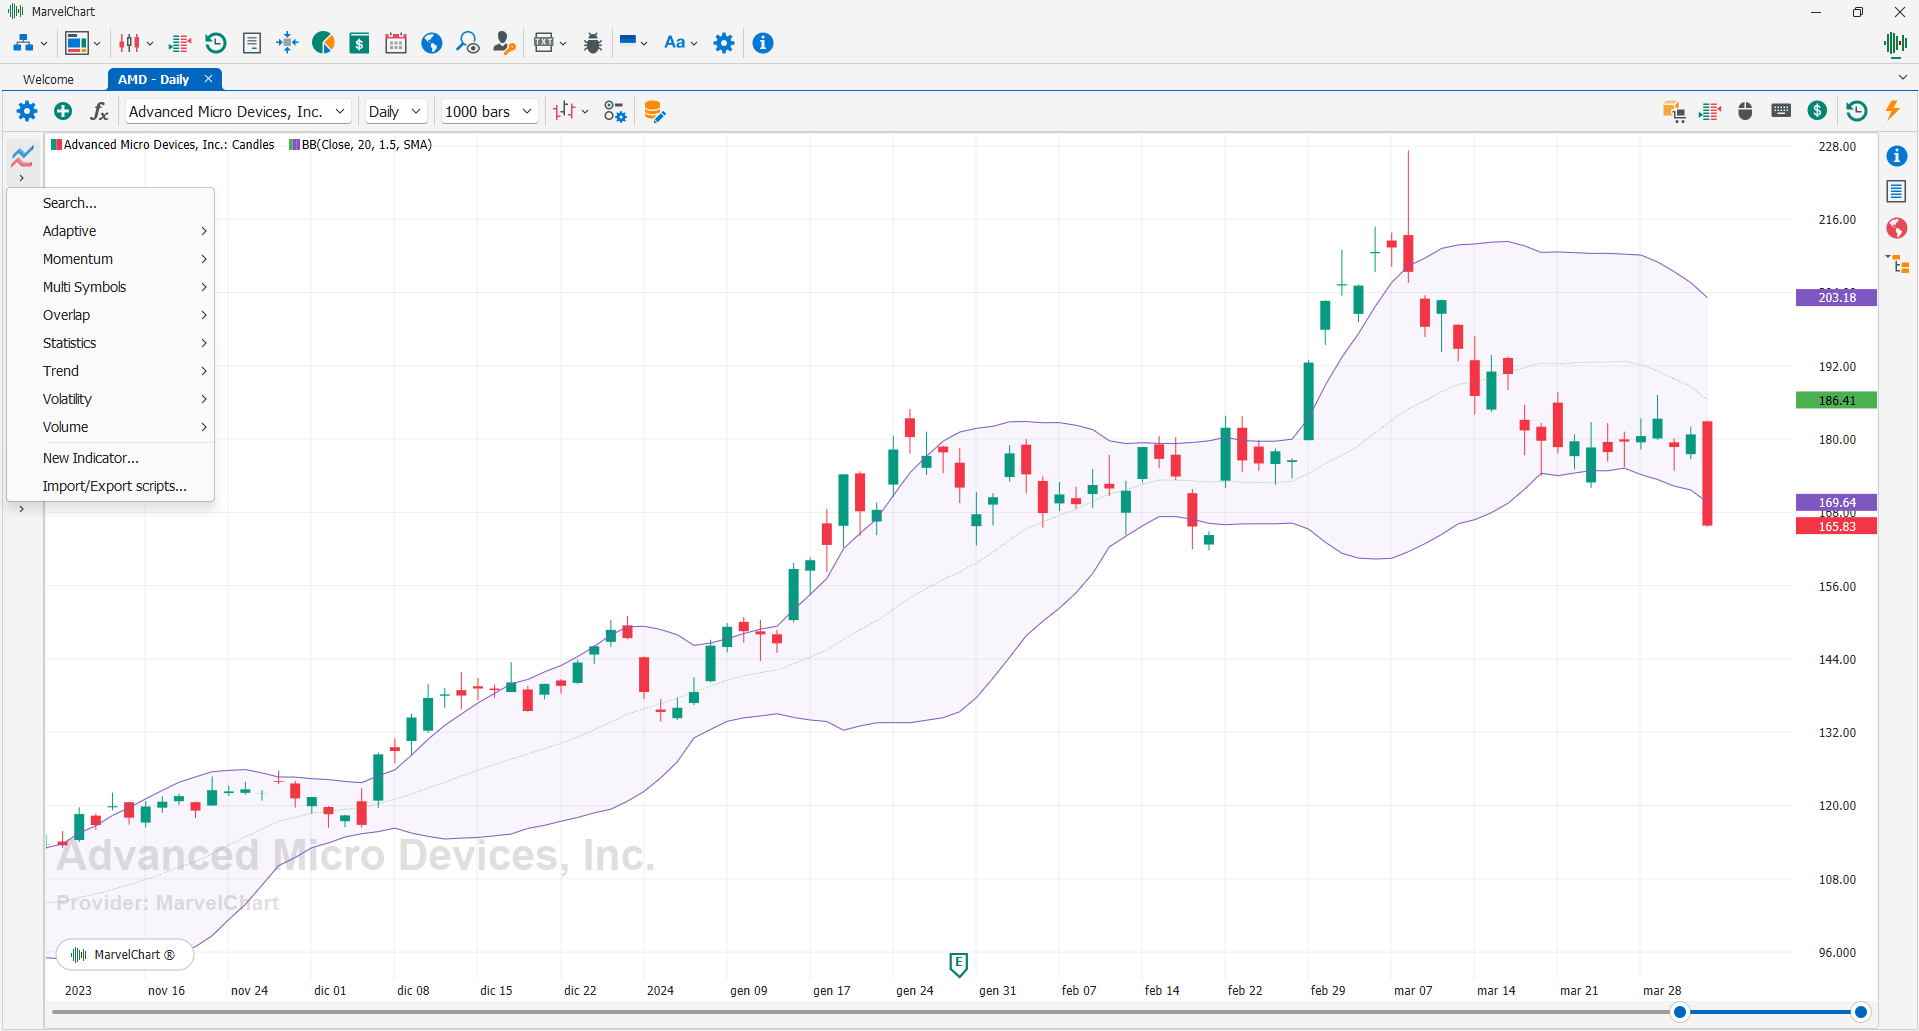
To add indicators to the Chart, you need to use the corresponding button in the toolbar of the Chart, by clicking which a menu appears with a list of available indicators and other additional items:
Search... - Shows the search window for indicators available in MarvelChart;
New Indicator... - Starts the wizard to create a new MarvelChart indicator in your C# script library. For more information, see the chapter Extending MarvelChart;
Import/Export scripts... - Starts the wizard to import/export indicators and trading systems. For more information, see the chapter Extending MarvelChart;
MarvelChart comes with an extensive set of predefined indicators, grouped by type for convenience. The predefined indicator types include:
Adaptive - Self-adaptive indicators;
Arithmetics - Arithmetic operations;
Math - Mathematical functions;
Math ➤ Geometry - Sub-category of Math, including a set of geometry and trigonometrical functions;
Momentum ➤ Indexes - Momentum indicators, indexes;
Momentum ➤ Oscillators - Momentum indicators, oscillators;
Multi Symbols - Indicators that use data from multiple time series at the same time;
Overlap ➤ Bands and Channels - Overlap indicators drawn as bands and channels;
Overlap ➤ Moving Averages - Overlap indicators, including a set of different types of moving averages;
Overlap ➤ Prices - Overlap indicators, calculating variations of the OHLC prices;
Overlap ➤ Studies - Overlap indicators, including a set of different studies;
Statistics - Indicators based on statistical analysis of historical data;
Trend - Trend indicators;
Volatility - Volatility indicators;
Volume - Indicators that use historical Volume data;
Volume Analysis - Indicators for volume analysis;
Volume Analysis ➤ Overlap - Indicators for volume analysis drawn on the chart's price panel;
Volume Analysis ➤ Studies - Volume analysis indicators represented as price analysis studies;
Volume Analysis ➤ Trend - Volume Analysis Indicators for Trend detection.
After adding an indicator to the Chart, a header will appear in the panel where the indicator is drawn, with a preview of the colors, name and value of the parameters of the indicator itself.
Indicator Commands
Left-clicking on the header will display a menu containing the following items:
Settings - Shows a window with the settings of the input and drawing parameters of the indicator;
Hide/Show - Hides or shows the indicator on the Chart. When an indicator is hidden its output lines are not drawn, but its header remains visible at the top of the chart panel where the indicator is present;
Delete Indicator - Deletes the indicator from the Chart
Show Source Code - Opens the source code of the indicator in the development environment. This feature may require additional software to be installed on your PC: make sure you have enough free space on your drive and the permissions required to install new software in Windows;
About this Indicator… - Displays a window containing a description of the indicator;
Colored Areas - Opens the window for setting the color areas for the Chart panel where the indicator is drawn;
Move Panel Up [Optional] - Moves the indicator panel up one position;
Move Panel Down [Optional] - Moves the indicator panel down one position;
Maximize Panel [Optional] - Maximizes the indicator panel, minimizing all other panels;
Minimize Panel [Optional] - Minimizes the indicator panel, giving more space to the other Chart panels;
Restore Panel [Optional] - Restores the indicator panel to its previous size, deactivating both maximized and minimized modes;
Move to Panel... - Allows you to move the indicator within another chart panel.
Move Indicators

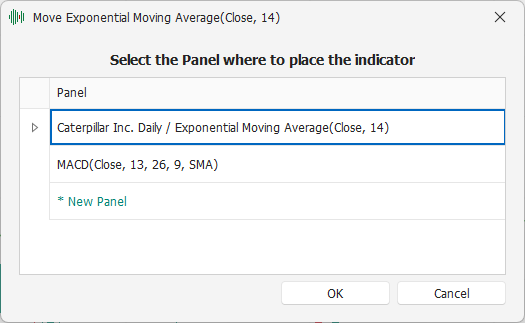
By choosing the "Move to Panel..." item from the indicator command menu, a window will appear on the screen that allows you to choose which panel to move the selected indicator to.
In the window, select the line that identifies the panel to which you want to move the indicator, or select the "* New Panel" item to create a new dedicated panel. Confirm your choice by clicking the OK button.
Indicator Search

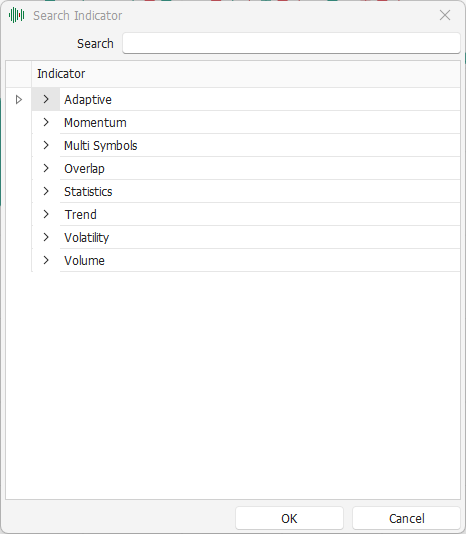
The indicator search function allows you to quickly find an indicator by its name, starting by typing it in the 1 Search text box. In the 2 list of indicators, only the indicators whose name contains the text entered in the Search box will be shown. To add an indicator to the Chart, simply double-click on the relevant item in the list, or select it and then click on the 3 OK button.
Indicator Settings

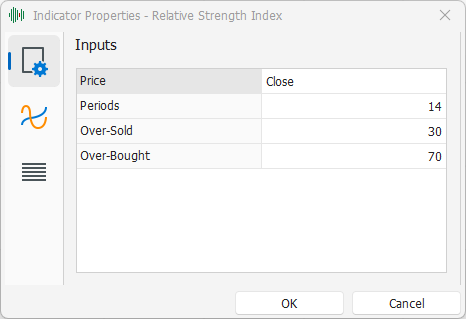
The indicator settings window is divided into two or three sections, based on the characteristics of the indicator. The sections are:
Inputs - Indicator input parameters. Shows a list of the parameters that can be modified for the indicator and the relative value, editable directly from the list. The items in this list and their meaning vary based on the type of indicator;
Outputs - Indicator output or drawing parameters. It is composed of a drop-down box where you can select the output (Plot) of the indicator to be modified, and a list with the drawing parameters of the selected output:
Color - Color to draw with;
Line Weight - Thickness of the drawing;
Plot Style - Type of drawing. The available options are:
Solid - Continuous line;
Dash - Dashed line;
Dot - Dotted line;
DashDot - Dashed and dotted line;
DashDotDot - Dashed and dotted line, composed of a dash and two dots;
Point - Point;
Histogram - Vertical histogram drawn starting from the zero value of the Y-axis of the chart panel;
PointToPoint - Line that connects two non-zero points, but which can also be non-consecutive;
Strip Lines - Constant value lines drawn by the indicator. It is composed of a drop-down box where you can select the Strip Line of the indicator to be modified, and a list with the drawing parameters of the selected Strip Line:
Color - Color to draw with;
Line Wieght - Thickness of the drawing;
Line Style - Type of drawing. The available options are:
Solid - Continuous line;
Dash - Dashed line;
Dot - Dotted line;
DashDot - Dotted and dashed line;
DashDotDot - Dotted and dashed line, composed of a dash and two dots;
Point - Point;
Histogram - Vertical histogram drawn starting from the zero value of the Y-axis of the chart panel.