Candlestick Patterns

Japanese candlesticks or candlesticks are one of the possible ways to graphically represent the price trend of a financial instrument. The candlestick chart is in fact one of the most used among the charts in trading. The advantage compared to other methods is that a single symbol (called a candle) is able to summarize five different data, without forgetting, however, that the candle represents a specific time interval. Relative to the set time frame, the five values of the candle are: initial or opening price, maximum price, minimum price, closing price and whether the closing was higher or lower than the opening price. Each candle is made up of a "body", called body, which represents the opening and closing prices, and whose color indicates whether the prices were rising or falling between the opening and closing times, and two "shadows", called shadows, which exit the body upwards or downwards and which represent the maximum and minimum levels reached in the time frame considered. Body and shadows must be carefully considered in the evaluation of patterns. The set of body and shadows is called a line. Two types of line can be identified, one defined as "short" when price volatility is low, and one defined as "long" when price volatility is high. One or more Japanese candlesticks can compose a pattern (i.e. a model). The different sequence of the characteristics of the candles identify the type of pattern they represent. Candlestick Patterns are based on current and previous prices and can be useful in identifying future trends.
Pattern Settings

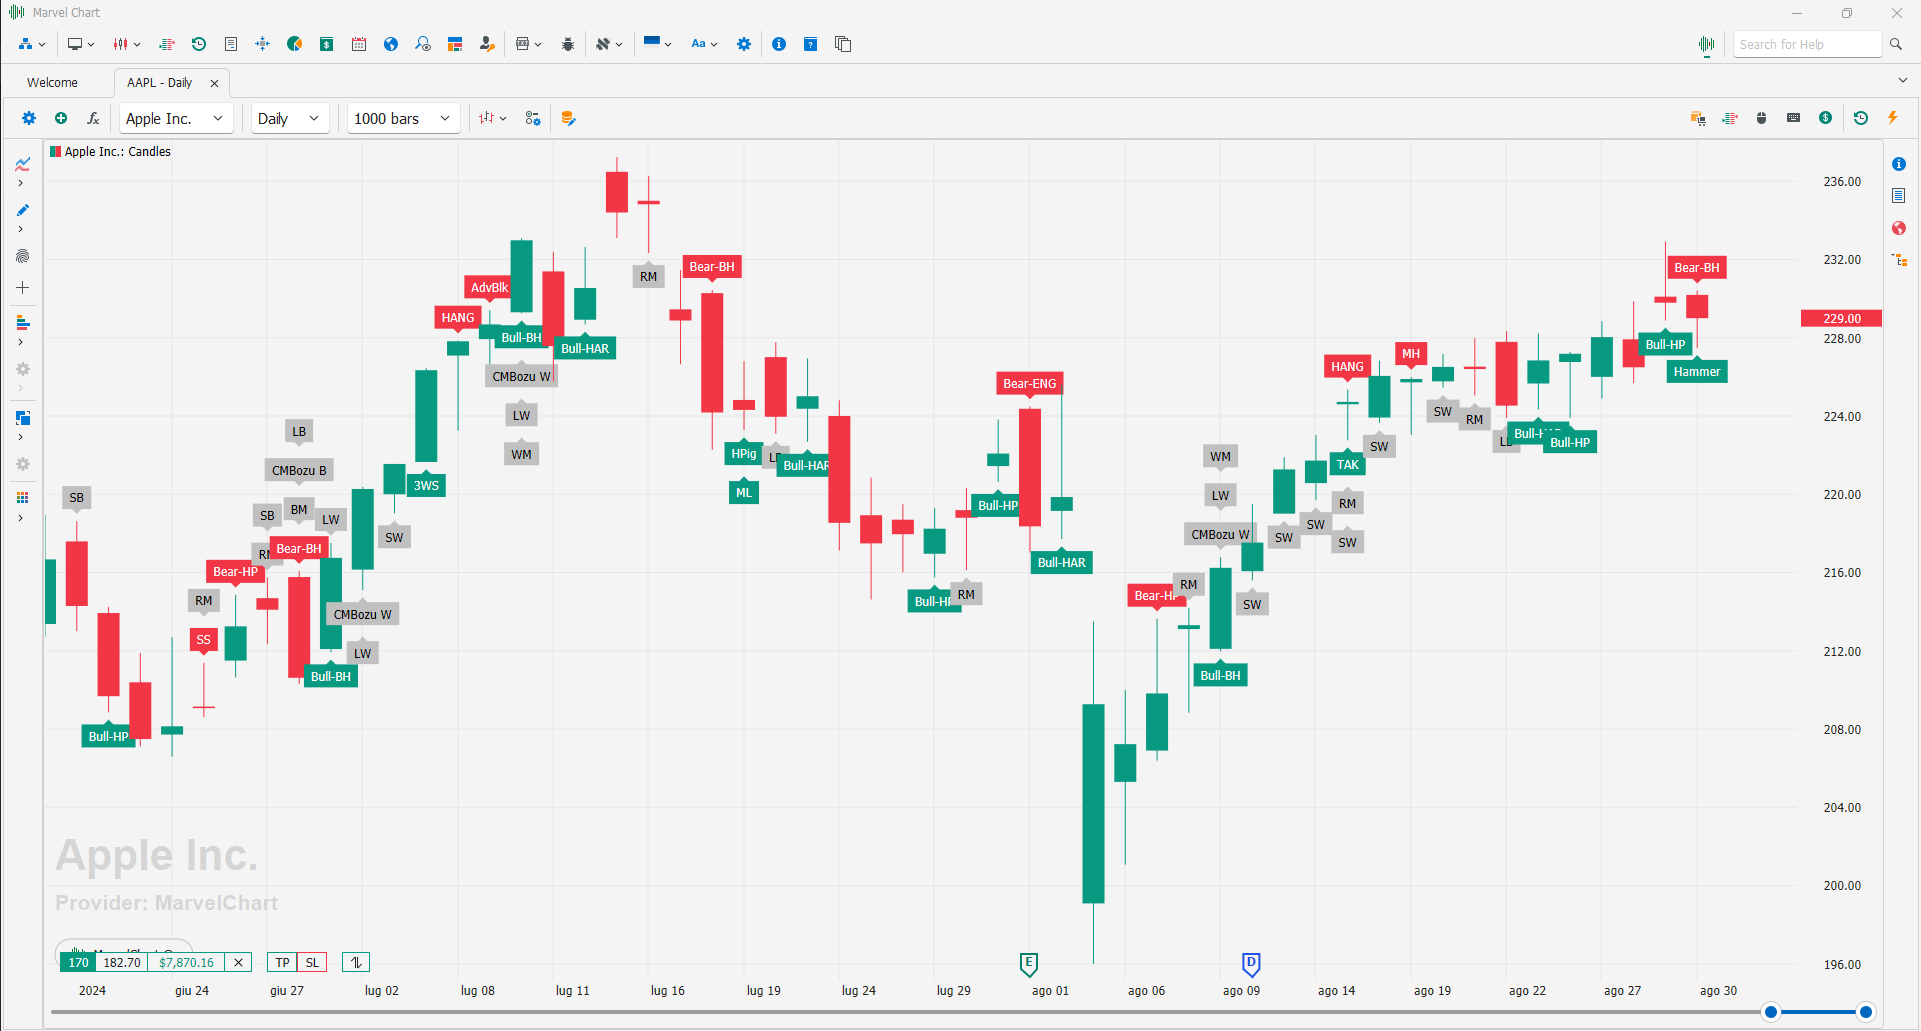
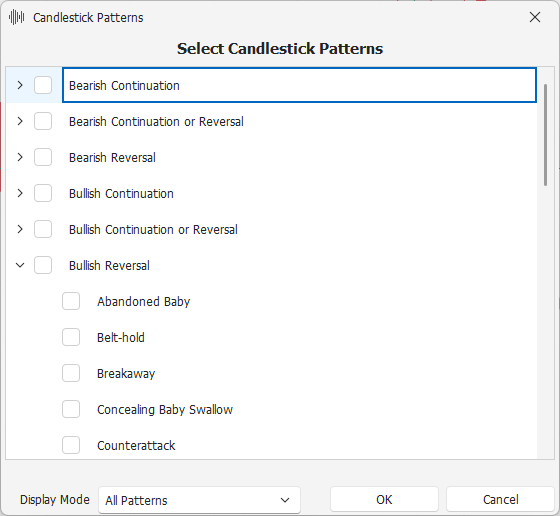
In MarvelChart for each chart it is possible to set the automatic search for different types of Candlestick Patterns at the same time. Candlestick Patterns are divided into different categories, depending on the type of forecast provided. The setting of the Patterns to search for is done simply by activating the checkbox to the left of the Pattern name in the settings window. It is possible to select or deselect an entire category of Patterns with a single click on the box to the left of the category name.
Since it is possible to select multiple Patterns at the same time, and given that multiple Patterns can be identified on a single candle in the chart, in MarvelChart it is possible to select in which mode to show the results of the Pattern search. The available modes are:
All Patterns - shows on each candle all the Patterns that have been identified;
By Pattern Length - shows on each candle the Patterns that have been identified starting from the longest length, in bars, excluding from the drawing all Patterns of shorter length.
Pattern Categories
The categories of Patterns available depend on the type of forecast that each Pattern identifies. The available categories, in alphabetical order, are:
Bearish Continuation - Continuation of the bearish trend;
Bearish Continuation or Reversal - Continuation or reversal of the bearish trend;
Bearish Reversal - Reversal of the trend, from bullish to bearish;
Bullish Continuation - Continuation of the bullish trend;
Bullish Continuation or Reversal - Continuation or reversal of the bullish trend;
Bullish Reversal - Reversal of the trend, from bearish to bullish;
Reversal or Continuation of Trend - Reversal or continuation of the current trend, whether bullish or bearish;
Simple Patterns - Patterns that do not provide any predictions on the trend direction, but are generally used in more complex Patterns.