DOM - Depth of Market - Orders book
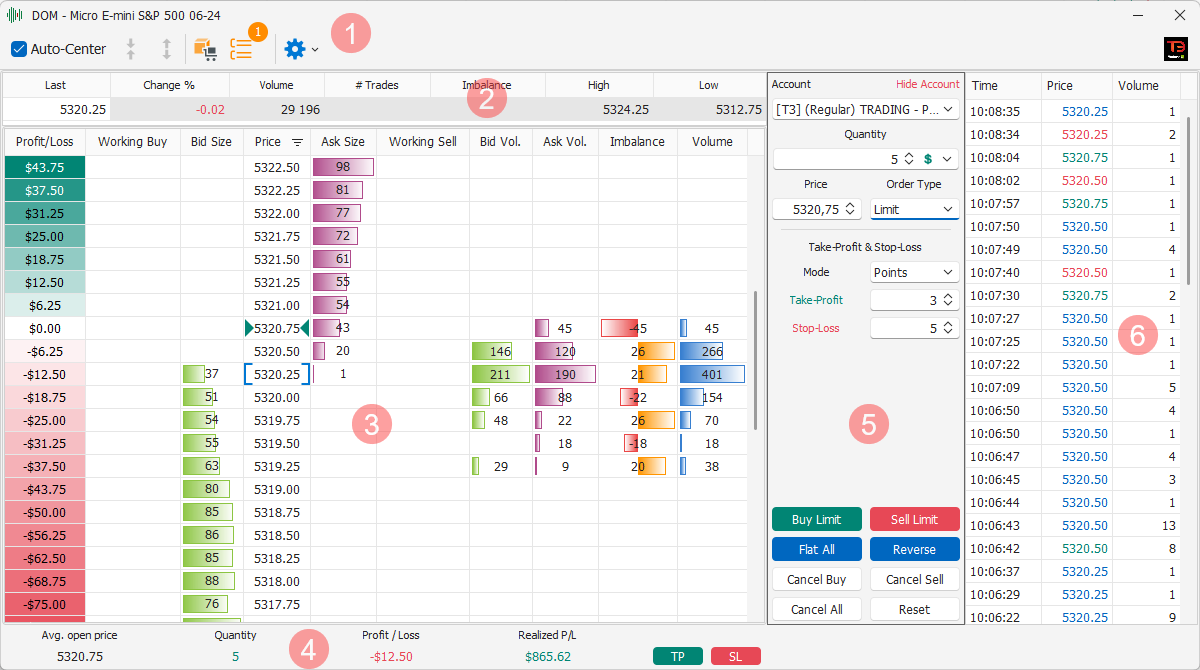
MarvelChart's DOM / Trading Book is one of the most important functions in the entire application, as it allows the insertion, modification and cancellation of market orders. The DOM window is composed of several sections, in order from top to bottom and from left to right:
Command Bar

At the top of the DOM window there is a bar with the commands:
Auto-Center - It is a checkbox, when it is active the Last price of the symbol is always reported in the center of the DOM levels table. If the box is not checked, the levels table is free scrolling, and the Last price may not be visible;
Center on Last - Centers the DOM levels table on the Last price of the symbol every time you click. This button is active only when the Auto-Center checkbox is off;
Center on Avg. Price - Centers the DOM levels table on the average price of the Open Position of the symbol every time you click. This button is active only when the Auto-Center checkbox is off and there is an Open Position on the currently selected symbol;
Symbol Mapping for Orders/Change Symbol - If the DOM was opened from a Chart, this button allows you to set the Symbol Mapping for Orders. If the DOM was opened as a stand-alone window, this button allows you to change the DOM working symbol;
Ticks Grouping allows you to view the DOM price steps by grouping them by number of ticks. In this way the Last only moves when the set number of ticks is reached and it is therefore easier to place and move the buy/sell orders, Stop Loss and Take Profit. The number of ticks set is in the circle above the button that enables the editable field;
Settings - Configuration menu;
Broker - Icon that highlights the broker to which the symbol used in the DOM belongs.
Ticks Grouping
The Ticks Grouping feature allows you to limit and filter the number of levels displayed in the DOM Levels Table. It can be particularly useful in Fast Market moments, of extreme volatility, or on symbols for which the difference between one tick and the next is very small, such as Futures contracts.

Activating the Ticks Grouping feature presents the settings window, which consists of two values to set and the preview of the result that will be obtained by confirming the entered values.
Center Price - Central price from which to calculate the grouping;
Num. Ticks Grouping - Number of ticks to group.
By confirming the settings with the OK button, the prices visible in the DOM Levels Table will be filtered to show only the values calculated with the settings just made.
In the command bar the Ticks Grouping button will be highlighted as active, and the marker above it will indicate the number of ticks used in the grouping.
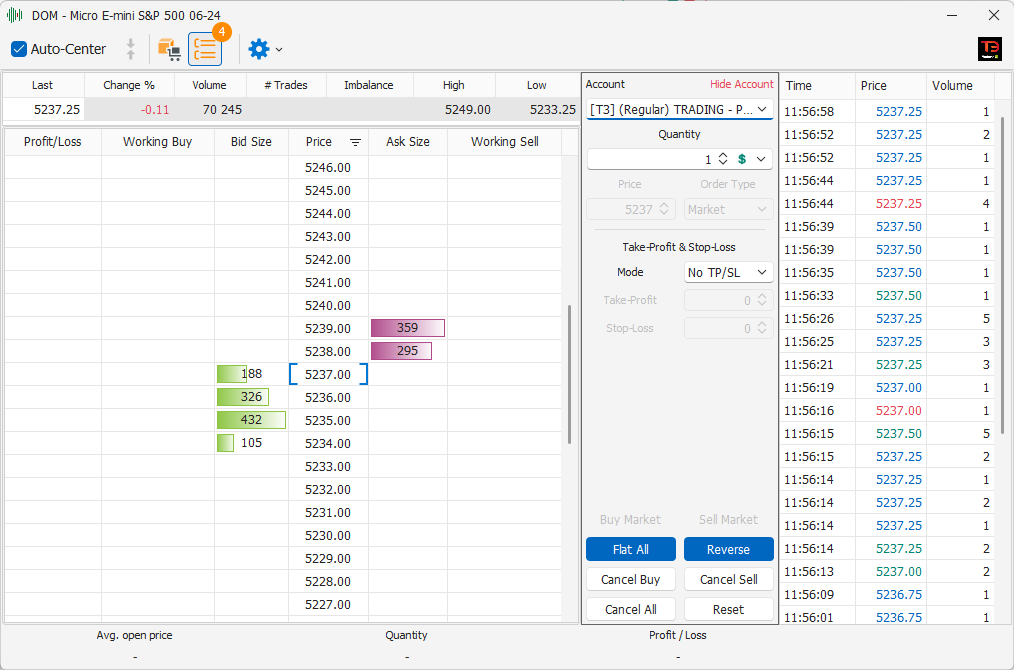
In the image you can see the result of the Ticks Grouping function applied on the Micro E-Mini S&P 500 symbol, with a 4 ticks grouping.
Symbol Change
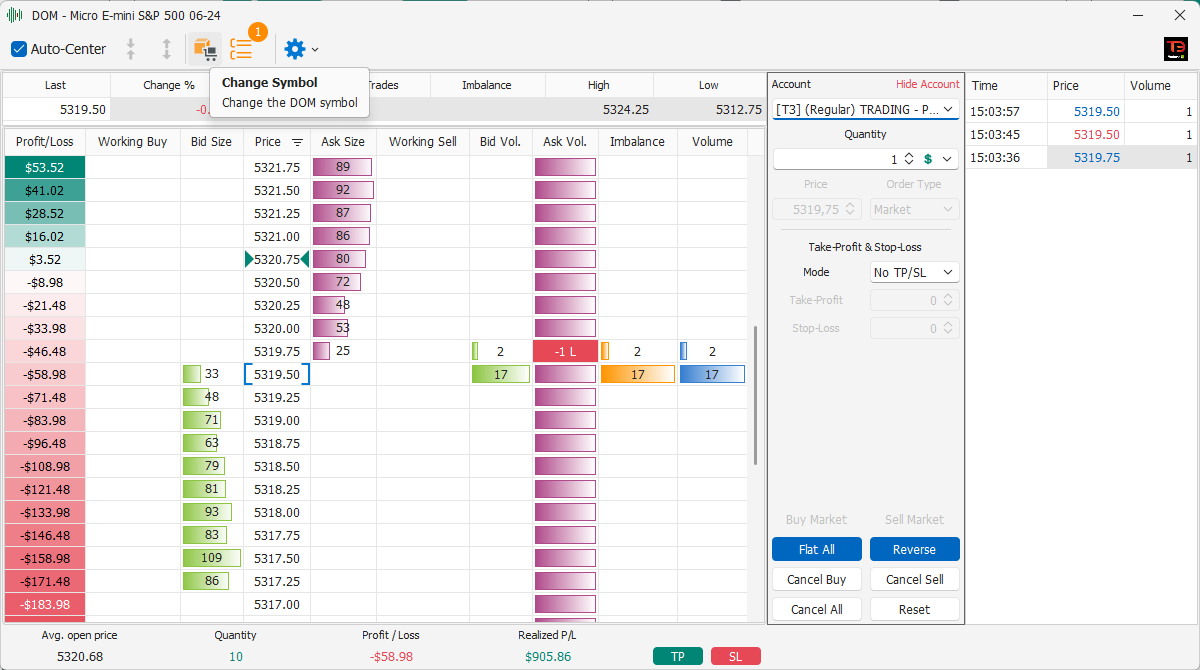
If you intend to use the DOM by gradually changing symbols 1 it is more convenient to start the function directly from the MarvelChart main command bar. In this way it is not necessary to open the Chart of the desired symbol and then access the DOM from the button present in the Chart itself.
Settings - Configuration Menu
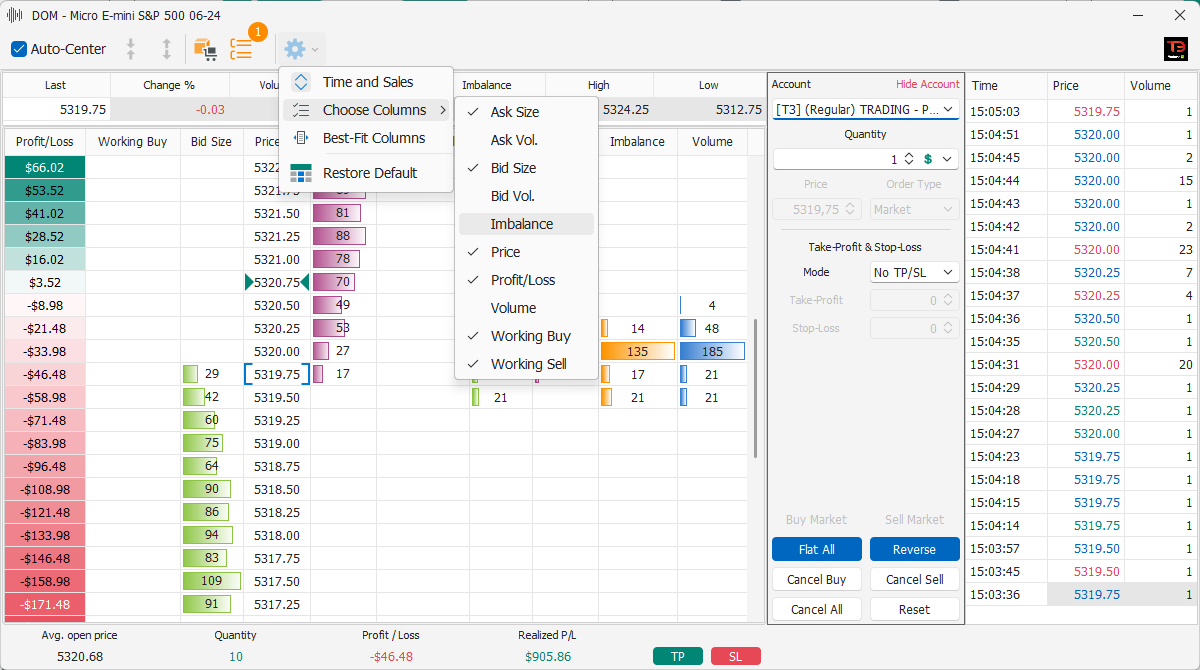
The Settings button on the Command Bar opens a menu through which you can customize the appearance and functionality of the DOM. The items in this menu are:
Time and Sales - Shows/Hides the Time and Sales panel;
Choose Columns - Shows the list of columns available in the DOM level table and allows you to show or hide each column;
Best-Fit Columns - Performs an adjustment of the width of the columns in the level table. This command can be very useful if you have changed the list of visible columns in the level table.
Restore Default - Restores the default layout of the DOM.
Columns can be moved by clicking on the column header and dragging it to the desired position.
Market data for symbol

This section displays the market data for the selected symbol. This data includes:
Last - Last Price, price of the last trade;
Change % - Percentage change in the Last price compared to the opening price of the trading session;
Volume - Number of contracts executed since the opening of the trading session;
N. Trades - Number of trades executed since the opening of the trading session;
Imbalance - Auction Imbalance, i.e. the imbalance requested offer in the opening auction (if supported by the Broker);
High - Maximum price reached since the opening of the trading session;
Low - Minimum price reached since the opening of the stock market session.
DOM Levels Table
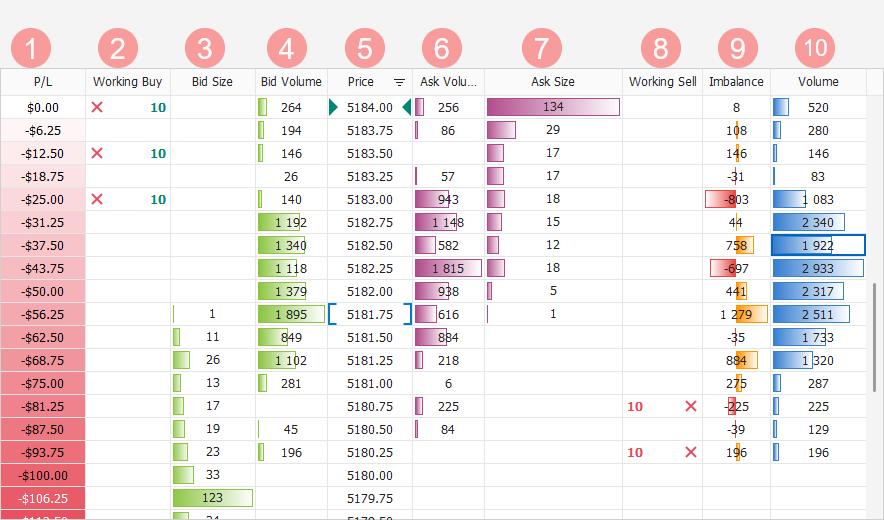
This section is the main part of the DOM window, where you will interact with MarvelChart most often. The DOM Levels Table can display the following columns. Some of them can be removed or moved to the desired position of the grid. See details in the settings section.
P/L - Potential Profit/Loss of the current Open Position at the corresponding price level; in the image if the position reaches 5111 it will be in profit of $50;
Working Buy - Total quantity of Buy orders and “X” sign for the cancellation of the corresponding order placed on that price line;
Bid Size - Number of contracts in Bid. The values are supported by green horizontal histograms, the higher the value the longer the histogram;
Bid Volume - Number of contracts executed at the Bid price. The values are supported by green horizontal histograms, the higher the value the longer the histogram;
Price - Price. The Last price is highlighted by two blue square brackets [ ]. An Open Position, Live Trading or Paper Trading, will be highlighted in the Price column by the cell colored green if Long or red if Short;
Ask Size - Number of contracts in Ask. The values are supported by purple horizontal histograms, the higher the value the longer the histogram;
Ask Volume - Number of contracts executed at the Ask price. The values are represented as purple horizontal histograms, the higher the value the longer the histogram;
Working Sell - Total quantity of Sell orders and “X” sign for the cancellation of the corresponding order placed on that price line;
Imbalance - Difference between Bid Volume and Ask Volume. The values are supported by bi-directional horizontal histograms, colored red or orange. The higher the number, in absolute value, the longer the histogram. Negative values are supported by horizontal histograms by red histograms that extend from the center to the left edge. Positive values are supported by orange histograms that extend from the center to the right edge.;
Volume - Total quantity executed. The numbers are supported by blue horizontal histograms, the higher the number, the longer the histogram.
In the Working Buy and Working Sell columns, all market orders that can be moved or deleted are shown. See order management.
Inserting new orders directly on the DOM levels table
To insert new orders, after having set their characteristics in the settings panel, simply click with the left mouse button on the cell of the Bid Size / Bid Volume or Ask Size / Ask Volume columns associated with the price at which you want to insert the new order. A green or red label will contain the number of contracts. The Limit / Stop order type is also visible, which is automatically selected by the Dom. A click on the Bid Size or Bid Volume cells inserts a new Buy order, while a click on the Ask Size or Ask Volume cell inserts a new Sell order. When the mouse cursor is over one of these cells, it is highlighted, showing a preview of the order instead of the Bid Size / Bid Volume or Ask Size / Ask Volume value. The Limit or Stop order type is automatically determined starting from the Last price and the price on which you clicked. After sending market orders, the total quantities pending at that specific price and an “X” to cancel the orders are displayed in the Working Buy and/or Working Sell cells corresponding to the order price.
Editing one or more orders
When there are orders waiting to be executed, they are displayed in the Working Buy and Working Sell cells at the corresponding price. It is possible to change the price of the orders by dragging the quantity from one price to another. If there are multiple buy/sell orders at the same price, the price change will occur one at a time starting from the first entered.
Deleting one or more orders
When there are orders waiting to be executed, they are displayed in the Buy and Sell cells at the corresponding price, with an "X" next to them to delete the orders. Simply click the left mouse button on the "X" to delete all orders waiting to be executed at that price.
Open Position

In this section, any Open Position on the selected symbol is highlighted, showing the values of:
Avg. Open Price - average opening price (load price) of the position;
Quantity - total quantity of the position, positive with green color for long positions (Long), negative with red color for short positions (Short);
Profit / Loss - Profit/Loss calculated using the Last price;
Realized P/L - Daily Profit/Loss realized on the currently selected symbol.
To the right of the values of the current Open Position there are two buttons:
TP - allows you to set and send to the market a Take-Profit order on the current Open Position;
SL - allows you to set and send to the market a Stop-Loss order on the current Open Position.
The TP and SL buttons will be active only when there is an Open Position on the current symbol.
Order settings and commands panel
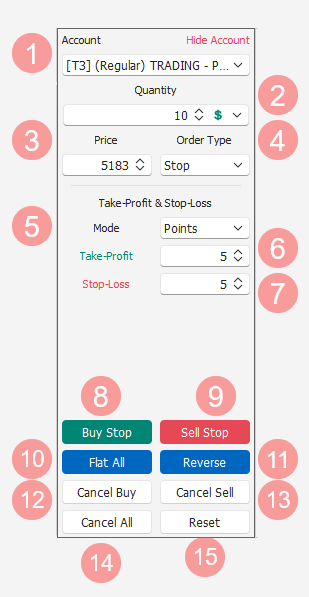
This section allows you to set the parameters for inserting a new market order. The settings that can be changed are:
Account - Drop-down box through which you can select which account to send the new order to (in Brokers that support multiple accounts or in those that, with a single account, allow the selection of "Overnight/Intraday"). For privacy reasons, it is possible to hide this setting by clicking on the Hide Account item. If the setting is hidden, simply click on the Show Account item to show it again;
Quantity - Quantity of the new order. See the chapter Orders quantity input fields for more information;
Price - Limit/Stop price of the order. This box contains the Limit or Stop price of the order, and is valid only if Limit or Stop is selected in the 4 Order Type drop-down box. The order can be entered by clicking on the 8 Buy and 9 Sell buttons. If the order is entered via the DOM levels table, this box is disabled because in automatic mode the DOM will set Stop or Limit depending on the position that the Trader chooses by scrolling the levels table with the mouse pointer;
Order Type - Drop-down box from which to choose the type of order to send to the market, Live Trading or Paper Trading. Changing the order type changes the name and behavior of the 8 Buy and 9 Sell buttons;
Mode - Drop-down box from which to choose the mode in which to calculate the distance of the Take-Profit and/or Stop-Loss orders from the order being placed. This type of orders are called Brackets. See the chapter Brackets Orders for more information;
Take-Profit - Distance of the Take-Profit bracket order from the price of the order being placed. If this value is set to zero, no Take-Profit order will be created;
Stop-Loss - Distance of the Stop-Loss bracket order from the price of the order being placed. If this value is set to zero, no Stop-Loss order will be created;
Inserting and managing orders from the Settings panel
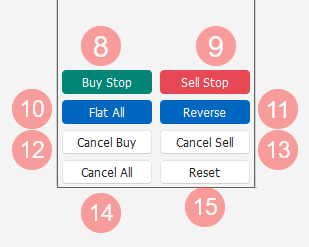
In addition to the parameters for setting new orders, this section also contains command buttons that allow you to insert or manage orders extremely quickly. The available commands are:
Buy - This button will display the text Buy Market, Buy Limit or Buy Stop, depending on the setting of the Order Type field higher up in this same section. Clicking this button will insert a new Buy order with the settings indicated above;
Sell - This button will display the text Sell Market, Sell Limit or Sell Stop, depending on the setting of the Order Type field higher up in this same section. Clicking this button will insert a new Buy order with the settings indicated above;
Flat All - Allows you to close any Open Position on the selected symbol. The order that will be entered will be a Sell order for Open Position with positive quantity, and a Buy order for Open Position with negative quantity. In both cases, the order will be of the Market type, and if supported by the broker it will be set to Sweep to Fill mode;
Reverse - Allows you to reverse a possible Open Position on the selected symbol. The order that will be entered will be a Sell order for Open Position with positive quantity, and a Buy order for Open Position with negative quantity. In both cases, the order will be of the Market type with a quantity double the current absolute value of the Open Position quantity;
Cancel Buy - Cancels all pending Buy orders on the selected symbol;
Cancel Sell - Cancels all pending Sell orders on the selected symbol;
Cancel All - Cancels all pending orders, both Buy and Sell, on the selected symbol;
Reset - Resets all settings and returns to the initial situation.
Time and Sales
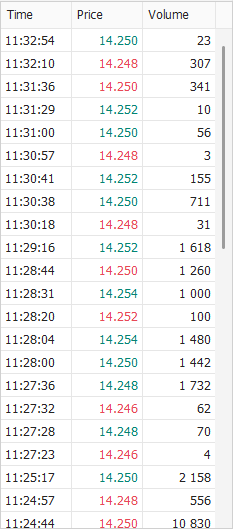
This section displays all the trades that are executed on the selected symbol. For each trade, the execution time is shown, expressed in the local time of the PC, the executed price and finally the executed quantity. The trades are ordered by decreasing execution time, therefore the new trades will be inserted at the top of the list. The executed price is highlighted in green if it is higher than the previous one, in red if it is lower.