Momentum Indexes
ADX
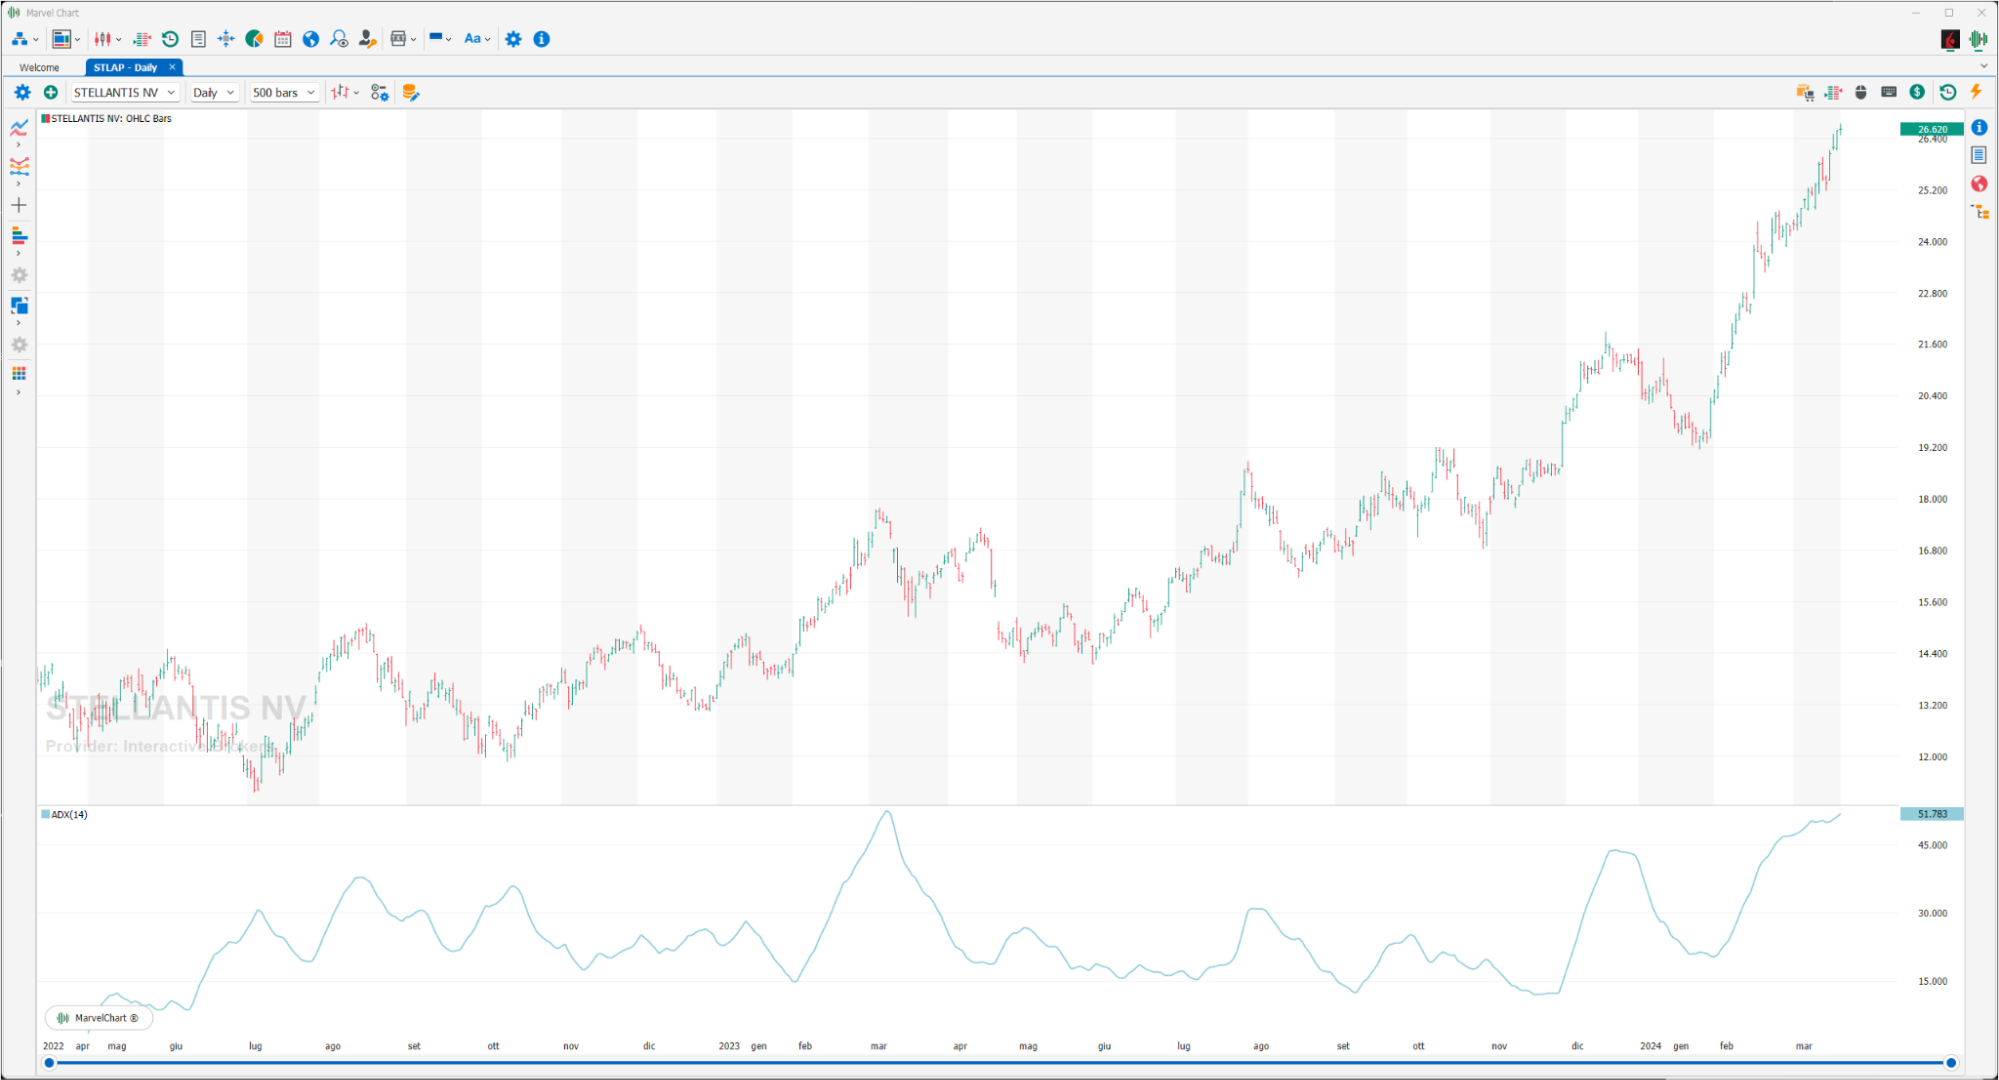
ADX is commonly used to quantify the strength of a trend. The acronym stands for Average Directional Index, which was developed in 1978 by Welles Wilder and is an indicator used in technical analysis. To interpret ADX, it is first necessary to understand that this indicator does not indicate the direction of the trend, but only its strength. The value of ADX is usually between 0 and 100. Above 40 the trend is considered strong, below 20 it is considered weak. Wilder used 14 periods.
Comparative Relative Strength Index
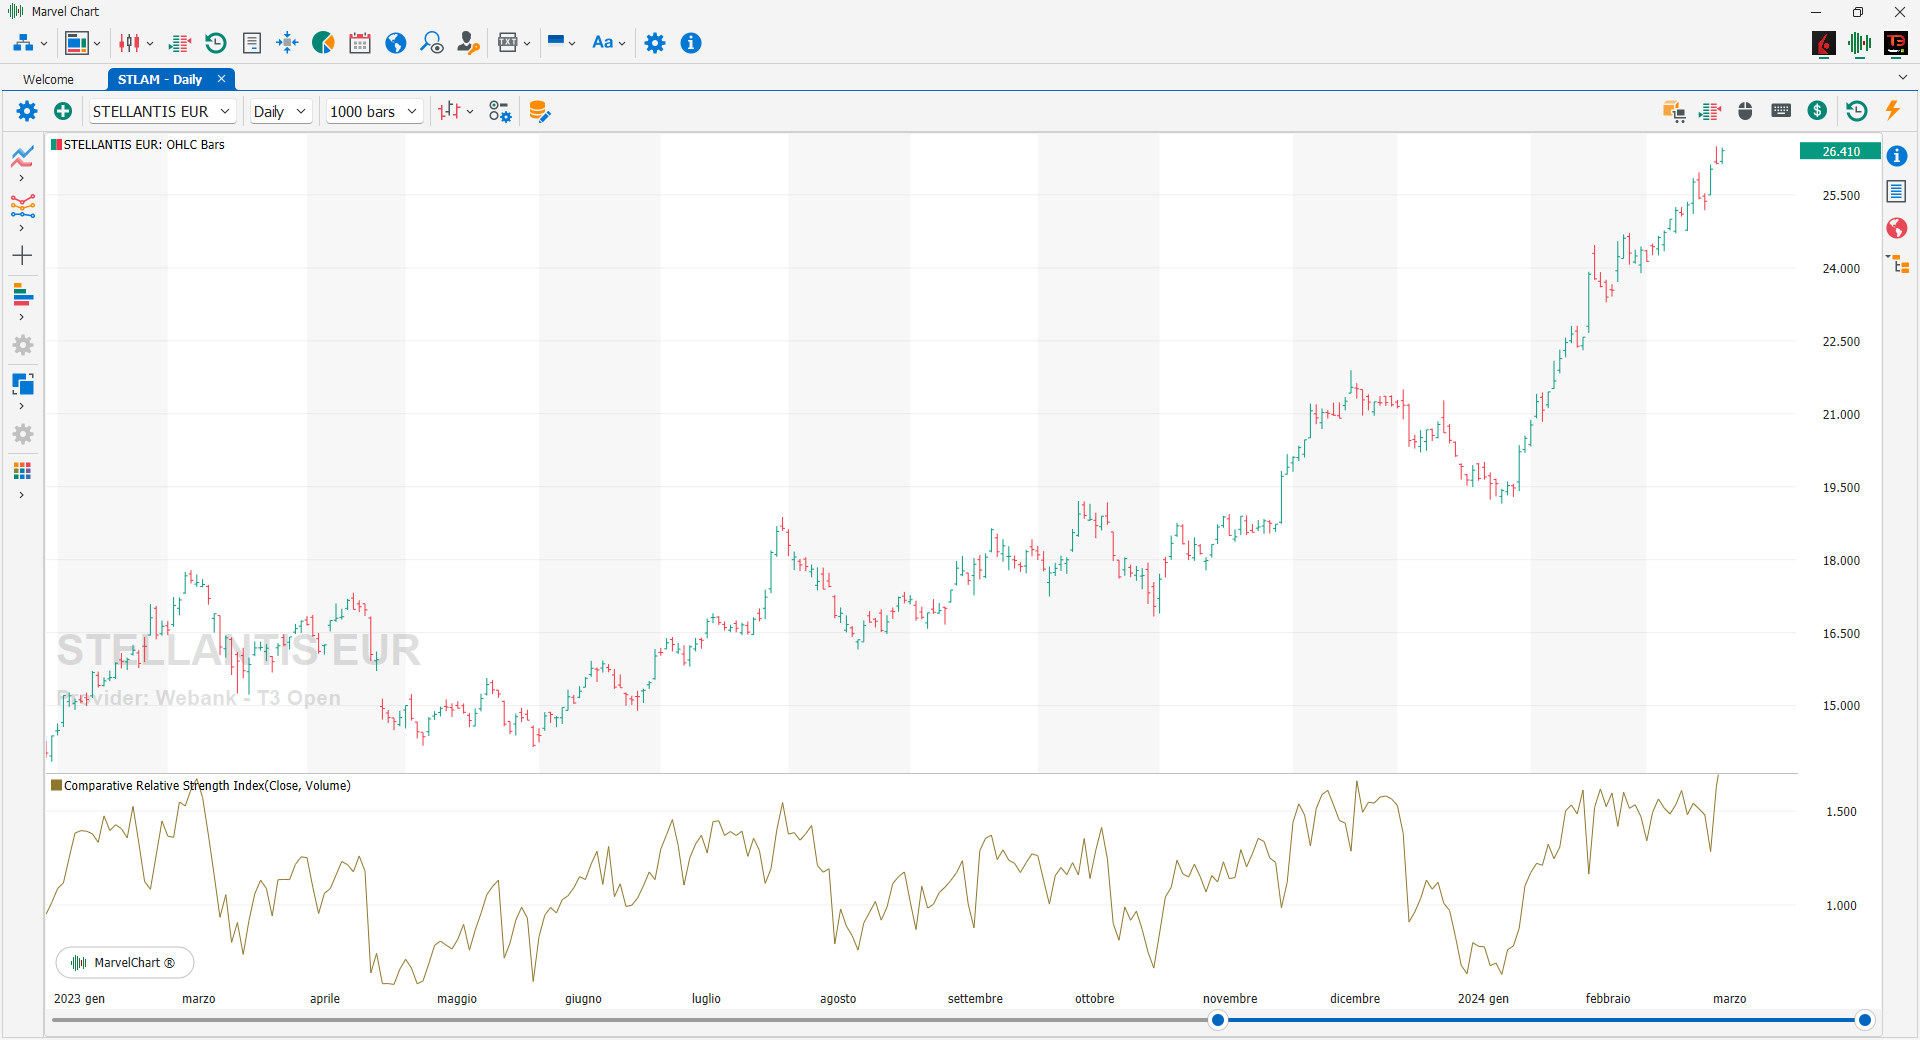
The Comparative RSI is an indicator that compares two prices of the same asset. When the indicator moves sideways, it means that the relationship between the two inputs is closely related and moves in the same way. If the Comparative RSI decreases, the first price is not very efficient compared to the second. All values above 1.0 indicate that the price is outperforming the base price, while a value below 1.0 indicates that it is underperforming.
Connors RSI
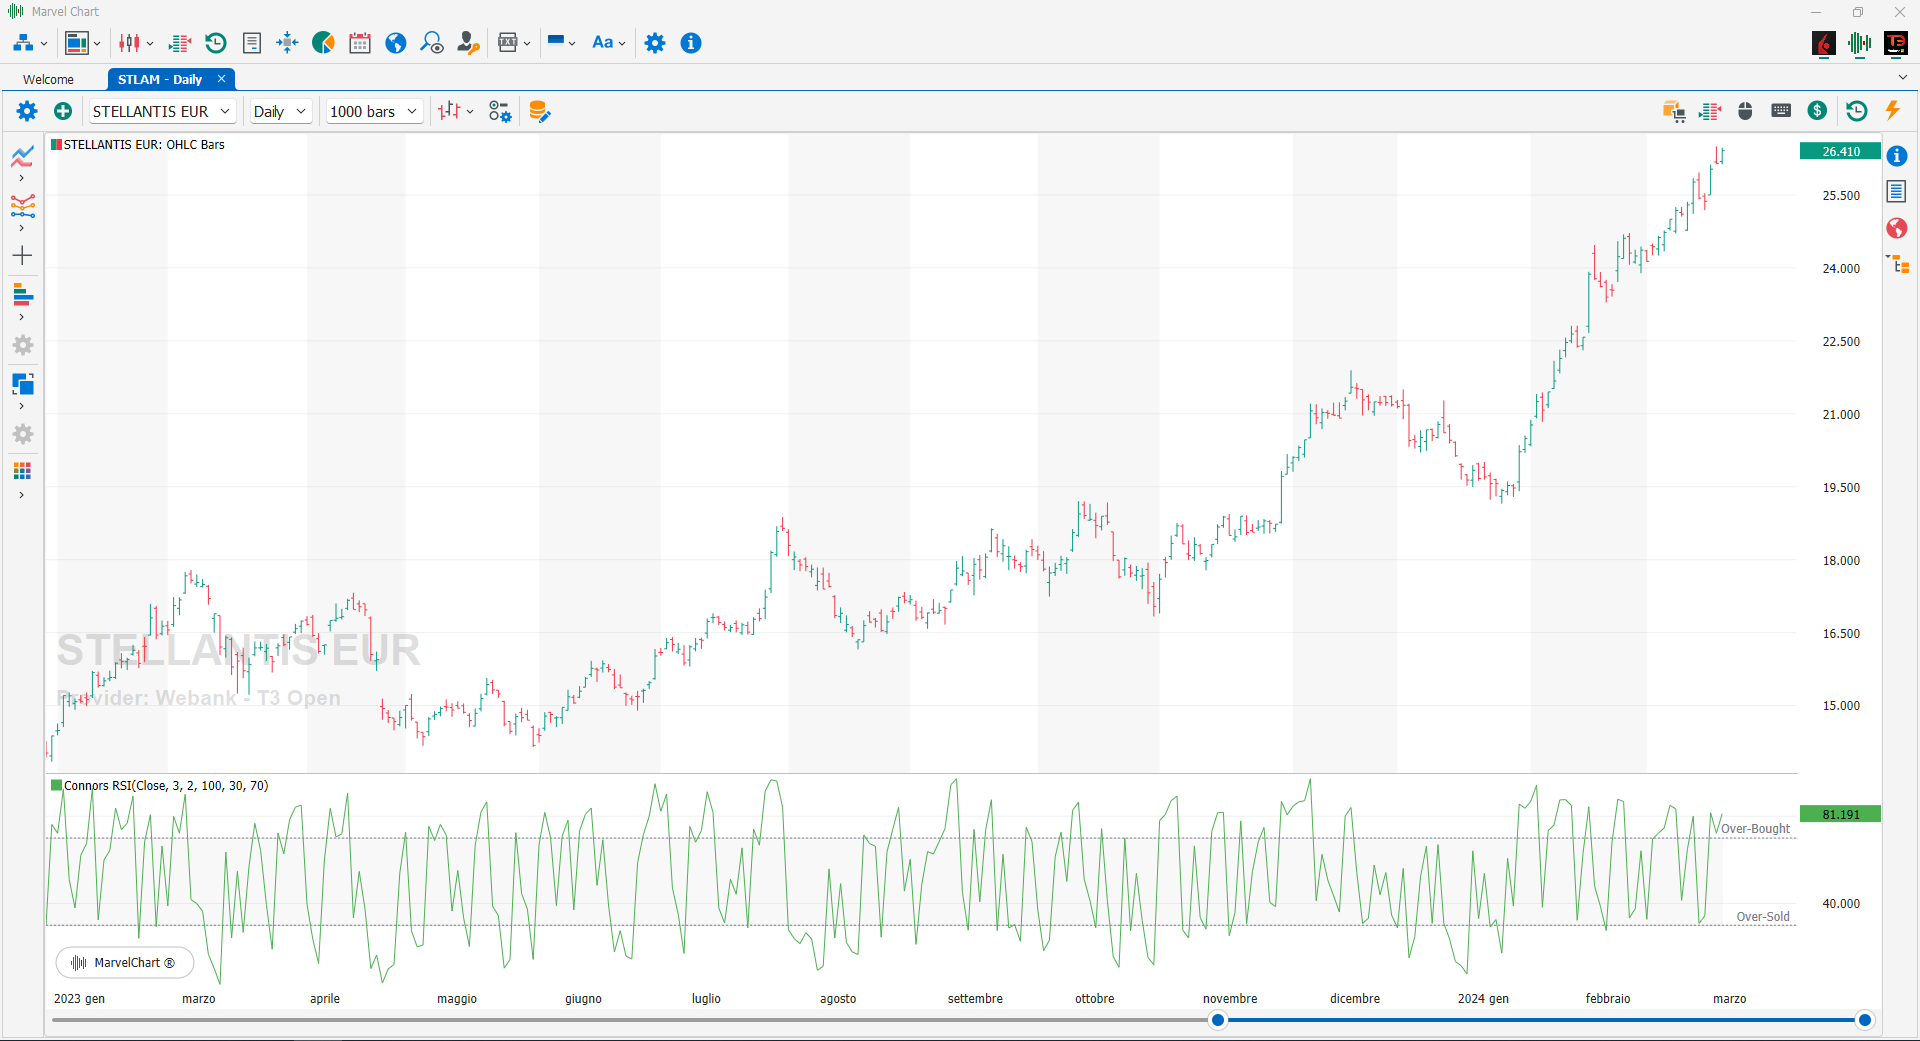
The Connors RSI is a technical analysis indicator created by Larry Connors that is actually a composite of three separate components. The Relative Strength Index (RSI), developed by J. Welles Wilder, plays a key role in the Connors RSI, in fact, Wilder's RSI is used in two of the indicator's three components. The three components, RSI, UpDown Length, and Rate-of-Change, combine to form a momentum oscillator. The Connors RSI returns a value between 0 and 100, which is then used to identify short-term overbought and oversold conditions.
Directional Movement Index
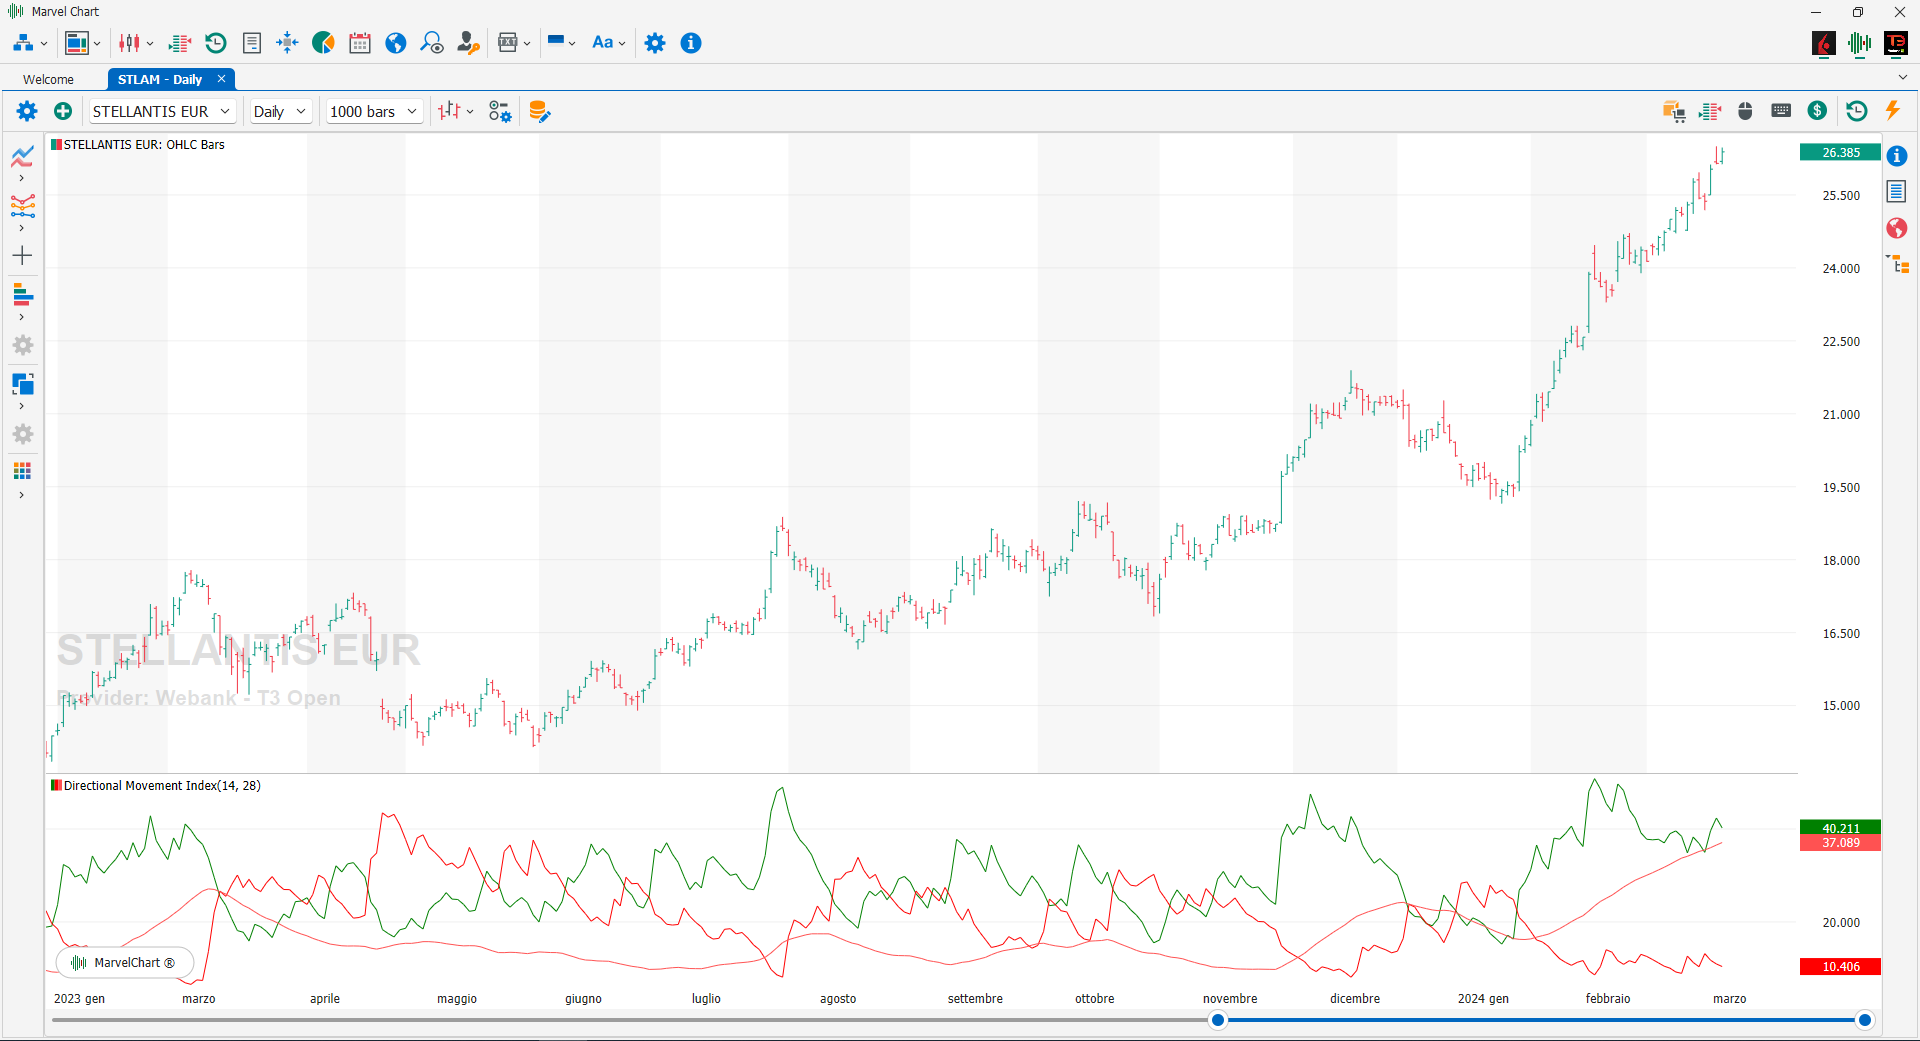
This indicator allows you to capture the actual trend component that characterizes a historical series, also measuring its intensity. Unlike the RSI, the Directional Movement Index requires the use of a greater number of data relating to the historical series: in addition to the CLOSE prices, it requires the HIGH and LOW prices recorded in the selected period. It should be said that the system uses the interaction of three indicators: DI+, which indicates the bullish component of the movement of the historical series, DI-, which indicates the bearish component, and DX (or ADX), which indicates the directional intensity of the movement of the series investigated. The range of possible values, assumed by the three indicators, goes from 0 to 100. Considering a standard use of 14 periods for the calculation of the three indicators (as indicated by the inventor Welles Wilder), values of the DX curve (or rather ADX) higher than the critical threshold of 20 signal the exit of the stock market dynamics from a congested phase and the beginning of a well-defined trend. In the case ADX and DI+ have an increasing trend in the face of a descending movement of the DI-, the system expresses the intensification of a bullish trend, while in the case of ADX and DI- are in an increasing trend in the face of a descending movement of the DI+ the system expresses the intensification of a bearish trend. If the ADX has a lateral or slightly decreasing trend, while DI+ and DI- tend to converge, the indicator signals the beginning of a congestion phase: a decreasing ADX and the crossing of DI+ and DI- confirm a distribution or redistribution, the crossing of the DI+ and DI- curves and a falling ADX confirm an accumulation or re-accumulation phase.
Elder Force Index
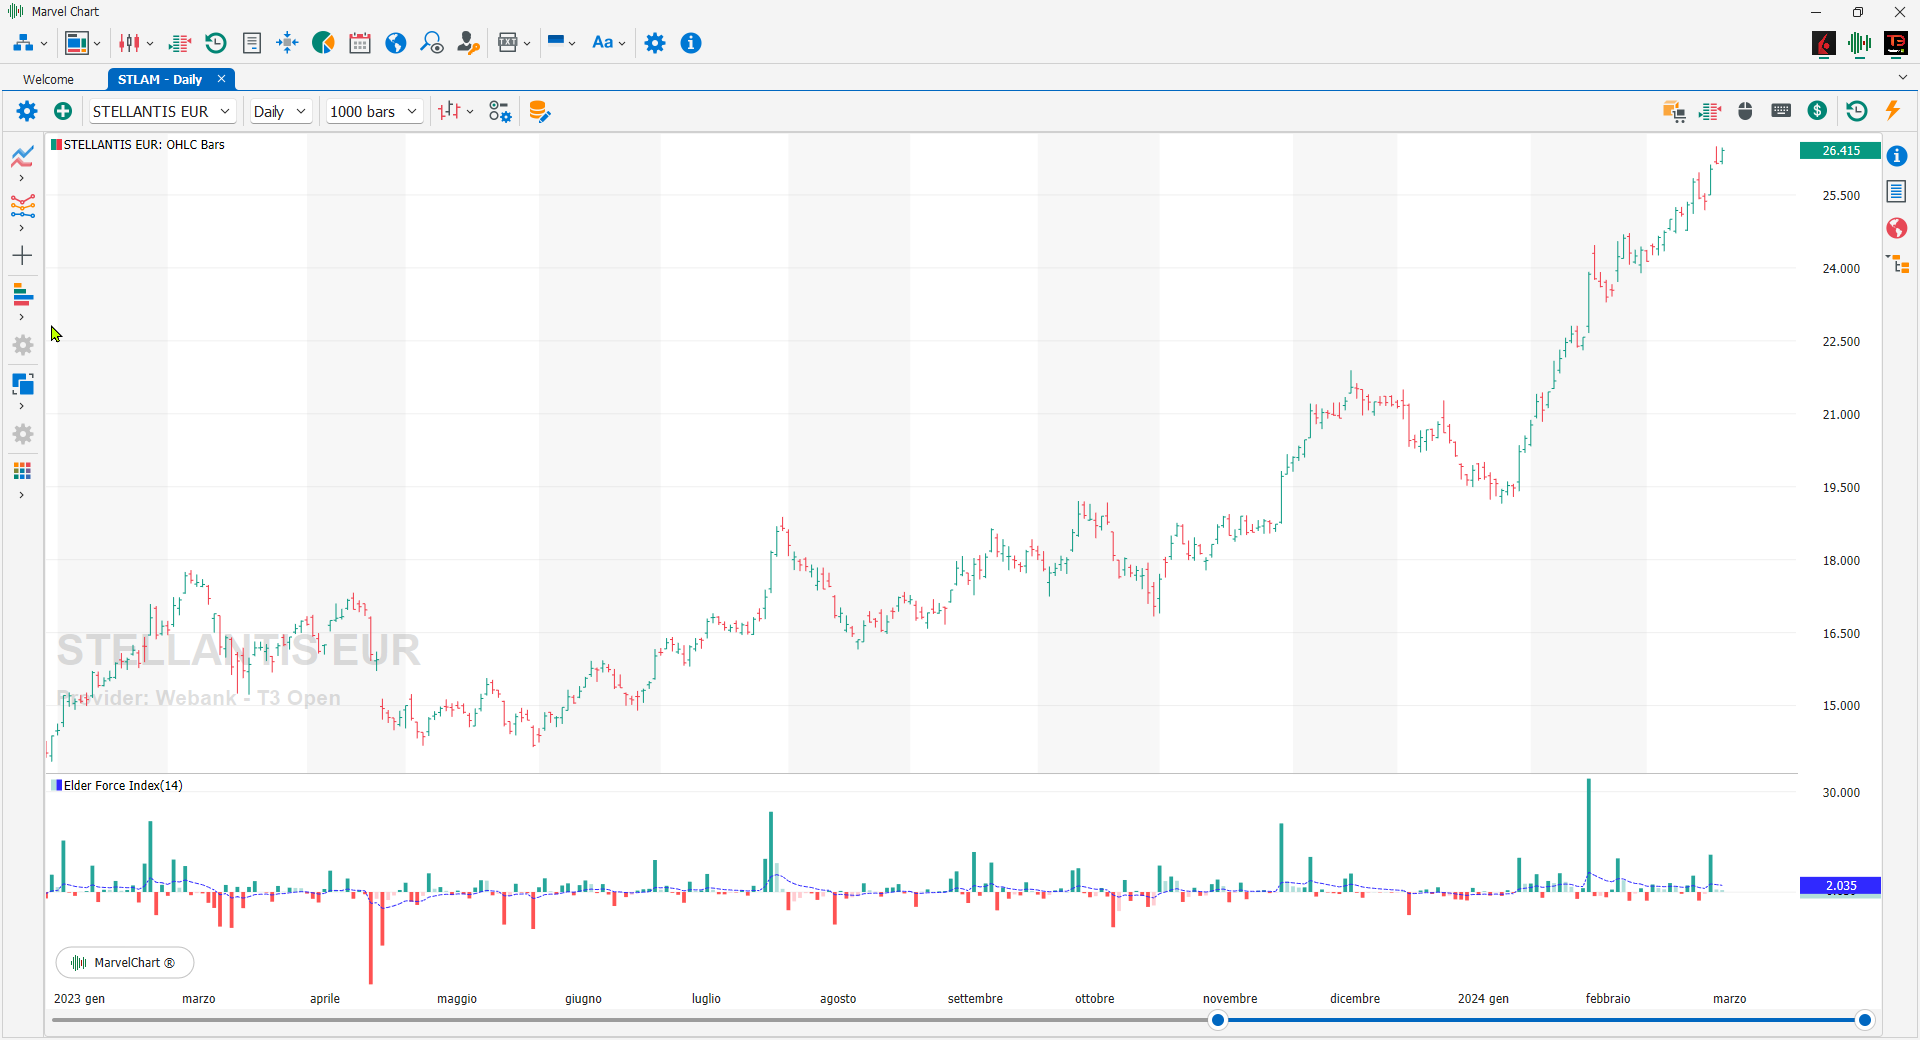
The Force Index technical analysis indicator, developed by Alexander Elder, calculates the strength of price changes using a combination of price and volume. The Elder Force Index indicator draws a line that oscillates above and below zero. This indicator has special features in that it uses price changes, the direction of the price change, and volume. The Elder Force Index is a measure of the prevalence of buyers or sellers in the market. In general, if the price is rising and the Elder Force Index is above zero and rising, the upward movement is likely to continue. On the other hand, if prices are trending upward, but the Elder Force Index is close to zero or is moving towards zero, there is equality between buyers and sellers, so the upward movement of prices is likely to stop or be interrupted. The Elder Force Index is calculated using the last CLOSE, the previous CLOSE and the latest volumes. So if the current CLOSE is higher than the previous one, the Elder Force Index is positive, and if the current CLOSE is lower than the previous one, the Elder Force Index is negative, also the higher the trading volumes the greater its strength.
Elder Ray Power
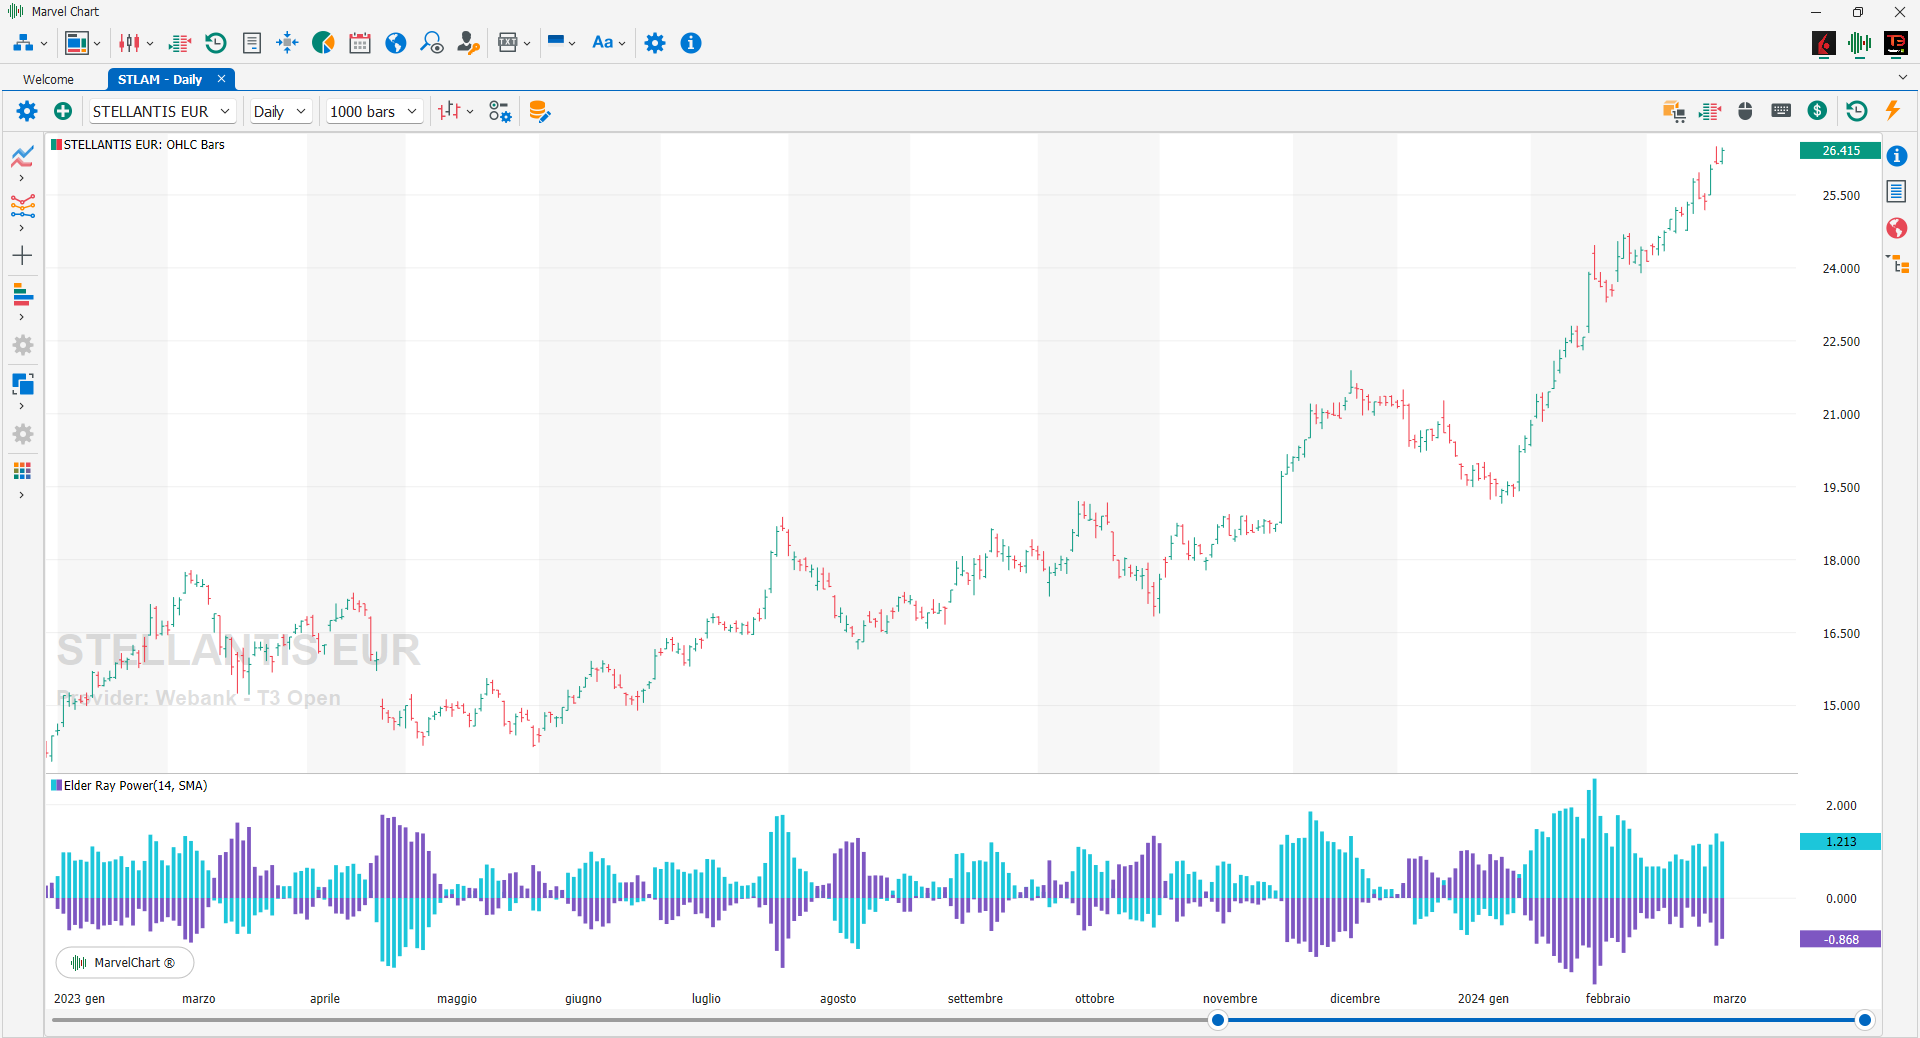
Long positions are taken when bear power is below zero but rising, and the latest peak of bull power is higher than the previous one (rising). A short position is taken when the bull power value is positive but declining, and the recent bear power low is lower than the previous (declining) low. In both cases, the slope of the EMA can also be used to confirm the direction of the trend. Traders can watch for bullish and bearish signals and then wait for the EMA to start moving in the expected direction before taking a trade, or sometimes the EMA is already moving in a particular direction and then the bullish/bearish power indicators will give an indication of the market signal. Dr. Elder's original methodology generally uses a 13-period exponential moving average (EMA) to assess the market's consensus value. This can be modified to suit personal preference and Elder himself has used 26-day EMAs when analyzing weekly charts. Bull power measures the ability of buyers to push prices above the consensus value, while bear power measures the ability of sellers to push prices below that value.
Gopalakrishnan Range Index
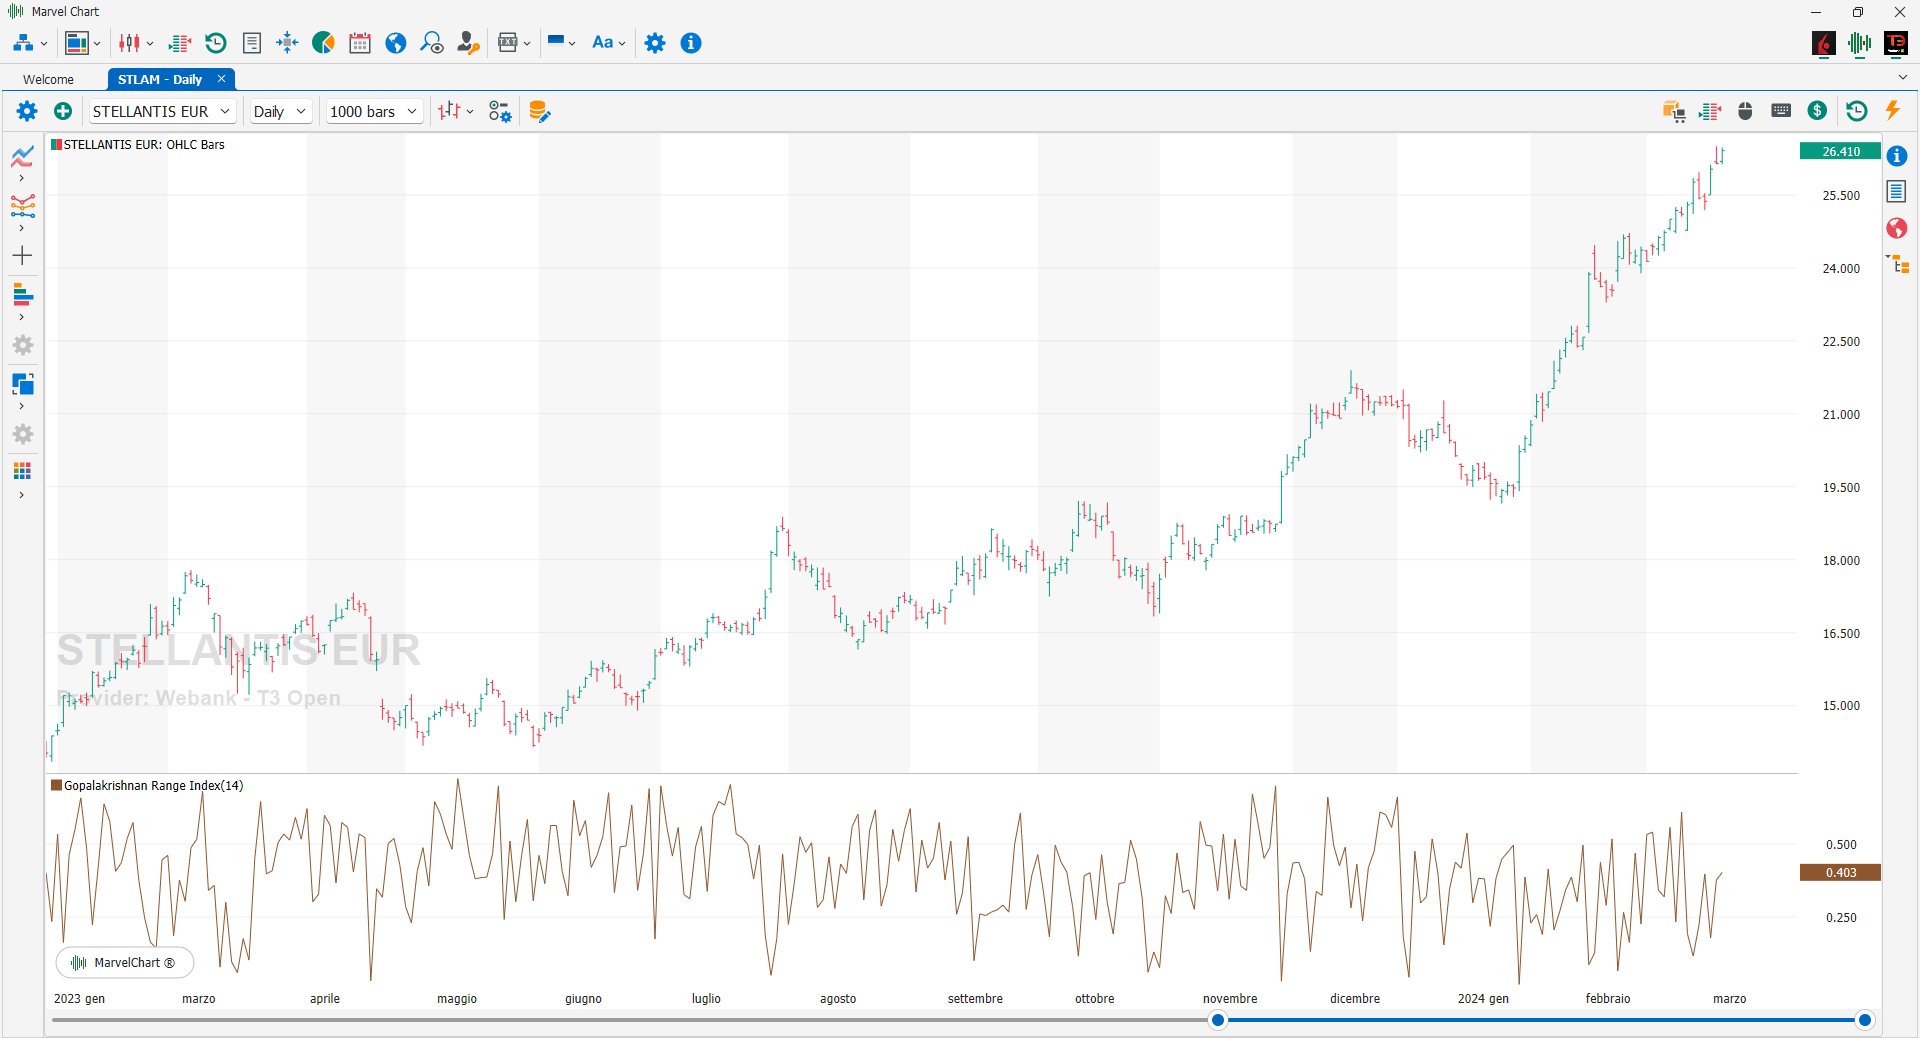
The Gopalakrishnan Range Index is a volatility and momentum indicator, designed by Jayanthi Gopalakrishnan to distinguish between irregular trends and defined trends. Every type of market offers opportunities to the trader, but for Gopalakrishnan it is important to know what type of market you are dealing with and whether it reflects your trading style. The goal of the Gopalakrishnan Range Index is not to generate buy or sell signals, but to provide an overview, a starting point that you can use to identify financial instruments that match your trading style. An increase in the Gopalakrishnan Range Index represents an increase in the volatility of the financial instrument, and it is therefore advisable to use the Gopalakrishnan Range Index in conjunction with a trend indicator.
Intraday Momentum Index
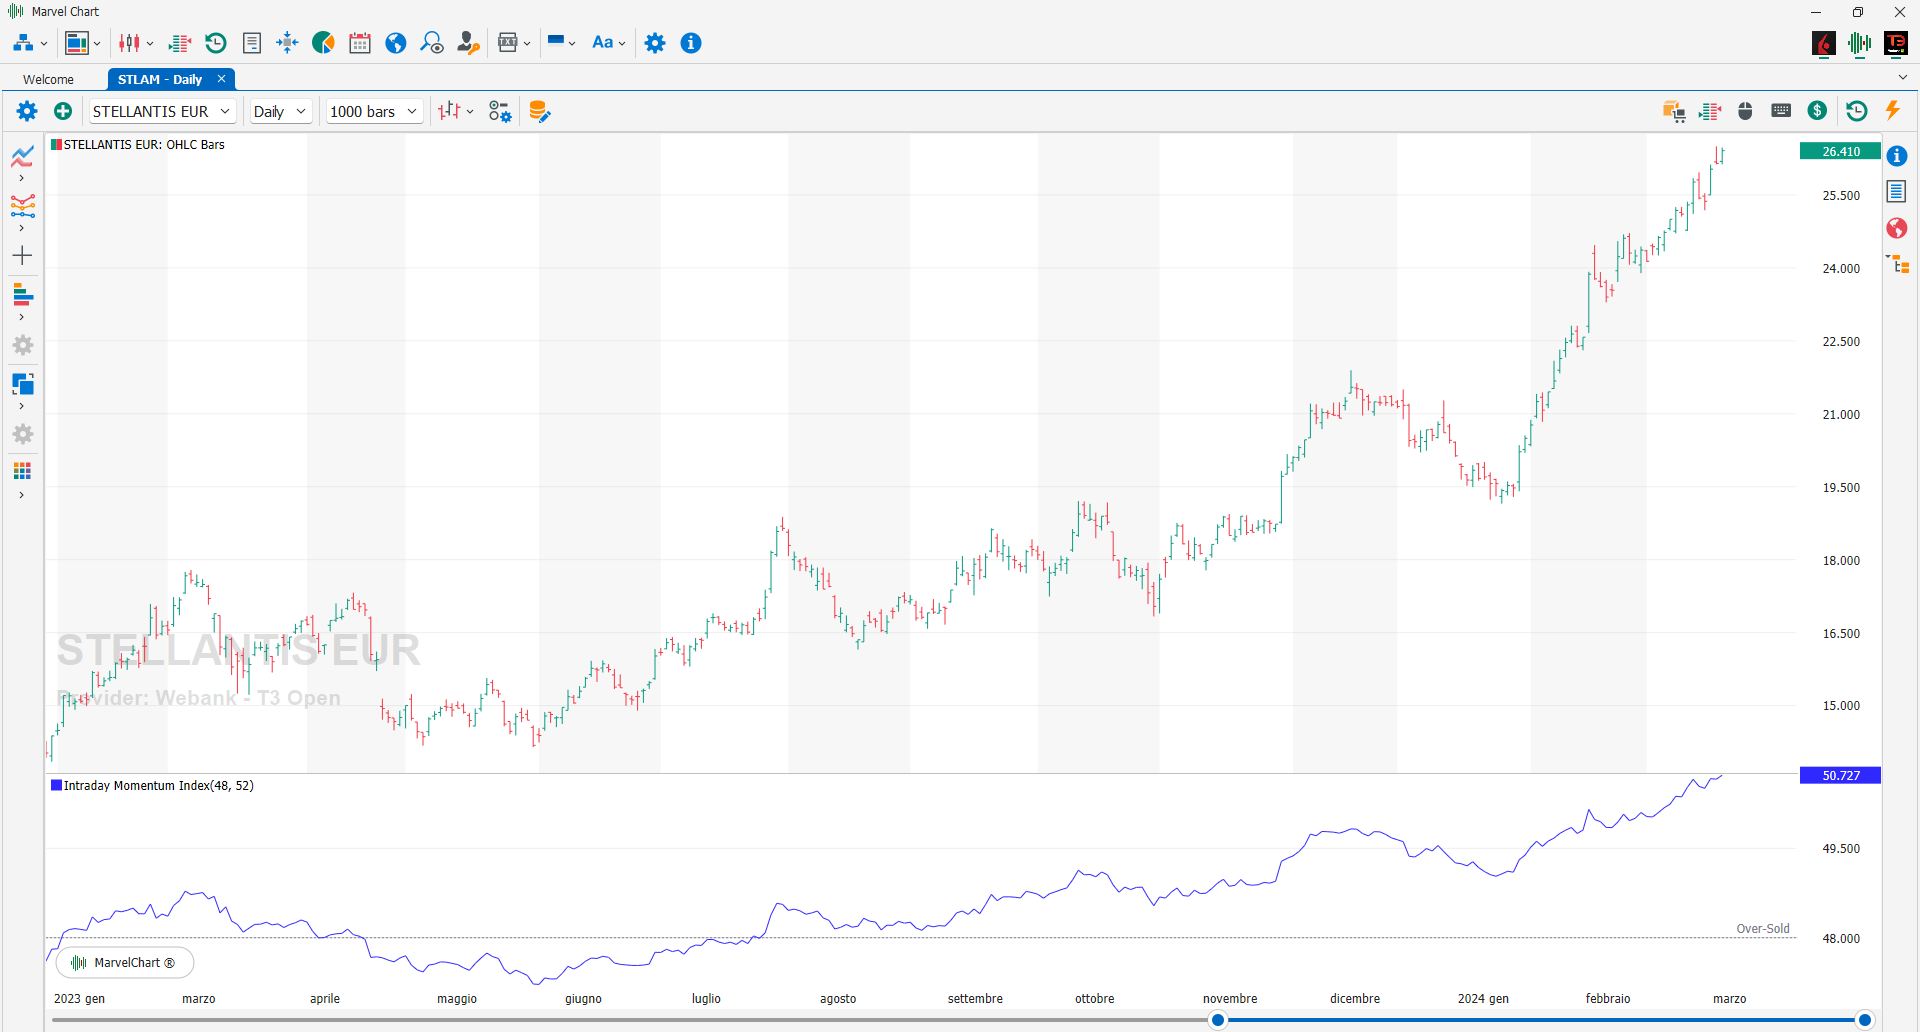
The Intraday Momentum Indicator, created by Tushar Chande, has a very similar construction to Welles Wilder's RSI: it differs from it in that it takes into account not only the difference between today's CLOSE and the CLOSE of the previous day (interday momentum) but also the difference between today's CLOSE and the CLOSE of the previous day (interday momentum) today's CLOSE and OPEN (intraday momentum), that is, essentially, the length and color of the candle. For the rest, RSI and IMI are substantially identical. Since intraday momentum reverses its course before interday momentum, this will be visible from the color and shape of the candles, but even before that from the behavior of the Intraday Momentum Indicator, which will first tend to flatten, and then move away from the edges, to get closer to the central area. That is, a market – or a stock – that, after a decline, begins a reversal formation that precedes the subsequent rise, will see its Intraday Momentum Indicator go from low values below 30, to values that will tend towards 70, due to the succession of the first green candles to the red candles; and vice versa, a market in a topping phase will begin to present, first timidly, then more and more decisively, red candles: in this case we will have an Intraday Momentum Indicator that, when it reaches the upper oscillation band, will bend downwards, heading towards 30.
Market Facilitation Index
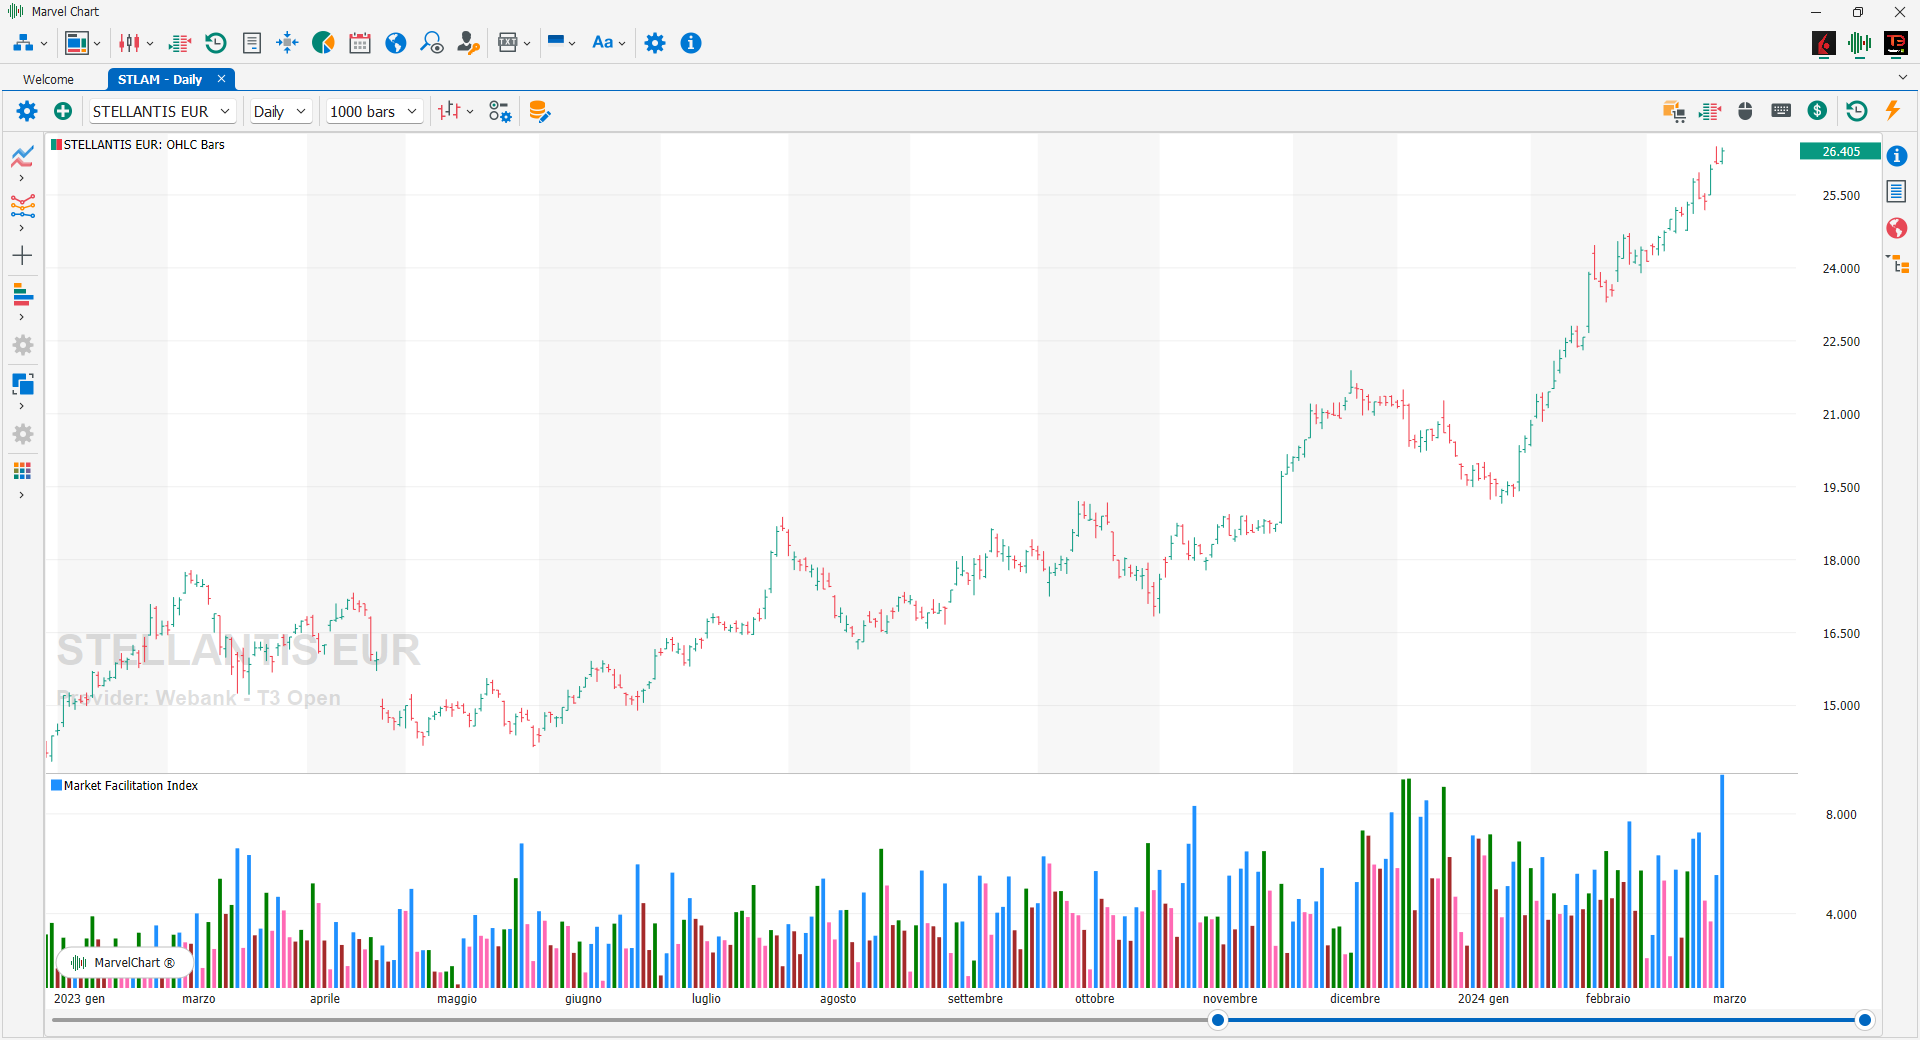
The Market Facilitation Index allows, by comparing it with trading volumes, to understand how indicative a trend is and therefore "rideable" by traders.
GREEN BAR (GREEN MARKET): Simultaneous increase in volumes and the Market Facilitation Index. It is a very active market situation, with many participants who mainly follow the direction of the trend, and this makes the price movement significant, so you can consider opening positions in the direction of the trend. If you have open positions against the trend, it is better to close them.
BROWN BAR (FADE): Decrease in volumes and the Market Facilitation Index. The unattractive market usually occurs at the end of a trend. However, a similar situation could be the “fuse” for a large price movement, in the event that many buyers or sellers were to enter the market, without finding an adequate number of counterparties. This situation could therefore highlight a trend reversal, especially if there are several consecutive brown bars.
BLUE BAR (FAKE): Decrease in volumes but increase in the Market Facilitation Index. There is a trend, but without adequate volumes it is risky because it becomes likely that the market is supported by speculative maneuvers. It is better not to stay on the market in a situation of this type.
PINK BAR (SQUAT): Increase in volumes but decreases the Market Facilitation Index. Market in great activity, but does not express a clear trend because the last battle between bulls and bears is underway, as demonstrated by the high volumes. There could be a great opportunity as soon as this battle ends and a new trend is established.
Money Flow Index
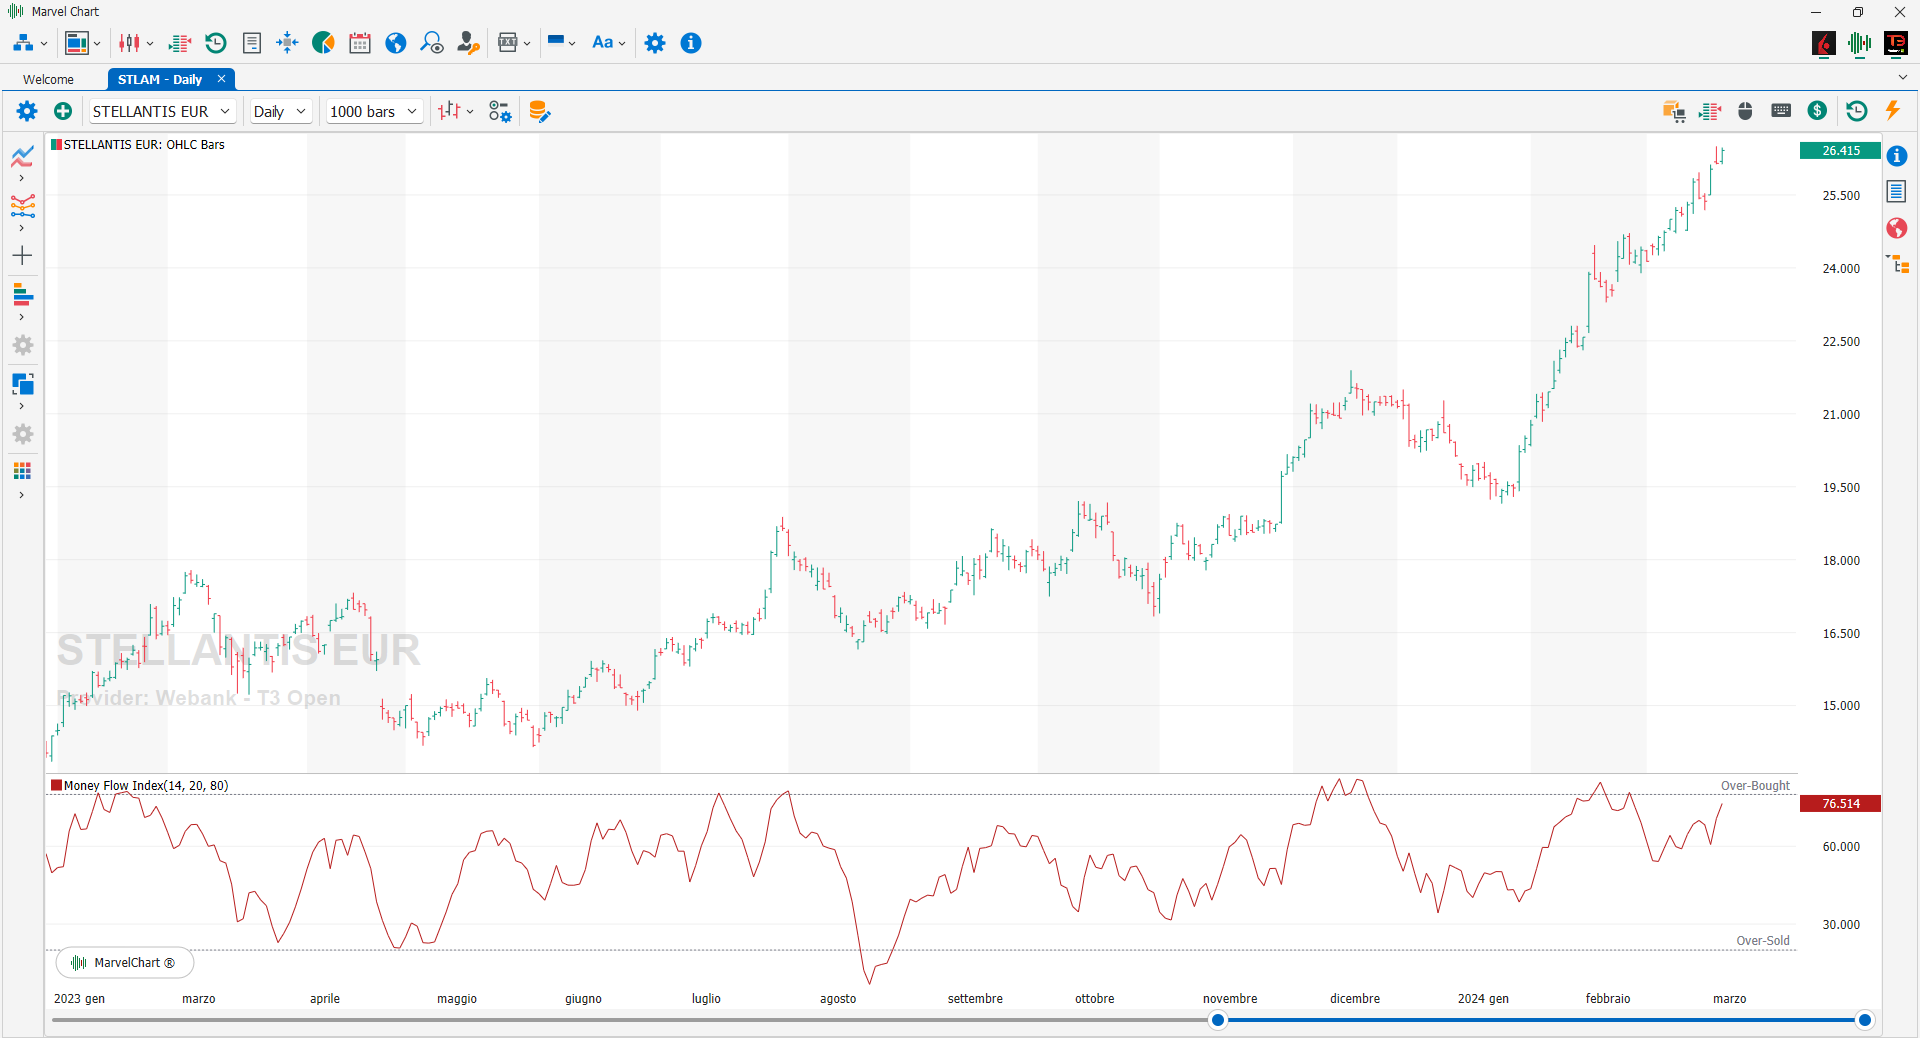
The Money Flow Index is an index dedicated to measuring the flow of total money volumes on an asset, therefore it is a momentum indicator. The Money Flow Index can be defined as a composition between Relative Strength Index and On Balance Volume since the Money Flow Index is calculated on the basis of the prices and volumes of the sessions, with the aim of measuring the strength of a movement as the resulting strength of the volumes and price movement. It can therefore be used as an overbought signal (values above 80), or oversold (values below 20), but also as a divergence indicator, in practice for increasing MFI and stable prices or even a slight decrease it announces a change of trend therefore a signal of the start of a positive trend. In the opposite case, i.e. for decreasing MFI and growing prices, a change of trend in negative is announced. Again, this is rare, but the signal is reliable.
Q-Stick
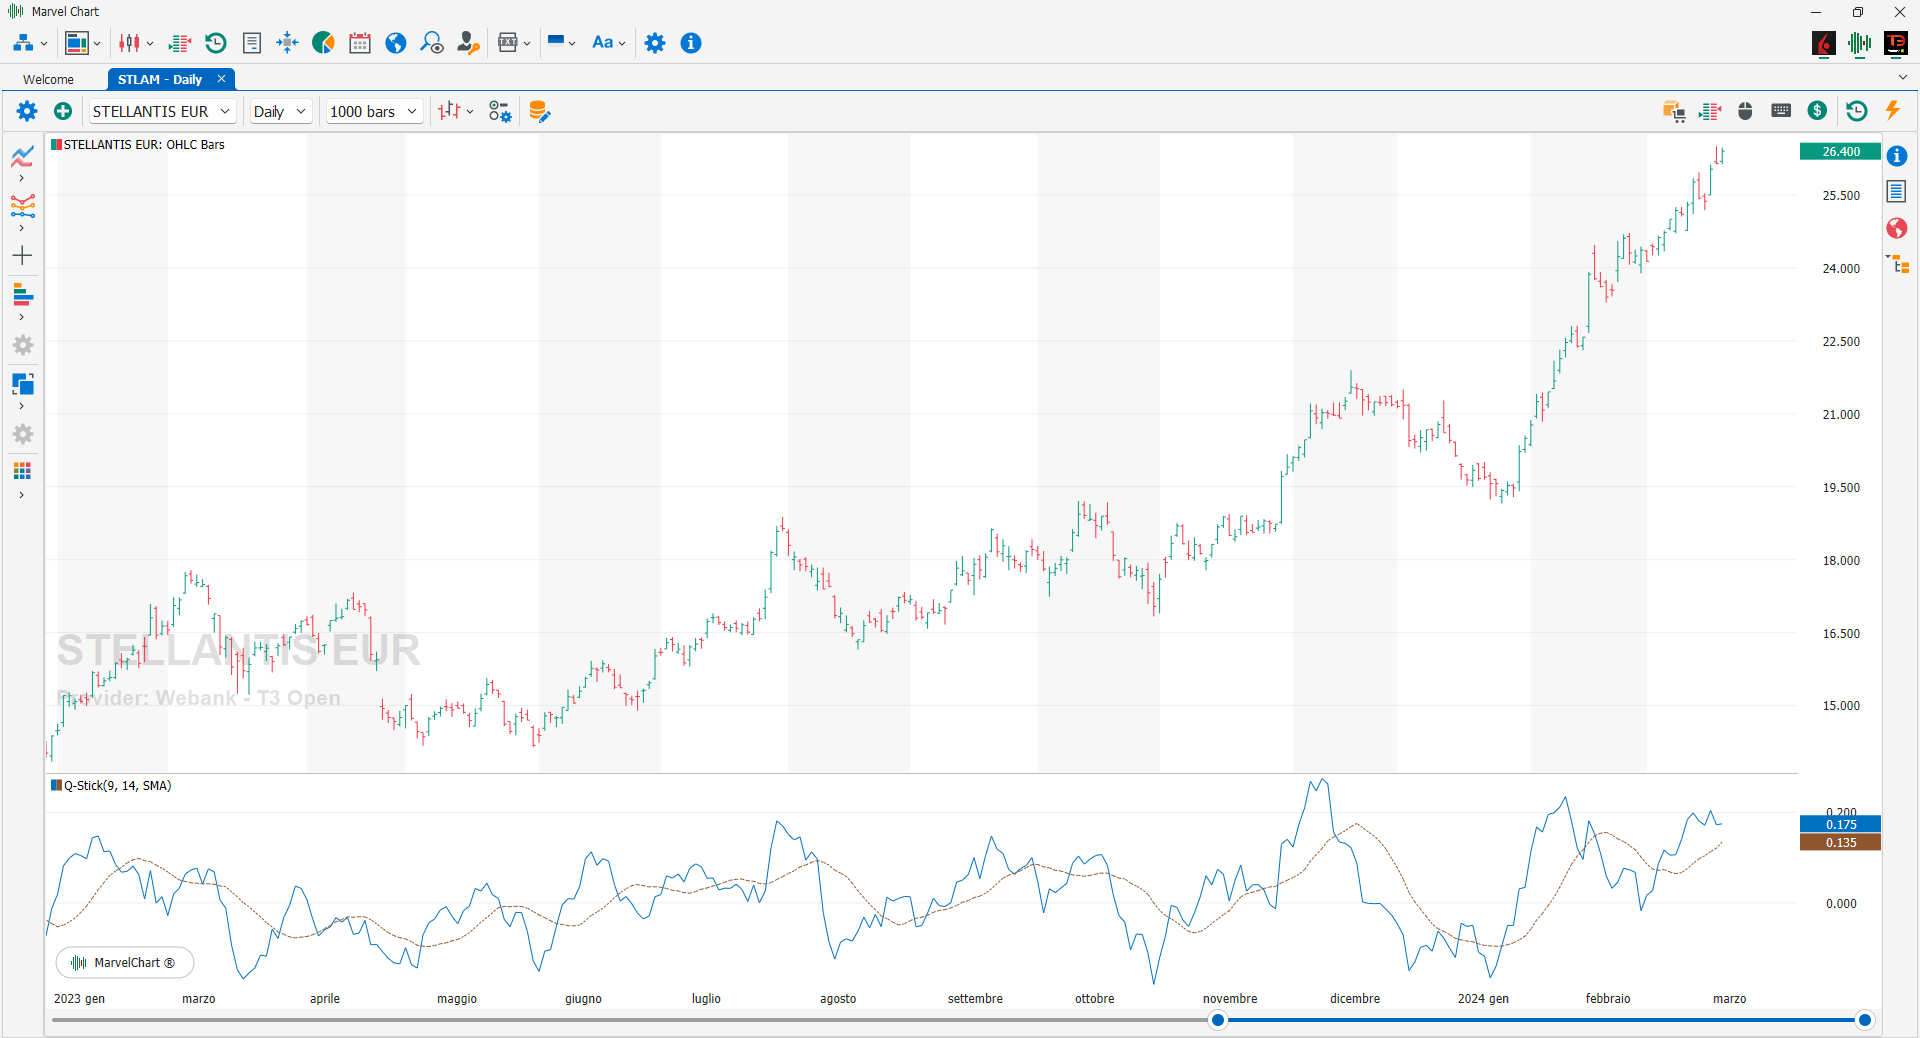
The Q-Stick indicator, designed by Tushar Chande, is used in intraday and very often as an aid to Candlestick analysis. The Q-Stick indicator is the "moving average" of the difference between CLOSE and OPEN. Difference that the author recalls is the heart of Candlestick analysis because it measures and represents the strength and consistency of the bearish or bullish trend. The Q-Stick indicator is used on the advice of the designer with an 8-period base, the operating signals are generated by crossing the zero line. The BUY signal is generated when the Q-Stick indicator passes through the zero line and then when it passes from the negative to the positive quadrant. The SELL signal is activated when the indicator returns to negative territory below the zero line.
Relative Strength Index
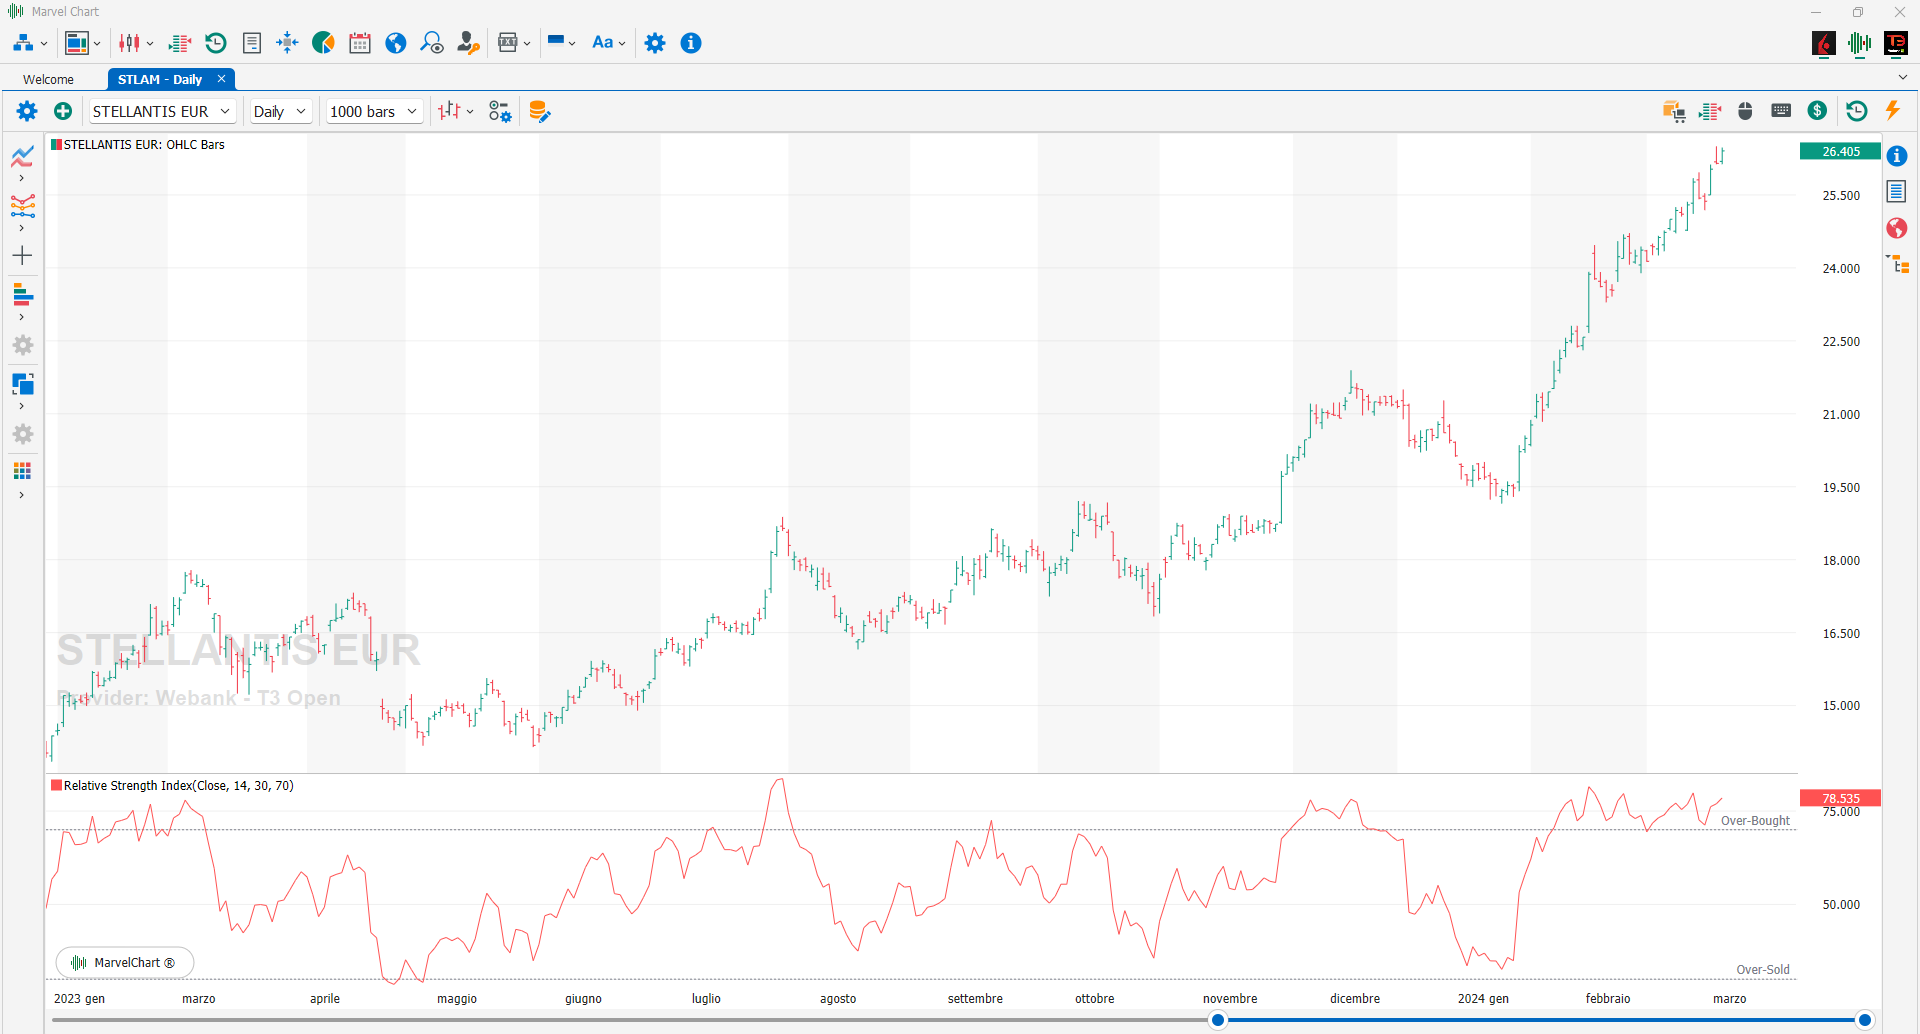
The Relative Strength Index (RSI), created by John Welles Wilder, is one of the most widely used technical analysis oscillators by traders, especially those dealing with futures. It is a momentum indicator, which however manages to overcome some problems present in momentum, in other oscillators considerable complications are generated in their interpretation, especially when sudden movements of the market occur causing a sudden reversal. It is therefore necessary, for a correct and more understandable analysis, to minimize such distortions. The Relative Strength Index, in addition to solving this problem, has a constant oscillation band, from 0 to 100, which allows a comparison of the values with some predetermined constant levels. By presenting a constant excursion band, from 0 to 100, it is possible to identify fixed zones in which the oscillator is in an extreme situation; they will therefore be considered overbought zones when the oscillator records values higher than 70, while we will be oversold if it shows values lower than 30. It should be noted, however, that the classic doctrine of technical analysis identified these extreme levels as 80 and 20, rather than 70 and 30. The signals generated by this oscillator are similar to those of many others. The median line of 50 should be considered as the watershed between a bullish and a bearish market. The intersection of the RSI line with this level can be considered a BUY or SELL signal. But much more important and interesting are, however, the bullish or bearish divergences that can be identified in extreme zones. These signals must be monitored very carefully because they can be classified as alarming situations for the trader; the creator himself considers divergences to be the most indicative characteristic of this oscillator. However, it should be remembered that a strong market prematurely generates overbought or oversold signals and this can lead to hasty exits from a trend that is still potentially valid; in fact, the overbought phases during a bull market can last a long time, like the oversold phases during a bear market. Another system for identifying the market entry and exit signals thanks to this oscillator is through the use of the 30 and 70 lines, which delimit extreme situations. In the case, for example, of a bear market that generates an oversold situation, with the oscillator therefore well below the 30 line, it could be interesting to take bullish positions once the value has returned above that level. This would be an entry with a reasonable margin of risk, but which could prove to be an excellent and timely entry in view of a new bullish movement.
Stochastic Momentum Index
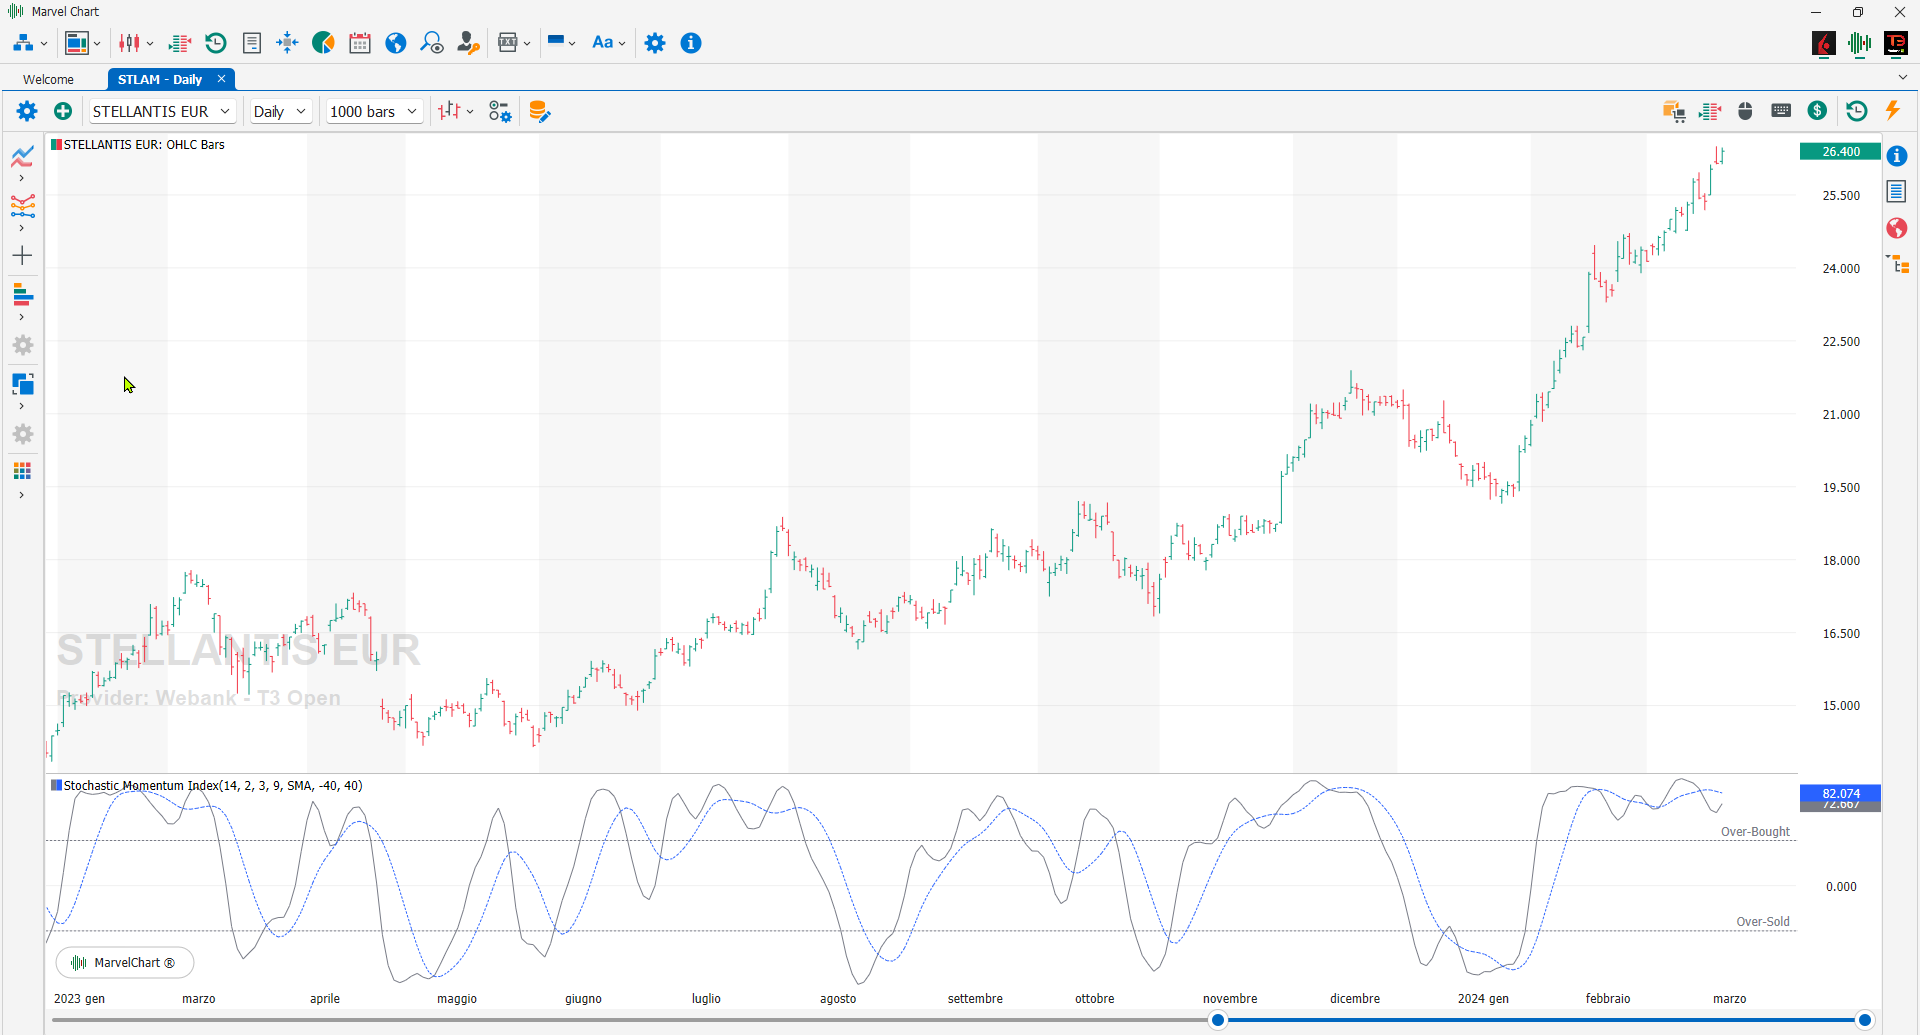
The Stochastic Momentum Index, created by William Blau, indicates how the current CLOSE price differs from the midpoint of the HIGH-LOW interval, built on a certain time interval. The result is an oscillator that moves between +100 and -100. When the close price is higher than the midpoint of the interval, the Stochastic Momentum Index is positive: vice versa, it is negative. Normally, a moving average is applied to the result of the calculation of the Stochastic Momentum Index in order to obtain more homogeneous values. When the moving average is used, the non-averaged value is called Stochastic Momentum Index % K, while the averaged value is Stochastic Momentum Index. A BUY signal is generated when the Stochastic Momentum Index line crosses upwards -40. A SELL signal is generated when the Stochastic Momentum Index line crosses +40.
Stochastic Momentum Index Ergodic
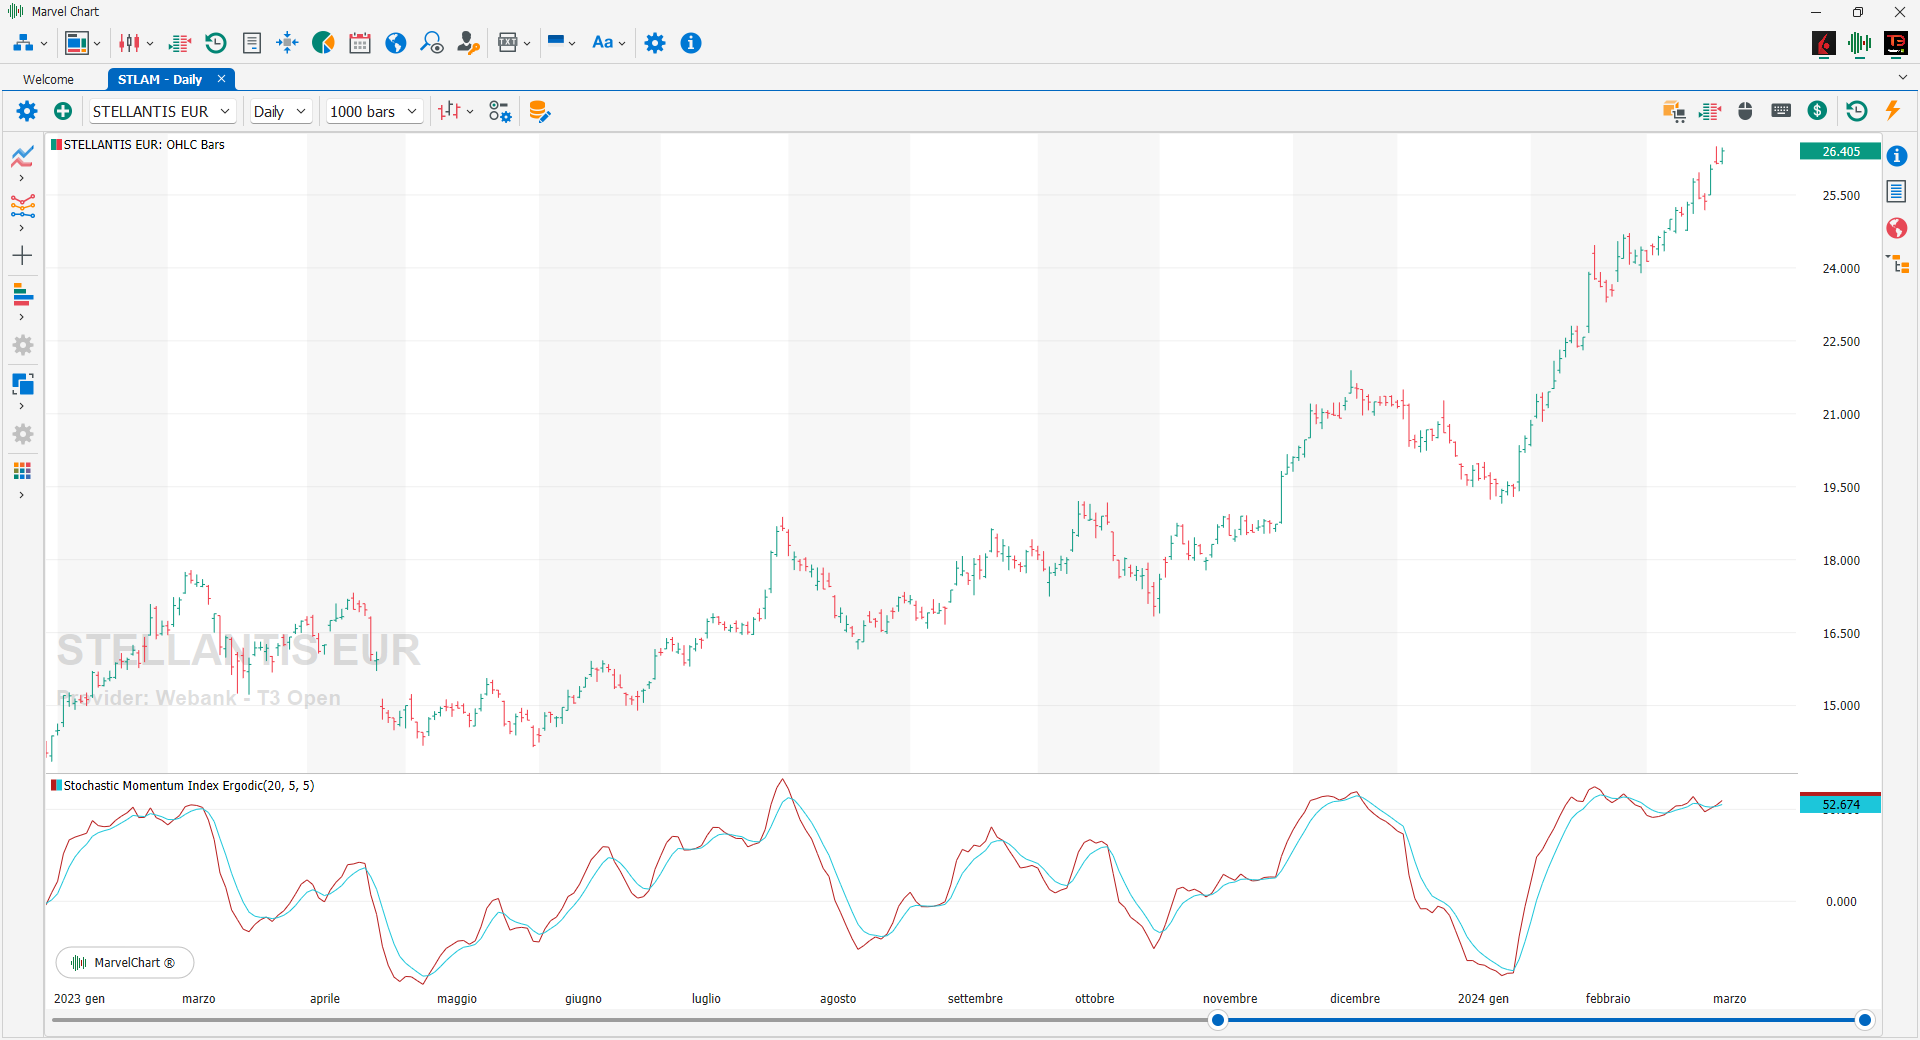
The SMI Ergodic indicator, or Stochastic Momentum Index Ergodic, is a momentum oscillator that measures how far a security's closing price is from the range of its price movements. Unlike the traditional stochastic oscillator, which measures the speed of prices, the SMI provides a clearer and more precise picture of market trends by incorporating the concept of "ergodicity". The concept of ergodicity implies that the average of a time series over time and the average over the set of all possible time series are identical. It provides a clear perspective of market behavior by removing noise, thus improving the trader's ability to identify trends. A rising SMI line typically signals bullish market conditions, while a falling SMI line suggests bearish market conditions. In addition to identifying trends, the Ergodic SMI serves as a powerful tool for identifying potential entry and exit points. When the SMI line crosses the signal line, it is generally considered a bullish signal, indicating a good entry point. Conversely, when it crosses the signal line, it is often seen as a bearish signal, suggesting a potential exit point or selling opportunity.
TRIX
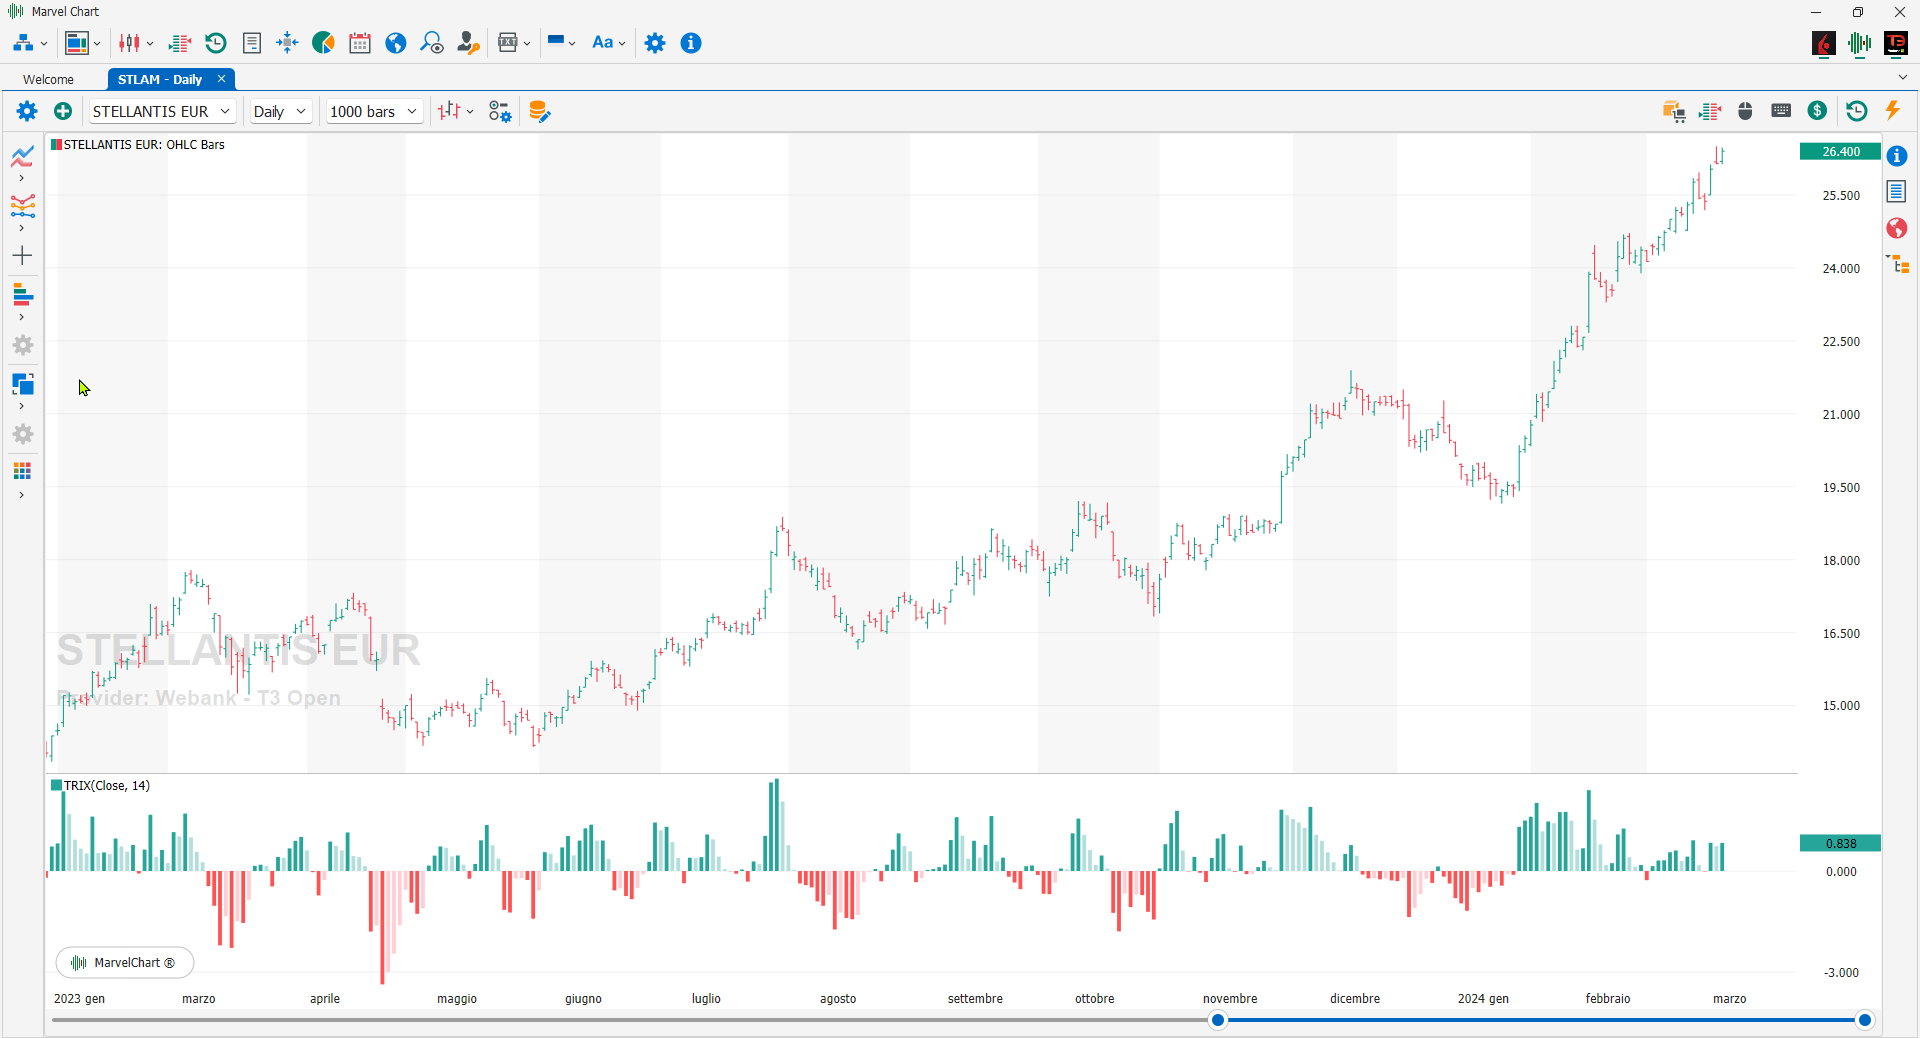
The Trix is a momentum oscillator created by Jack Hutson in 1980. Its peculiarity is that it can filter out small movements of an asset, which are not very significant compared to the primary trend. If used as an oscillator, a positive value indicates an overbought market, while a negative value indicates an oversold market. Many analysts believe that when the Trix crosses upwards, the zero line gives a BUY signal, and when it goes downwards the zero line gives a SELL signal. Furthermore, the divergence between price and Trix can indicate significant turning points in the market.
True Strength Index

The True Strength Index is a momentum oscillator used to identify trends and reversals. The indicator can be useful for determining overbought and oversold conditions, indicating potential changes in trend direction through centerline or signal line crossovers, and warning of trend weakness through divergence.
Williams Accumulation Distribution
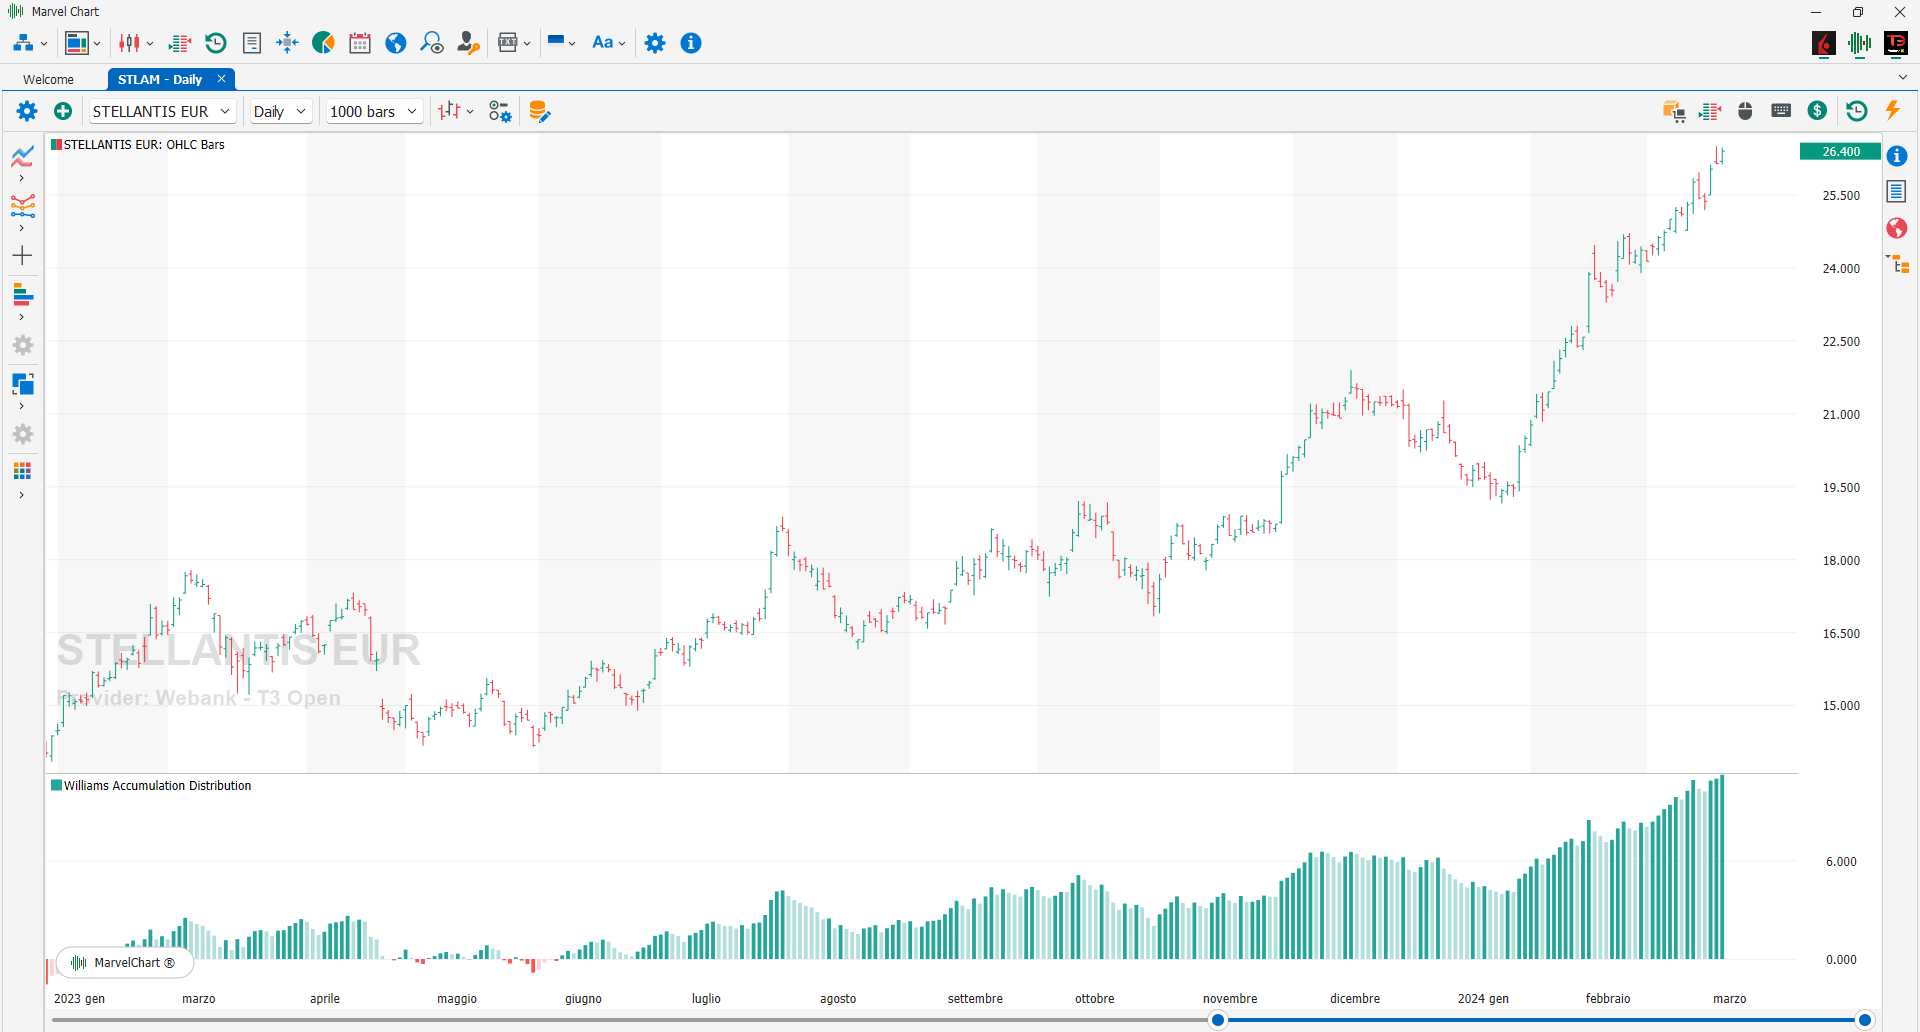
The Williams Accumulation Distribution indicator, by Larry Williams, measures the accumulation of the difference between the upward movements that occurred in a given period in which the price rose very close to the close and those downward movements obtained in the same period, when the price fell very close to the close. The upward movements are also called accumulation movements, while the downward movements are also known as distribution movements. This indicator allows you to have a signal on the type of control that is carried out on the market. If you open multiple long positions, or multiple accumulation positions, it does not necessarily mean that control is the prerogative of those who go long. If, on the other hand, you open multiple short positions, i.e. distribution positions, it does not necessarily mean that the market is the prerogative of those who go short. At an operational level, the Williams Accumulation Distribution gives us the BUY signal if it forms a positive divergence. If it forms a negative divergence, it gives us the SELL signal.