Studies
4-Bar Symmetrical Finite Impulse Response Filter
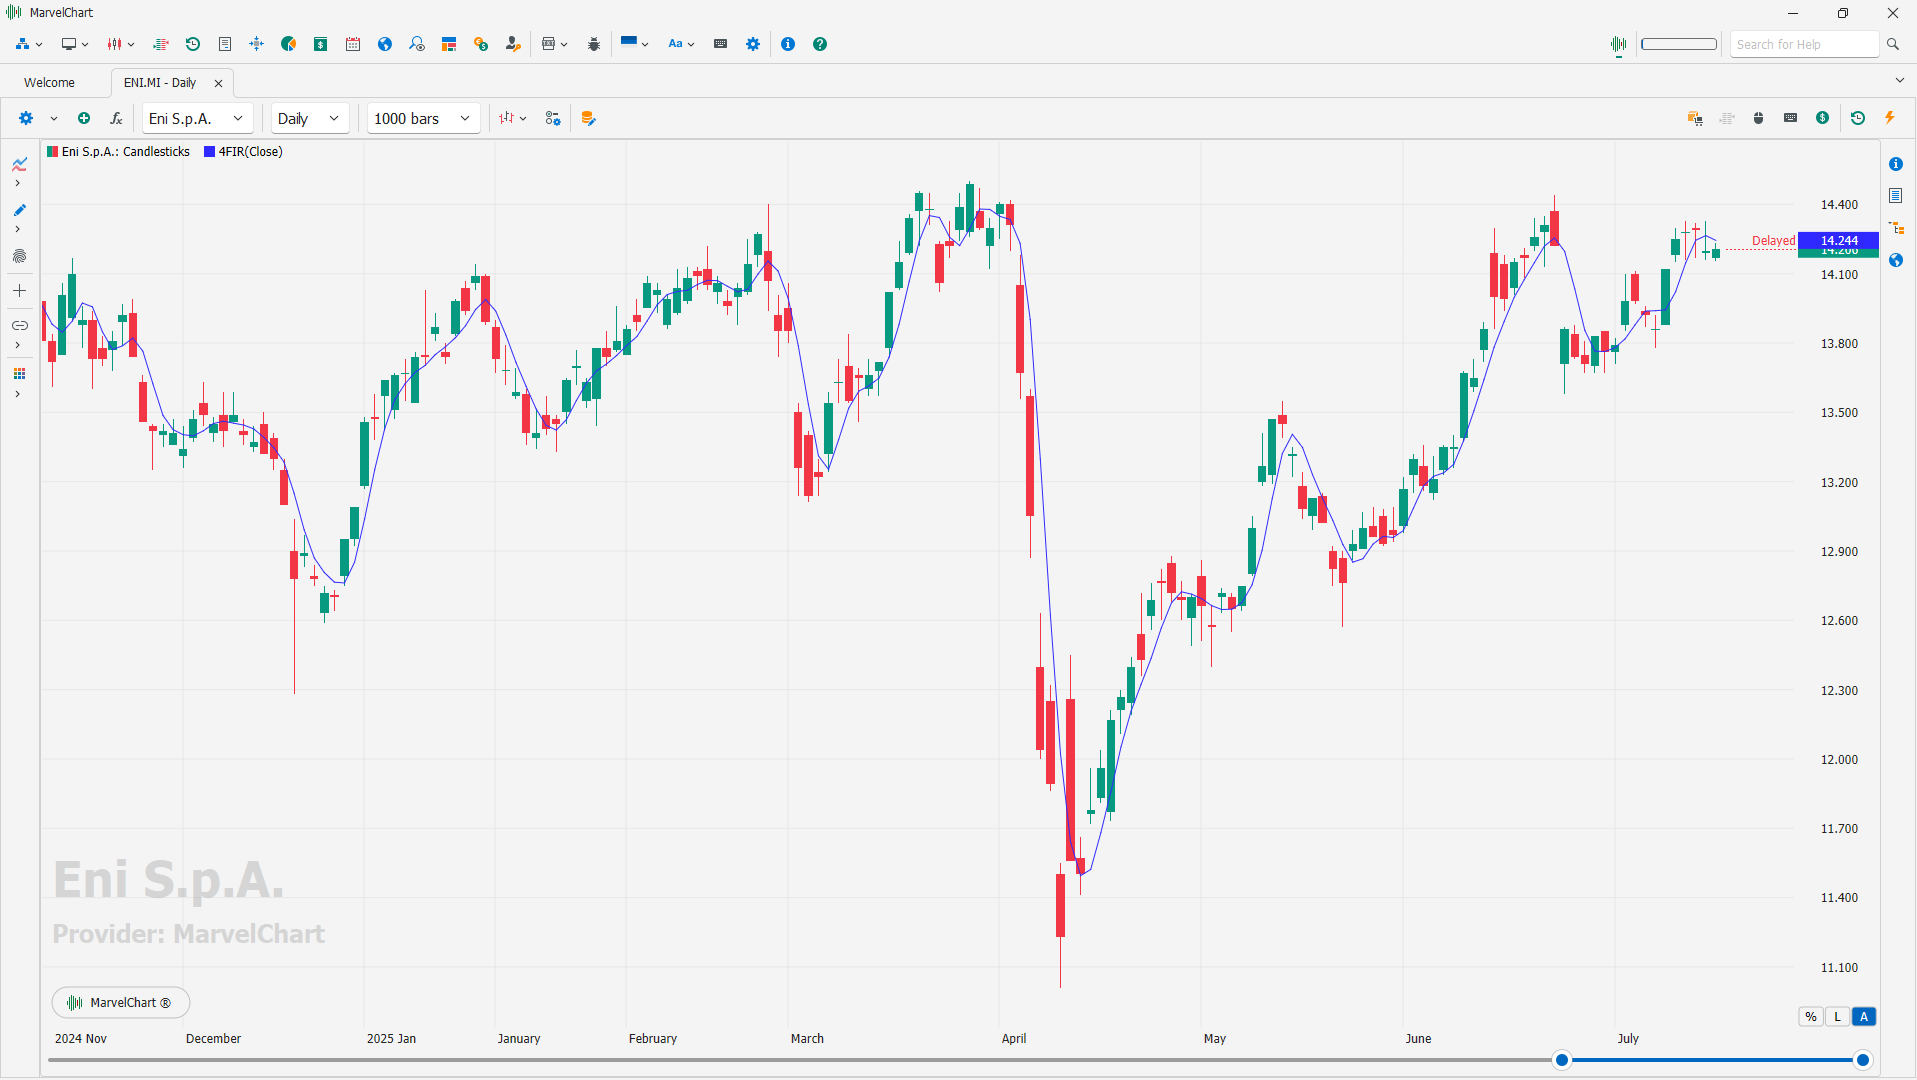
A four-bar symmetrical Finite Impulse Response (FIR) filter, also known as a ""symmetrical FIR filter"", is a type of digital filter where the impulse response is symmetrical around a central point, and it has four coefficients.
Auto TrendLines (Beta)
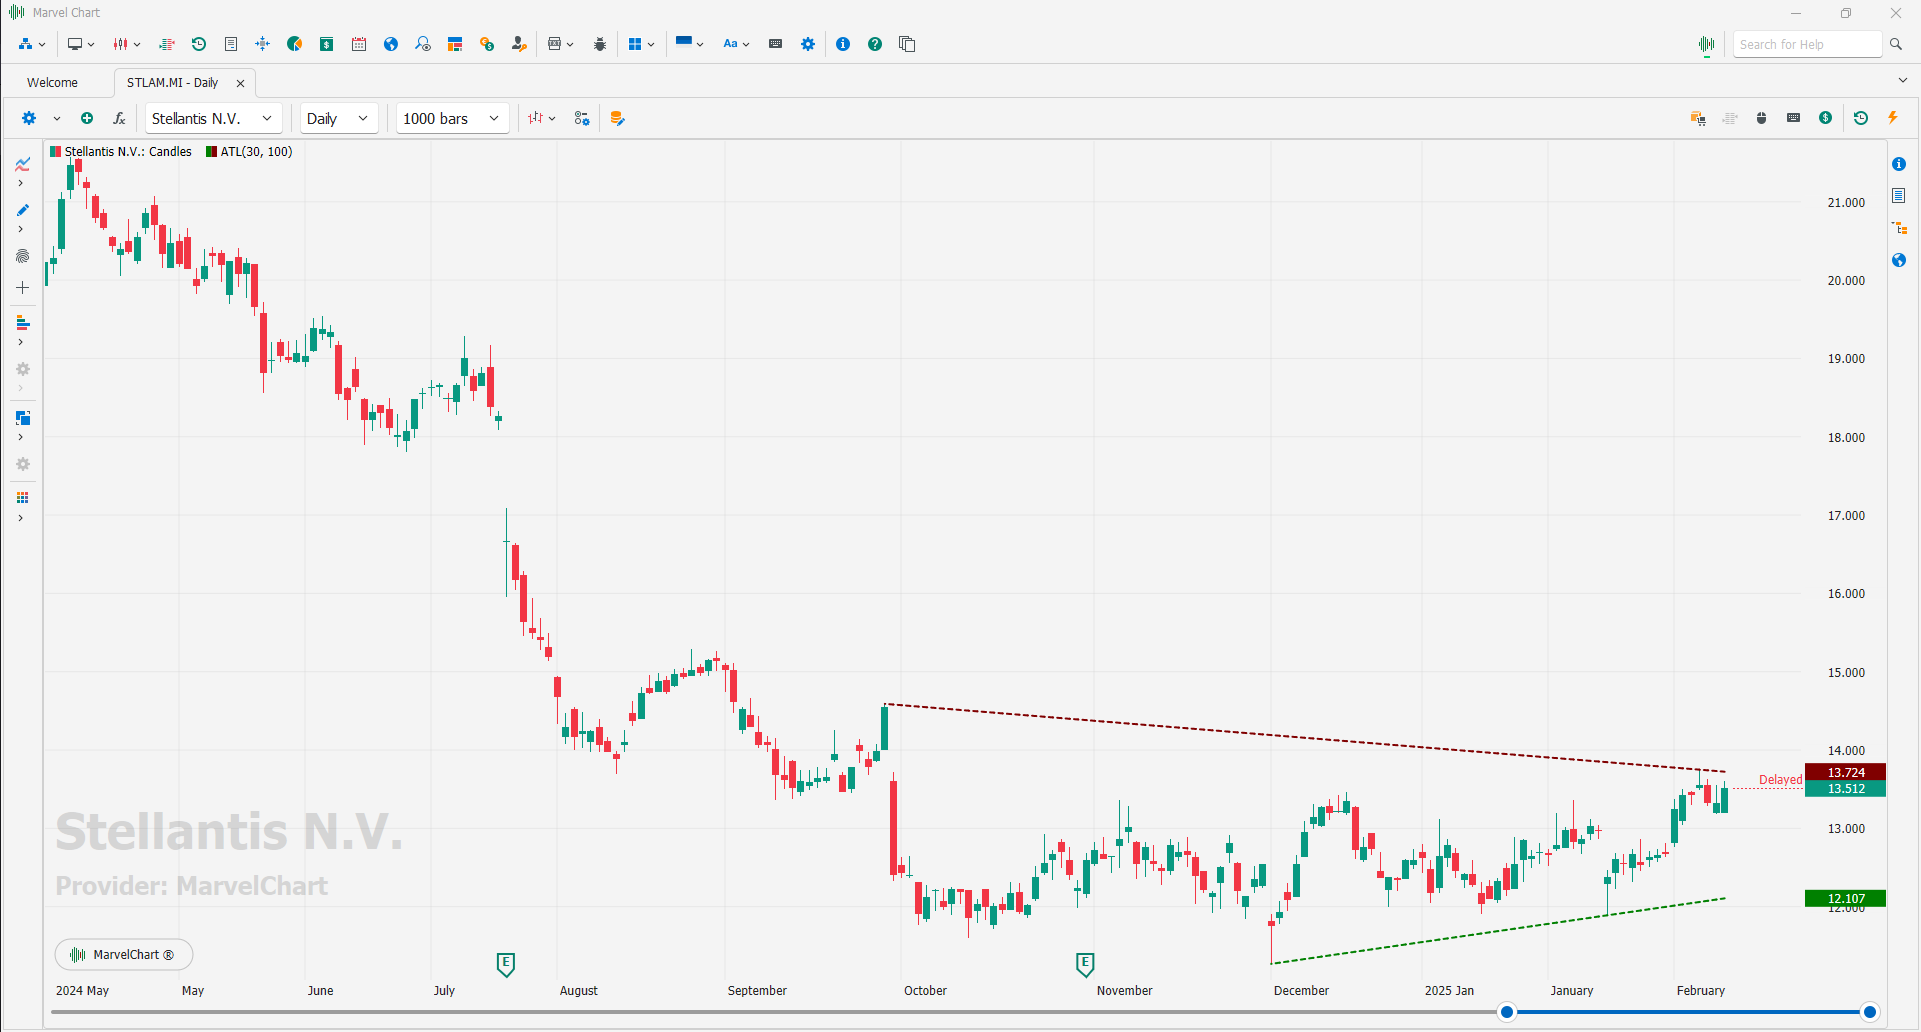
The Auto TrendLines indicator draws two Trend Lines on the chart to represent support and resistance levels.
Butterworth Filter
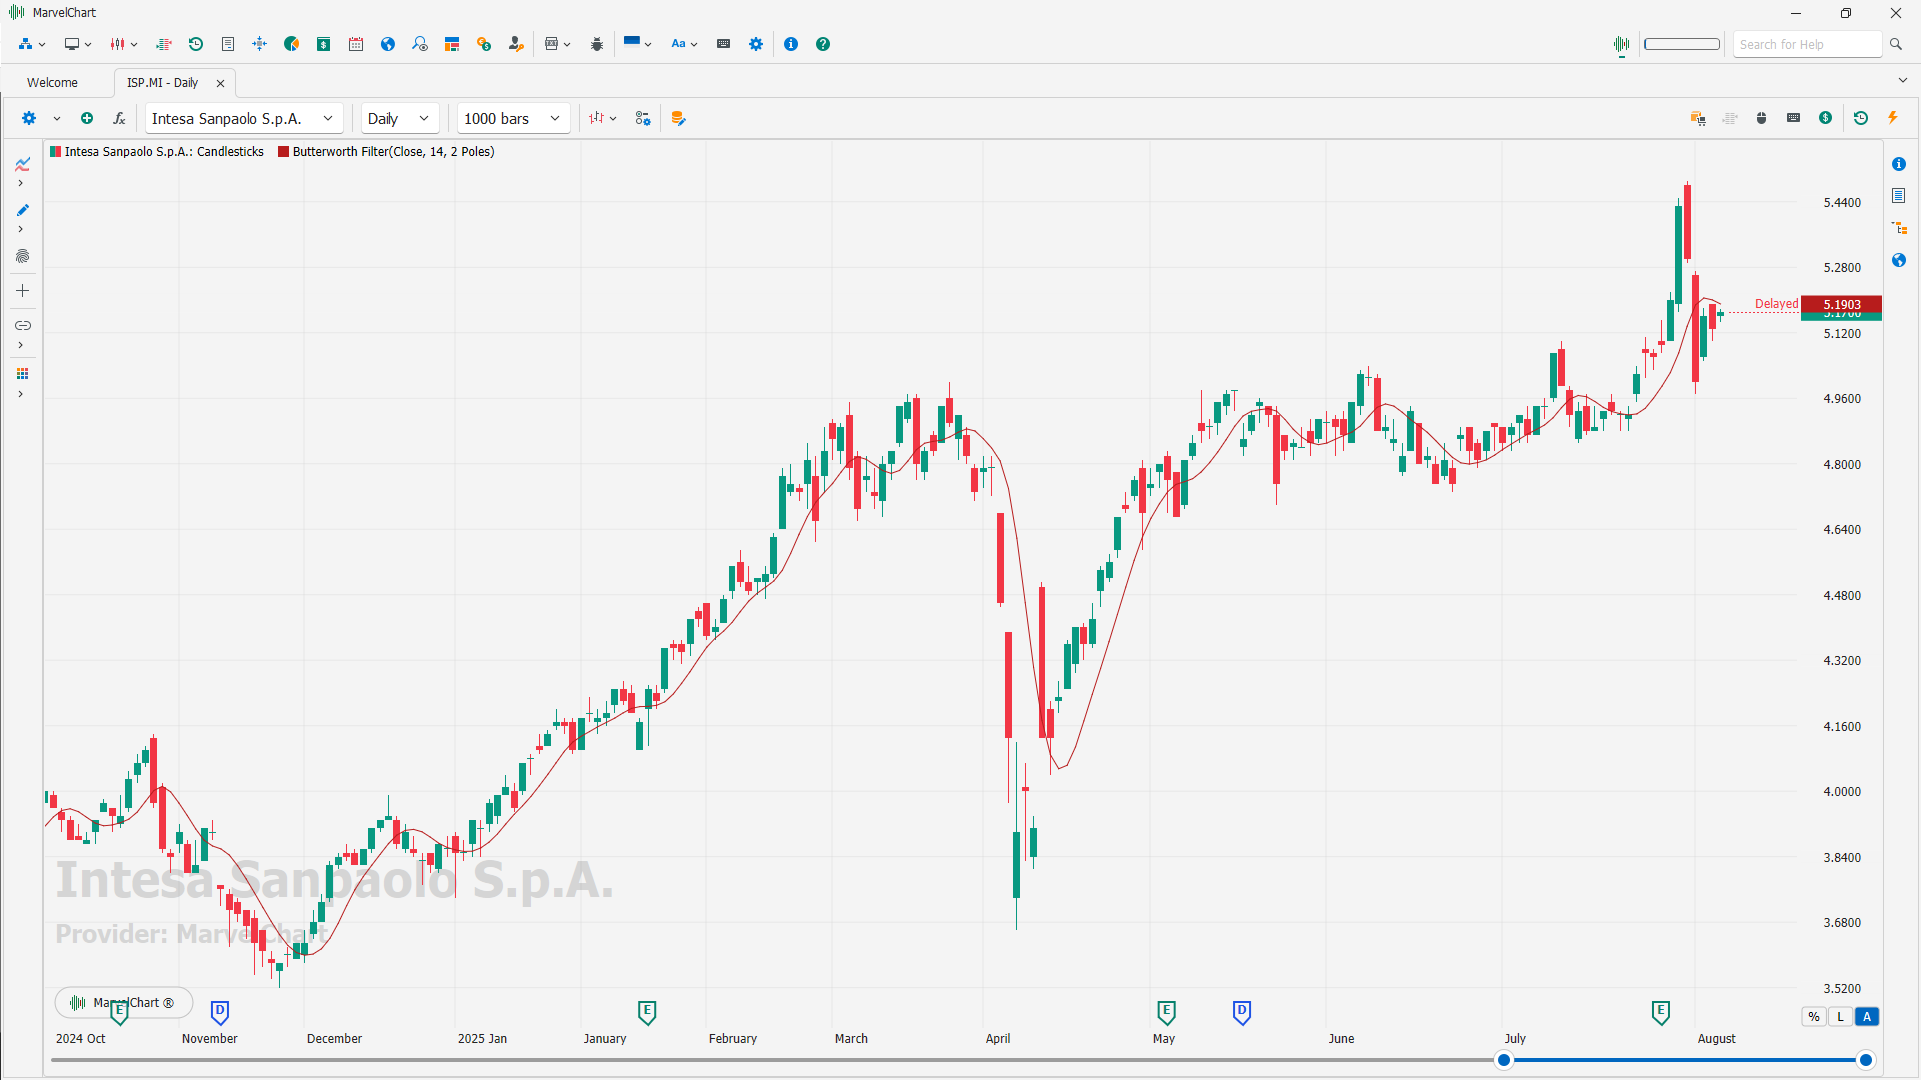
A Butterworth filter indicator is a tool used in technical analysis to smooth price data and reduce noise, allowing traders to better identify underlying trends. It's a type of digital filter known for its maximally flat frequency response, meaning it minimizes distortion within the passband. In essence, it helps traders focus on the dominant trend by filtering out short-term fluctuations and price "whipsaws".
Key aspects of a Butterworth filter indicator
Smoothing
The filter works by reducing the impact of rapid price changes, making the data appear smoother and potentially revealing underlying trends more clearly.
Noise Reduction
It minimizes the influence of random price fluctuations (noise) that can obscure the true market direction.
Trend Identification
By smoothing the data, the indicator helps traders identify the direction of the overall trend (upward or downward).
Lag
Like all filters, the Butterworth filter introduces some lag, meaning there will be a delay between a price change and the corresponding change in the indicator's value.
Two Pole vs. Three Pole
A Two Pole Butterworth filter is generally considered a good balance between smoothing and responsiveness, while a Three Pole filter provides greater smoothing at the cost of increased lag.
Example of usage
A Butterworth filter can be applied to price data (e.g., closing prices) to create a smoothed price series.
This smoothed series can then be used as a basis for further analysis, such as identifying buy and sell signals based on its relationship with the original price data or other indicators.
Summary
External Chart
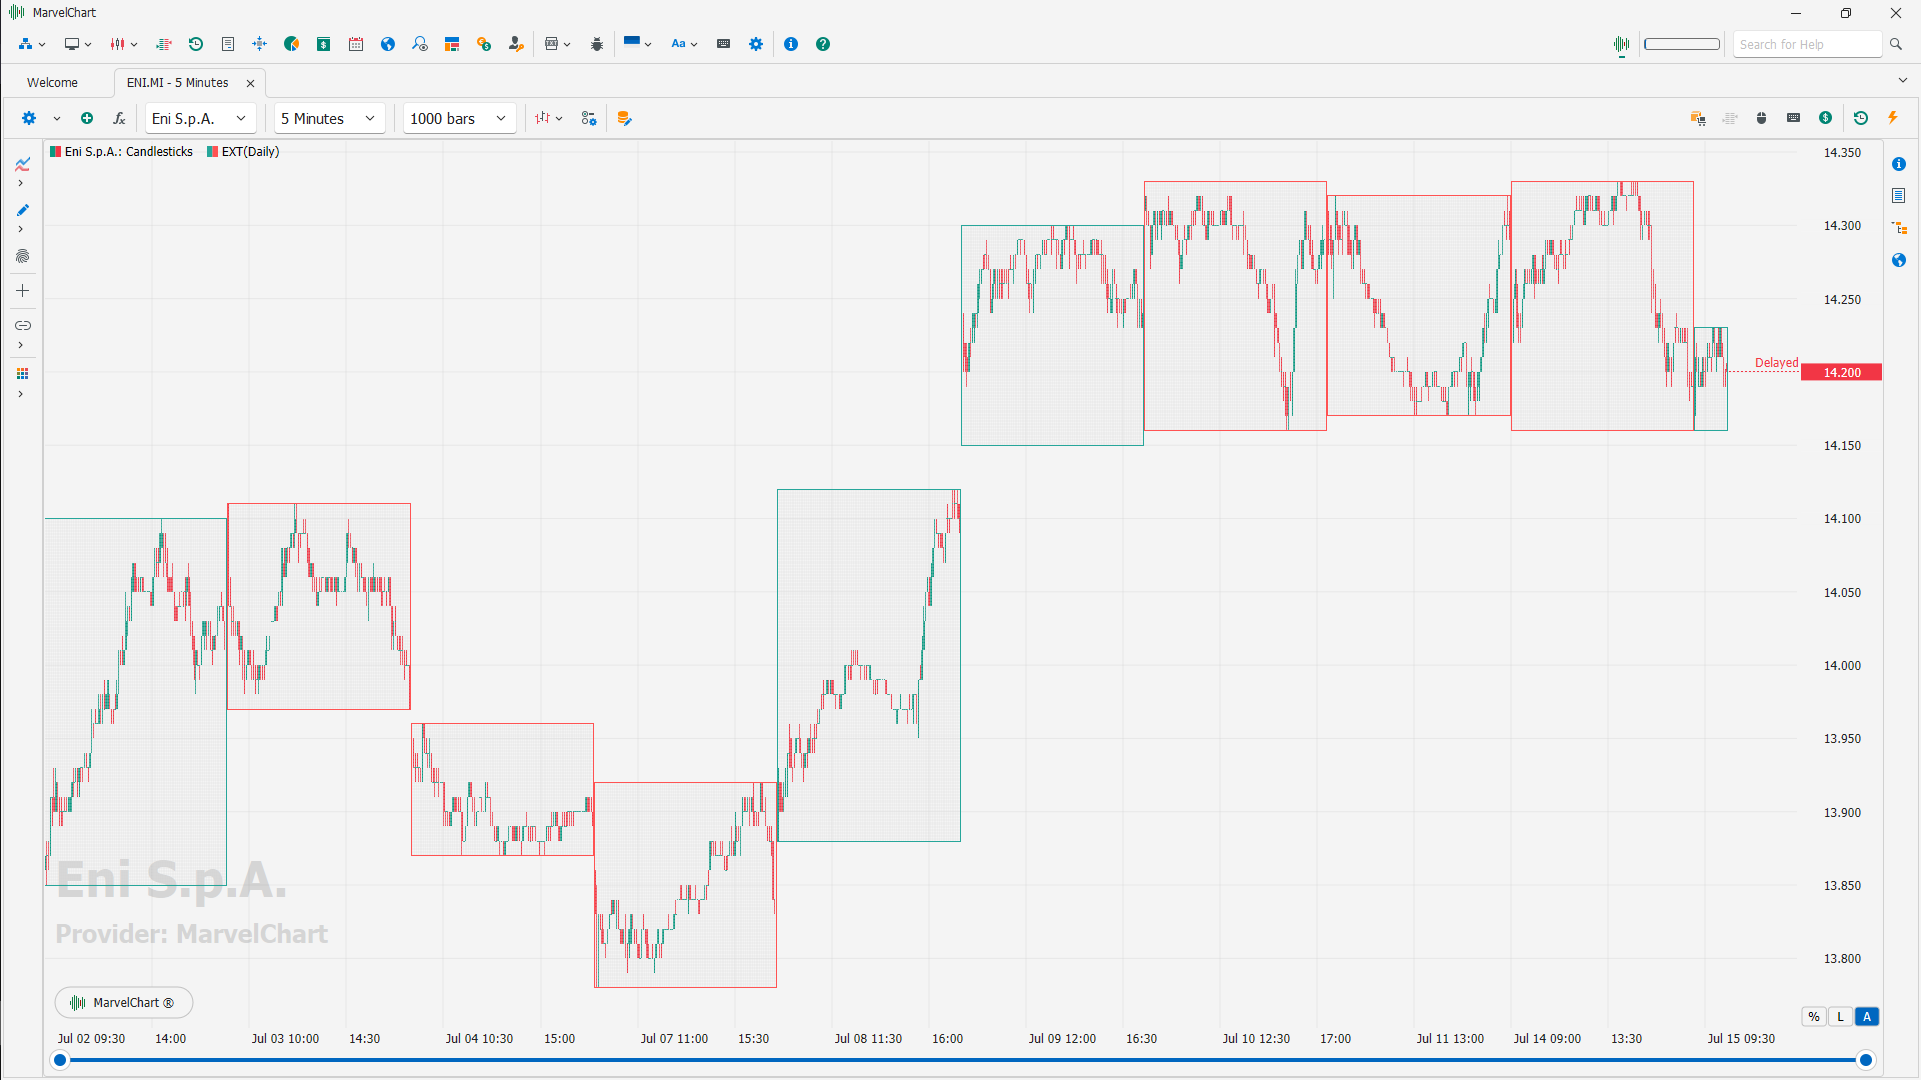
The External Chart indicator combines a sequence of historical bars into a bigger time-frame.
Gaussian Filter
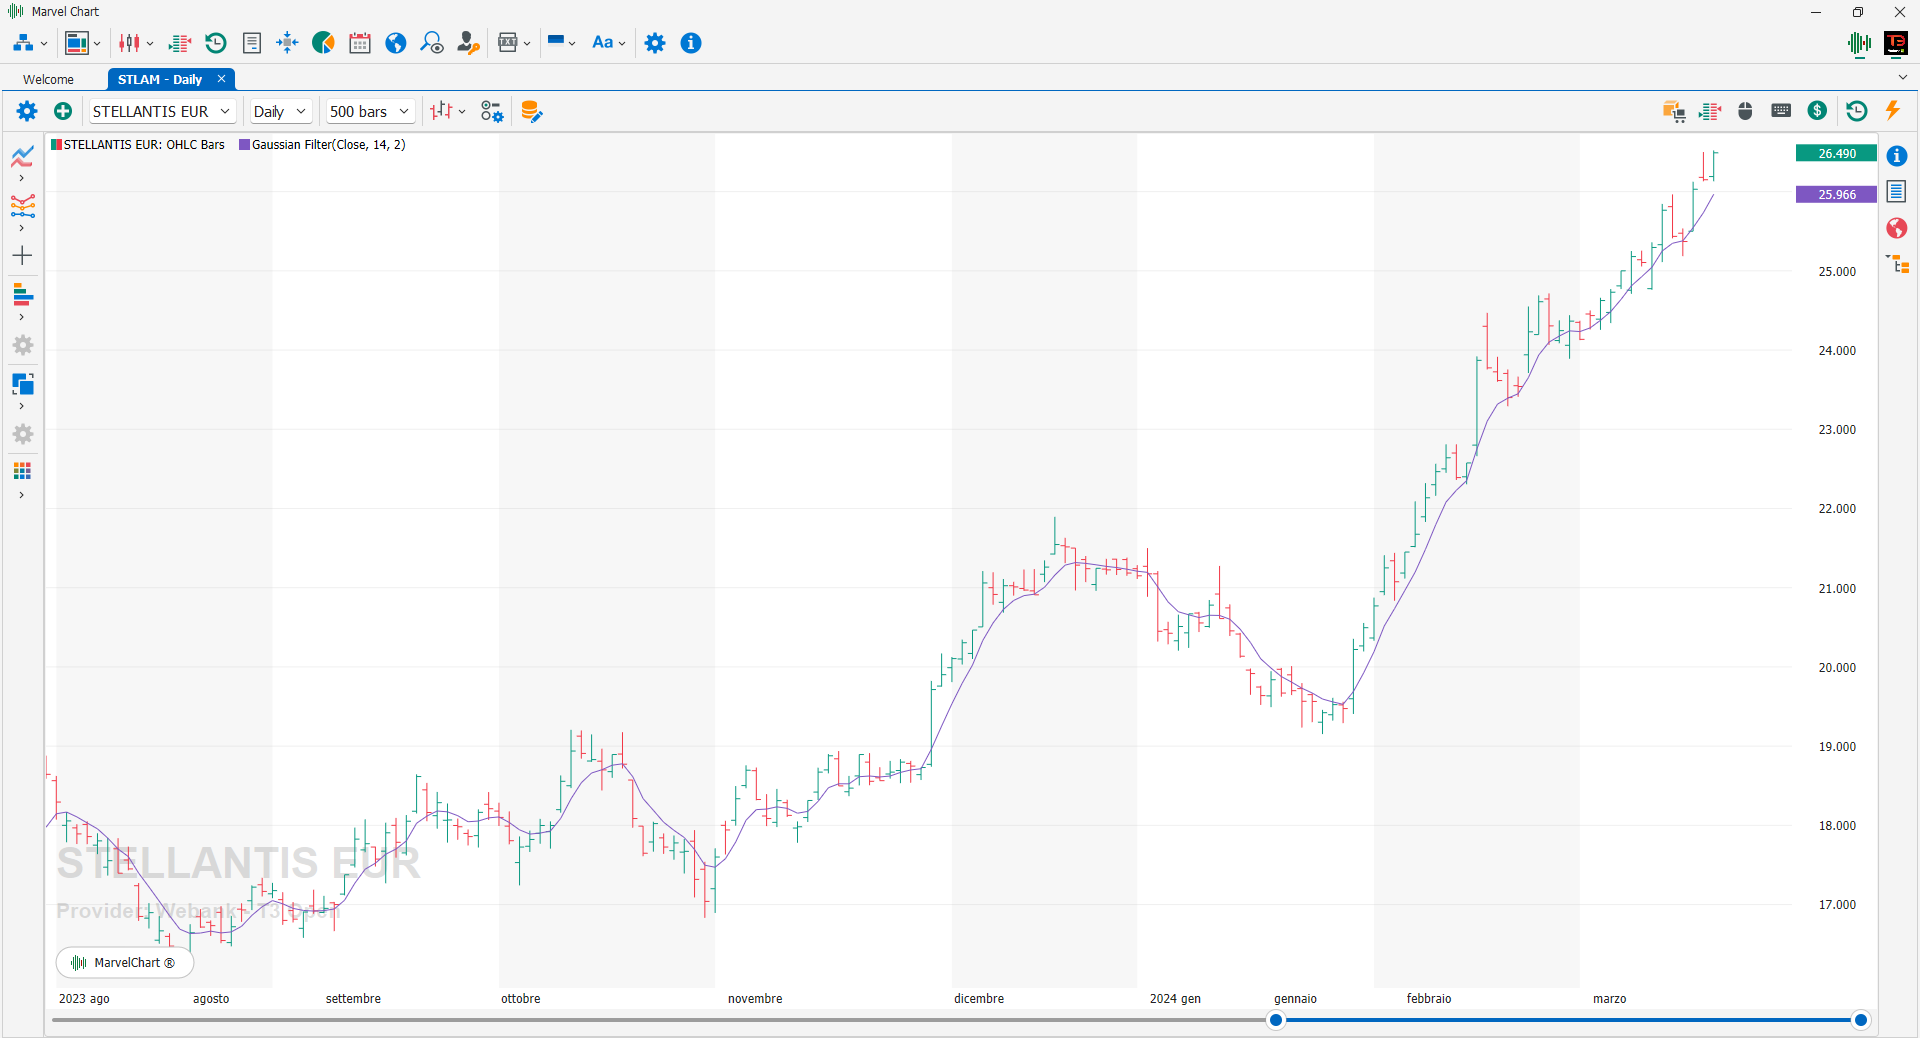
The Gaussian Filter is an indicator that, through the Gaussian function, provides a filter within a trend. In practice, using the Gaussian Filter, it is possible to eliminate disturbances (false signals) within a defined trend. Since it is only a filter, it enters into each use accompanied by another trend indicator.
Instantaneous TrendLine

The Instantaneous TrendLine indicator, developed by John Ehlers, is a technical analysis tool designed to provide a smoother, more responsive representation of price trends compared to traditional moving averages. It utilizes digital signal processing techniques to minimize lag and quickly adapt to changing market conditions.
Core Function
Smooth Trend Representation
The indicator aims to smooth out price fluctuations, providing a clearer picture of the underlying trend direction.
Lag Reduction
Unlike traditional moving averages that can lag behind price movements, the Instantaneous TrendLine is designed to react more quickly to changes in price.
Trend Following
The indicator is primarily used for identifying and following trends, helping traders determine the direction of the market.
Digital Signal Processing
Ehlers applies concepts from digital signal processing to calculate the trend line, enabling faster response times and reduced noise.
Summary
In essence, the Instantaneous Trendline is a tool for:
Identifying the direction of the trend.
Finding potential entry and exit points based on trend changes.
Adapting to changing market conditions with its responsive nature.
It's important to remember that no indicator is perfect, and the Instantaneous TrendLine should be used in conjunction with other forms of analysis and risk management strategies.
Kijun-Sen
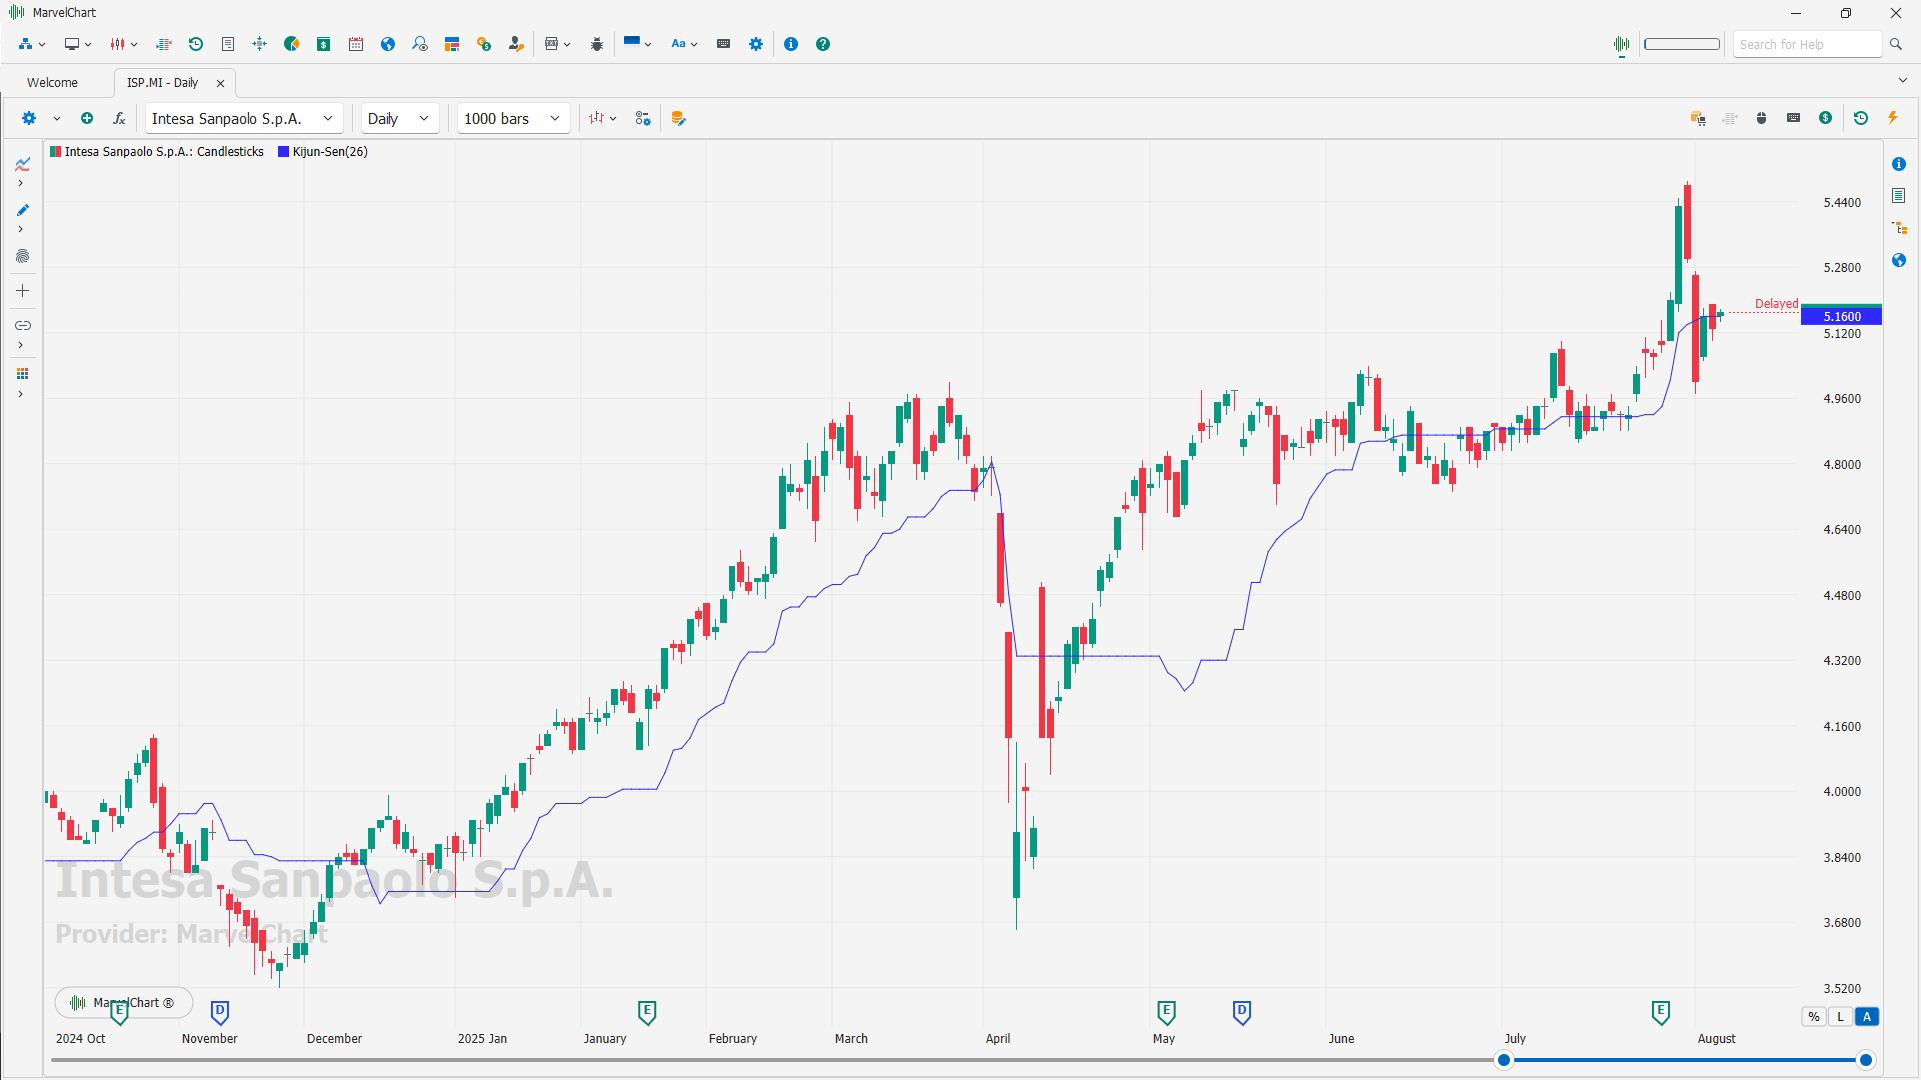
The Kijun-Sen, commonly referred to as the Base Line, is a pivotal element of the Ichimoku Kinko Hyo trading system.
Computed by averaging the highest high and the lowest low for a particular period, typically the past 26 periods, it is designed to represent the midpoint of a market's price range, thereby offering insight into potential future price movement.
It is highly valued for its capabilities in trend identification, dynamic support and resistance levels establishment, and generation of entry and exit signals.
However, the Base Line is not infallible. Its effectiveness may diminish in strong trending markets due to lagging signals or in range-bound markets due to false signals.
Consequently, for optimal use, the Base Line should be employed in conjunction with other technical analysis tools as part of a broader, well-considered trading strategy.
The Tenkan-Sen indicator is calculated exactly in the same way, except for the default number of periods, which is 9 in that case.
Laguerre Filter

The Laguerre filter is a technical analysis indicator used to smooth price data and identify trends. It's designed to reduce market noise and highlight the underlying trend by assigning more weight to recent price data. This makes the filter responsive to price movements while minimizing the impact of short-term fluctuations.
How it works
The Laguerre filter uses Laguerre polynomials, a mathematical concept, to transform price data into a smoother line.
It assigns weights to past price points, with more recent prices having a greater influence.
This weighting mechanism helps to reduce noise and highlight the overall trend.
The filter adapts to market conditions, tracking trends more closely during trending periods and becoming slower during ranging periods.
Key features
Smoothing: Reduces market noise and choppy price action.
Trend Identification: Helps identify the direction of the overall trend.
Responsiveness: Reacts to price changes quickly, making it useful for identifying potential trading opportunities.
Lag Reduction: Designed to minimize the lag associated with traditional moving averages.
How it's used
Trend Following
Traders use the Laguerre filter to identify and follow the prevailing trend.
Signal Generation
Buy and sell signals can be generated when the filter line crosses certain levels or when it crosses the price line.
Baseline Indicator
The Laguerre filter can be used as a baseline indicator, with buy signals generated when price crosses above and sell signals when it crosses below.
Confirmation Indicator
It can be used in conjunction with other indicators to confirm trading signals.
Important Considerations
No Single Indicator: The Laguerre filter, like any indicator, should not be used in isolation.
Parameter Tuning: The gamma parameter, which controls the smoothing factor, needs to be adjusted based on market conditions and timeframes.
Risk Management: Appropriate risk management strategies should be employed when using the Laguerre filter.
McGinley Dynamic
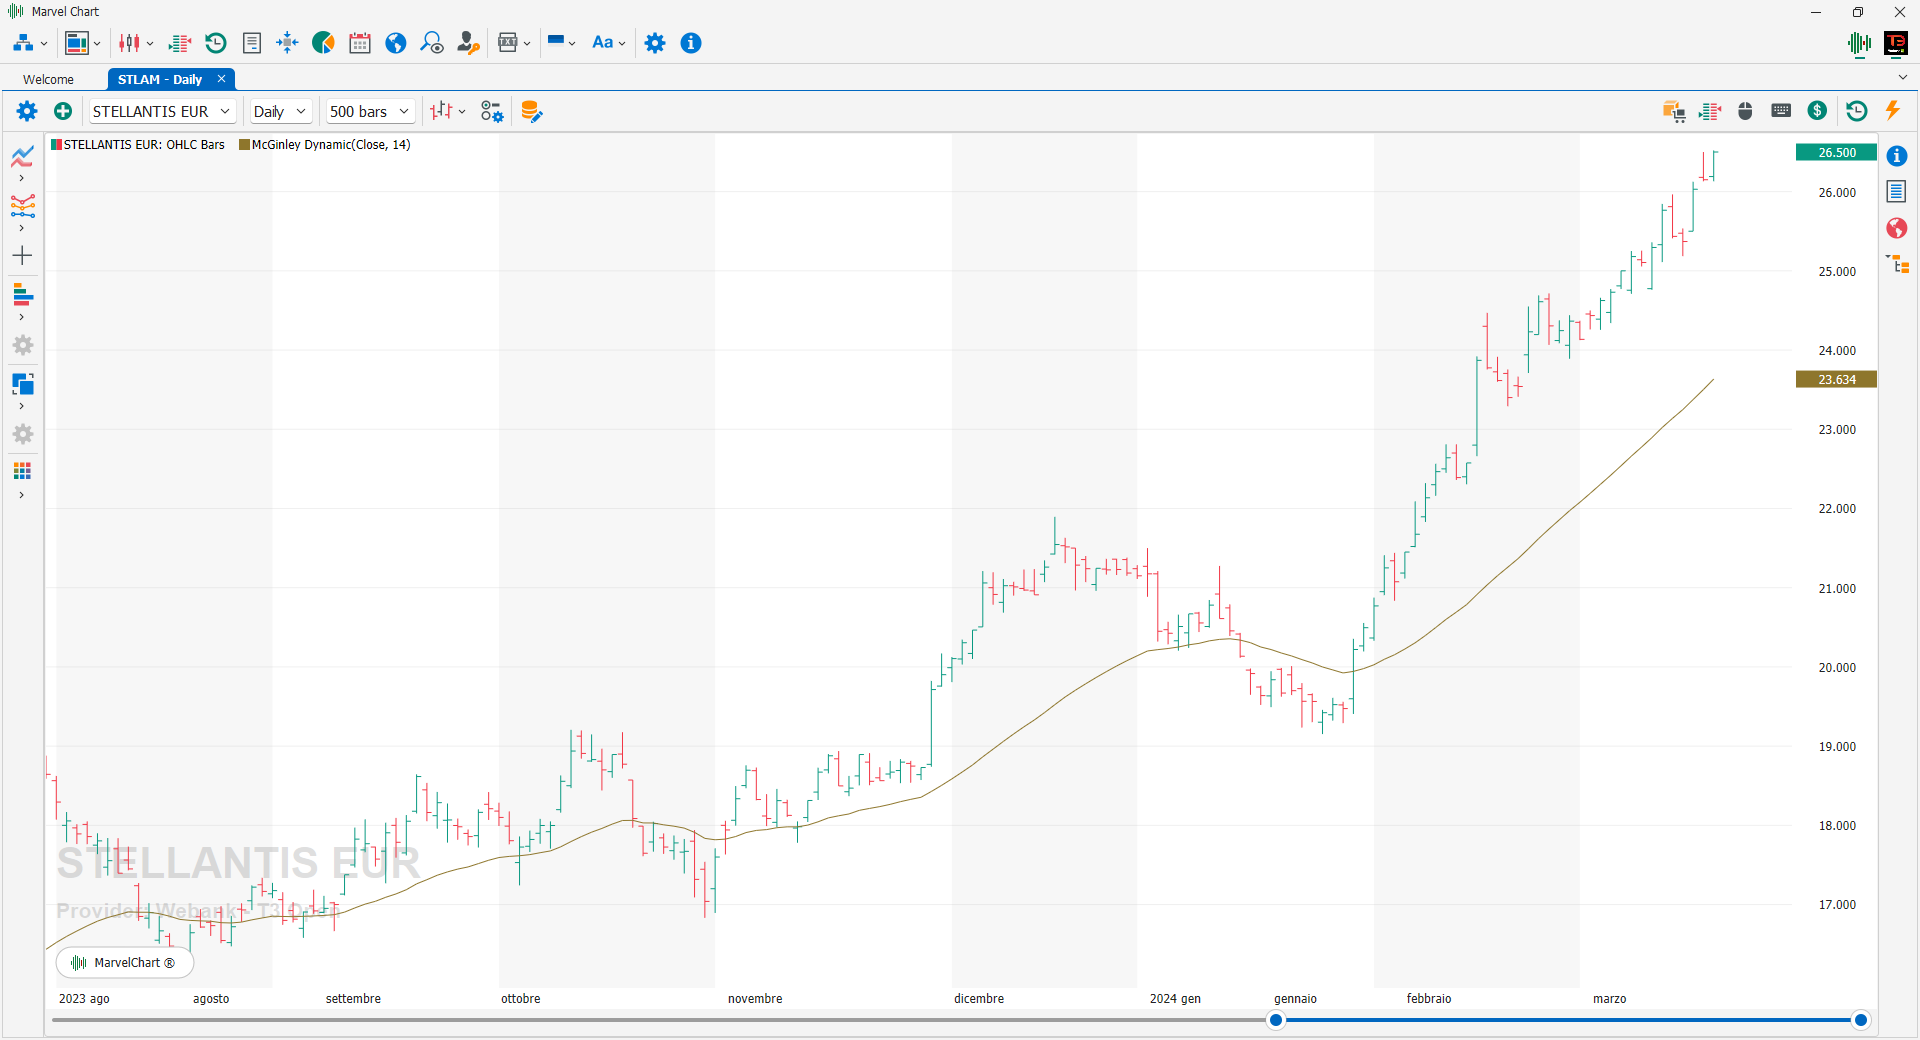
The McGinley Dynamic Moving Average (MDMA) is a technical analysis indicator designed by trader John R. McGinley in 1990. It is a unique moving average designed to be more responsive to price movements than traditional moving averages. Unlike other moving averages, the MDMA adjusts its speed based on market volatility, which helps reduce lag and provide more accurate signals. The MDMA was developed as a tool for traders to identify trends and potential trading opportunities more effectively. The importance of the MDMA lies in its ability to provide a smoother and more accurate representation of price movements, which can help traders make more informed trading decisions. Over the years, MDMA has gained popularity among traders and is now widely used in various financial markets, including stocks, futures, and forex. The McGinley Dynamic Moving Average (MDMA) can be used in trading to identify potential entry and exit points with greater accuracy. One way to use MDMA is to take advantage of its ability to reduce the delay in identifying trends by entering a long position when the price rises above the MDMA and exiting the position when the price falls below the MDMA. Traders can also combine MDMA with other indicators, such as the Relative Strength Index (RSI) or Moving Average Convergence Divergence (MACD), to confirm signals. Additionally, MDMA can help traders with risk management techniques, such as placing stop-loss orders below the MDMA in a long position or above the MDMA in a short position to limit potential losses.
Parabolic SAR
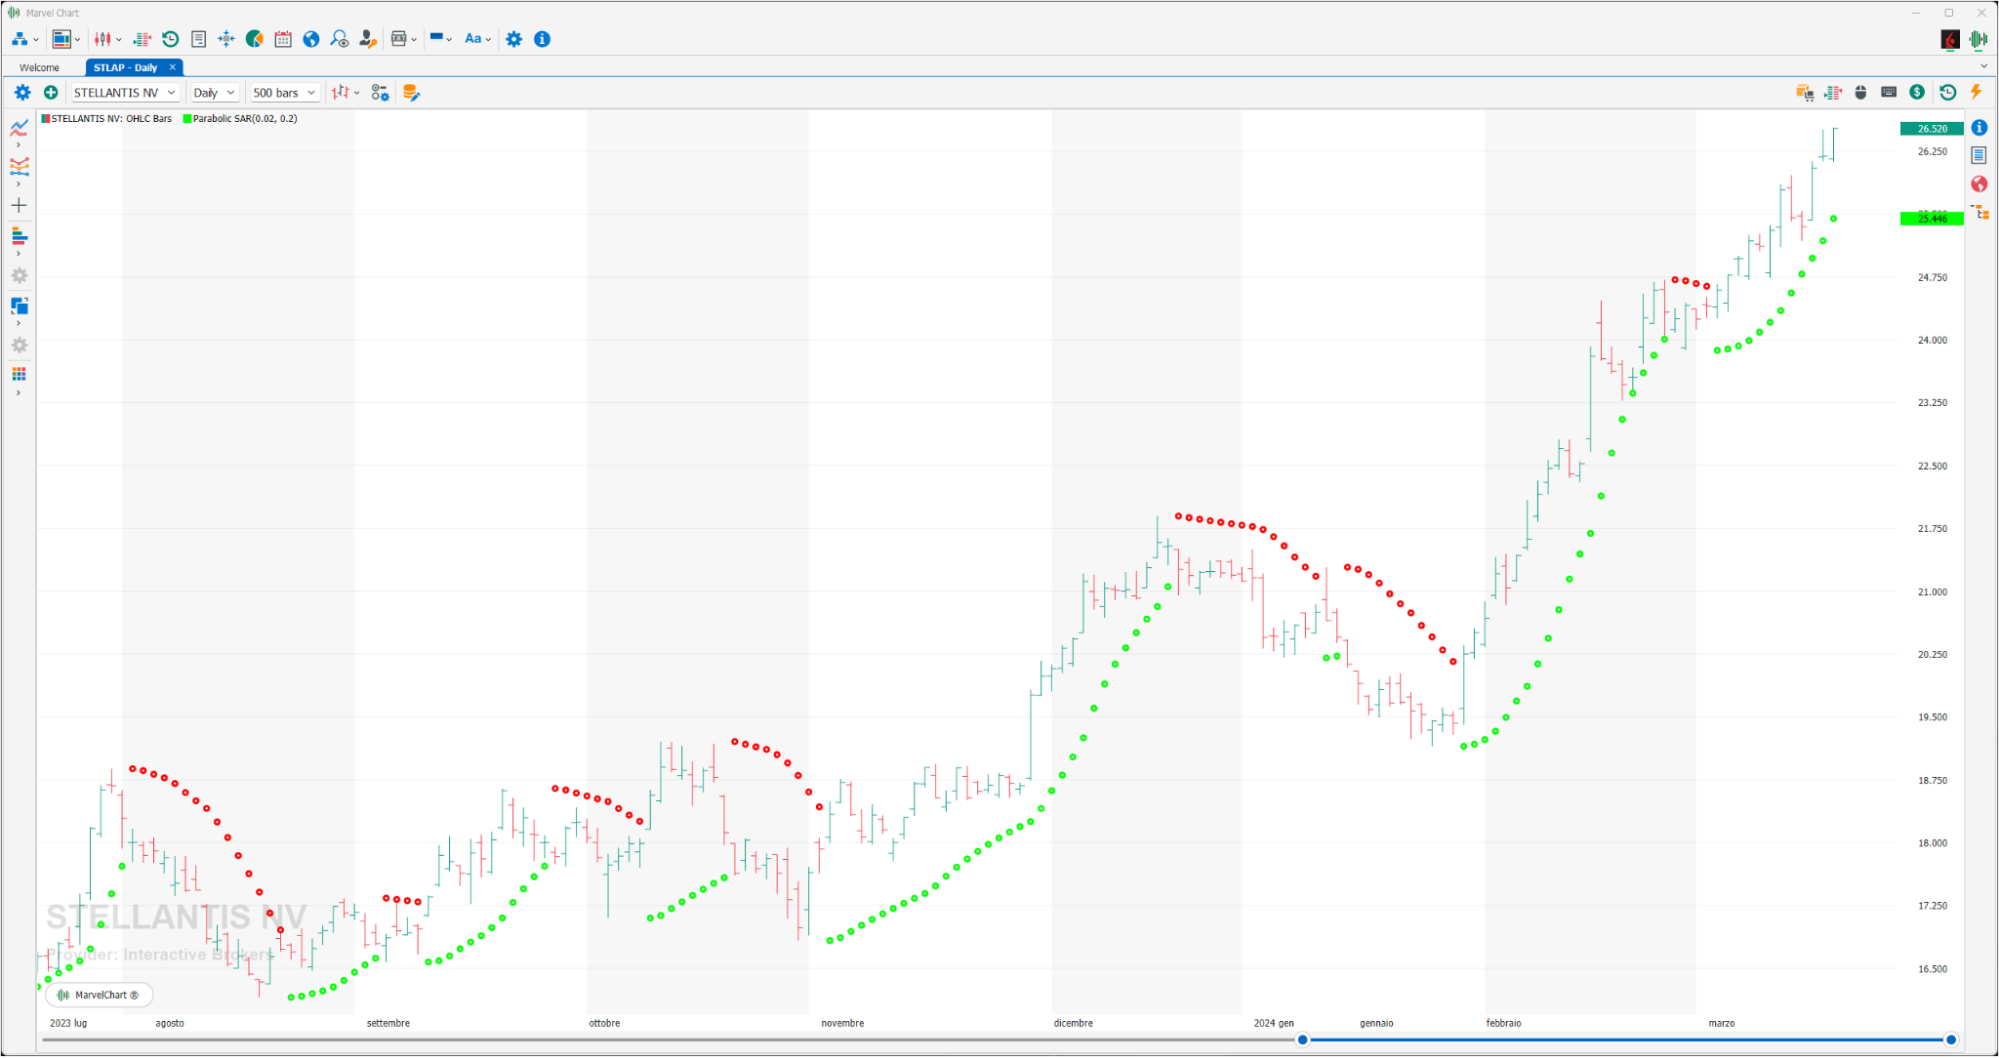
The Parabolic SAR is an indicator created by Welles Wilder in 1978. In its original formulation it is a stop and reverse system, so it is always on the market, and for this reason it is called Parabolic SAR, where SAR indicates Stop and Reverse. The Parabolic SAR produces a curve that resembles a section of a parabola and which is normally found below the price bars in a long trend and vice versa in a short trend. This curve represents a trailing stop level: when it is touched, the position on the market must be closed and reversed. The peculiarity of the calculation is that it contains an acceleration factor that brings the curve ever closer to the price when there are new highs or new lows.
Pivot High
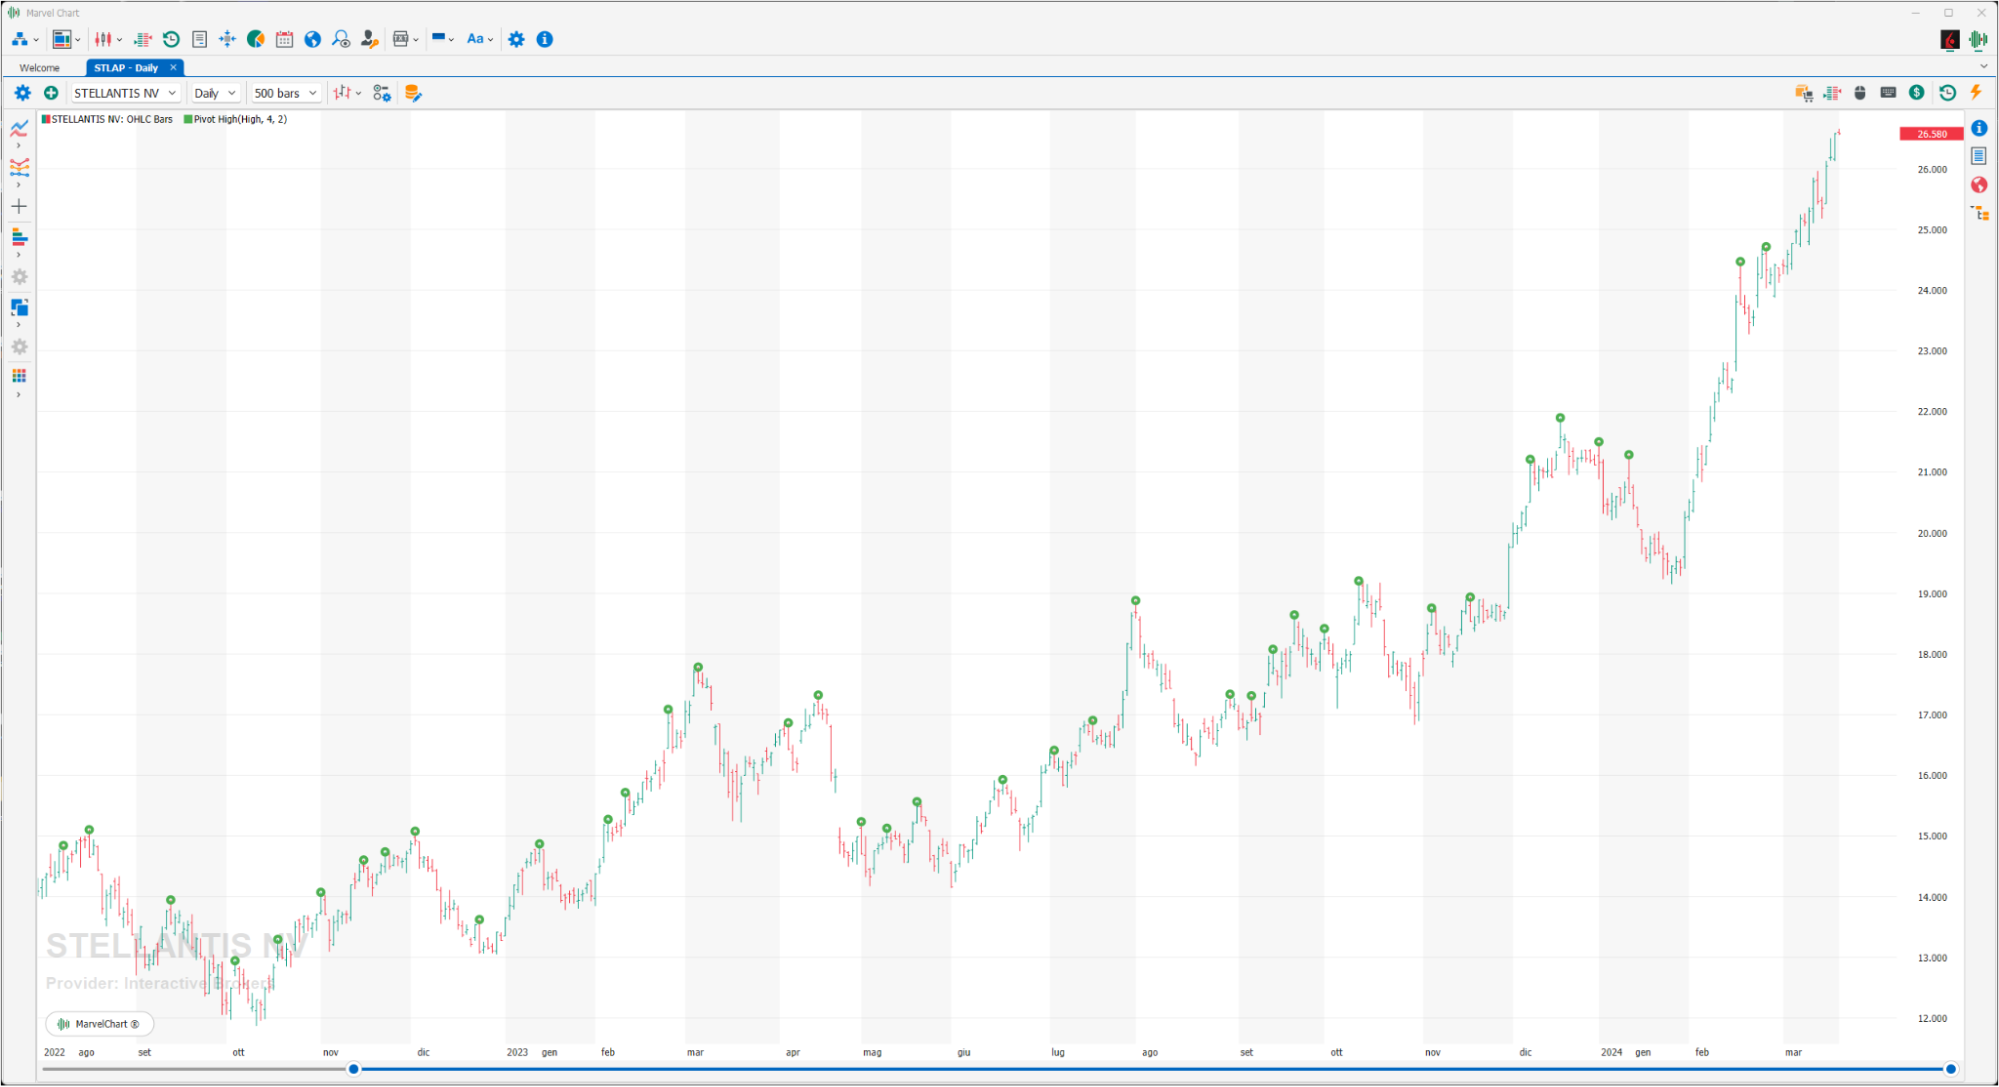
Price of the highest pivot point or "Not-a-Number" if there was no higher point than the pivot.
Pivot Low

Price of the lowest pivot point or "Not-a-Number" if there was no lower point than the pivot.
Rainbow
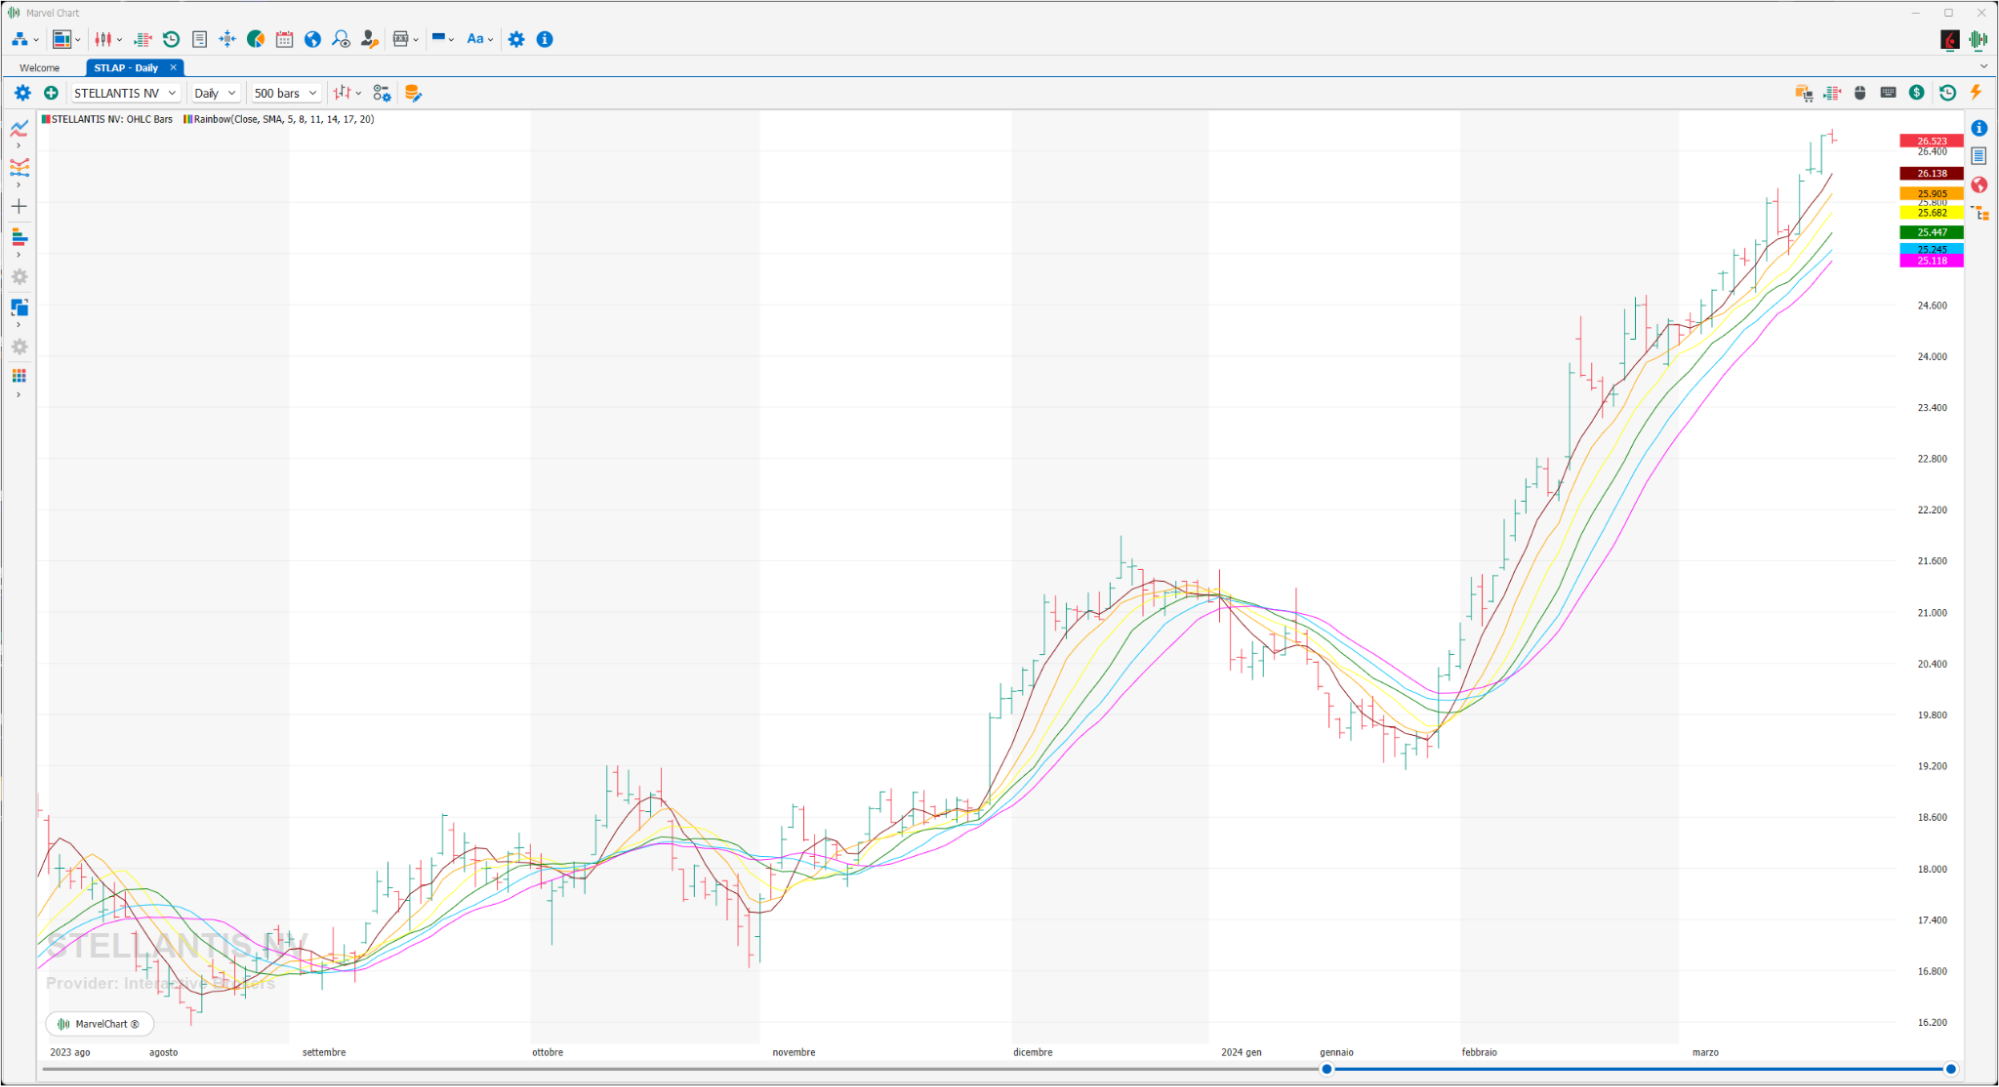
The Rainbow is an indicator that contains six Moving Averages calibrated on different periods.
Simple SuperTrend
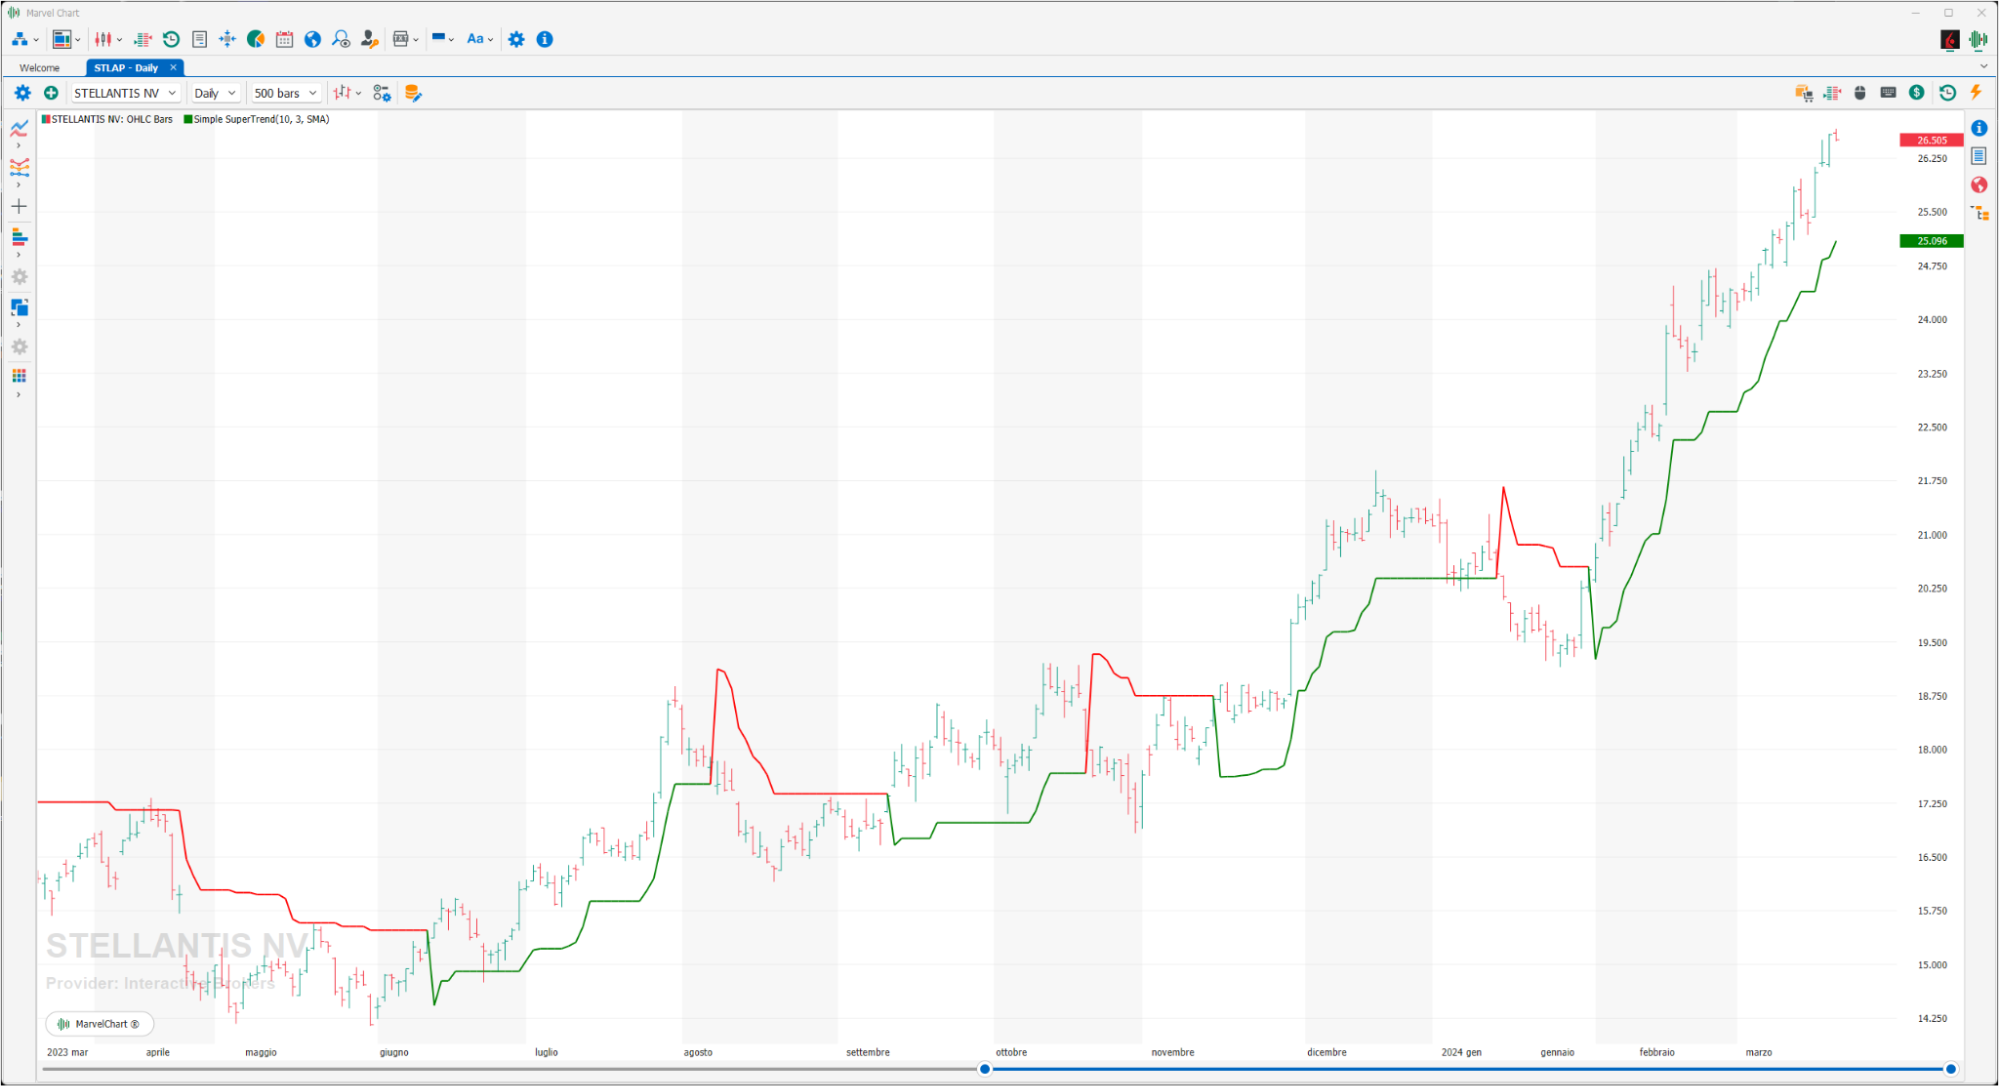
Simplified version of the SuperTrend indicator
Super Smoother Filter
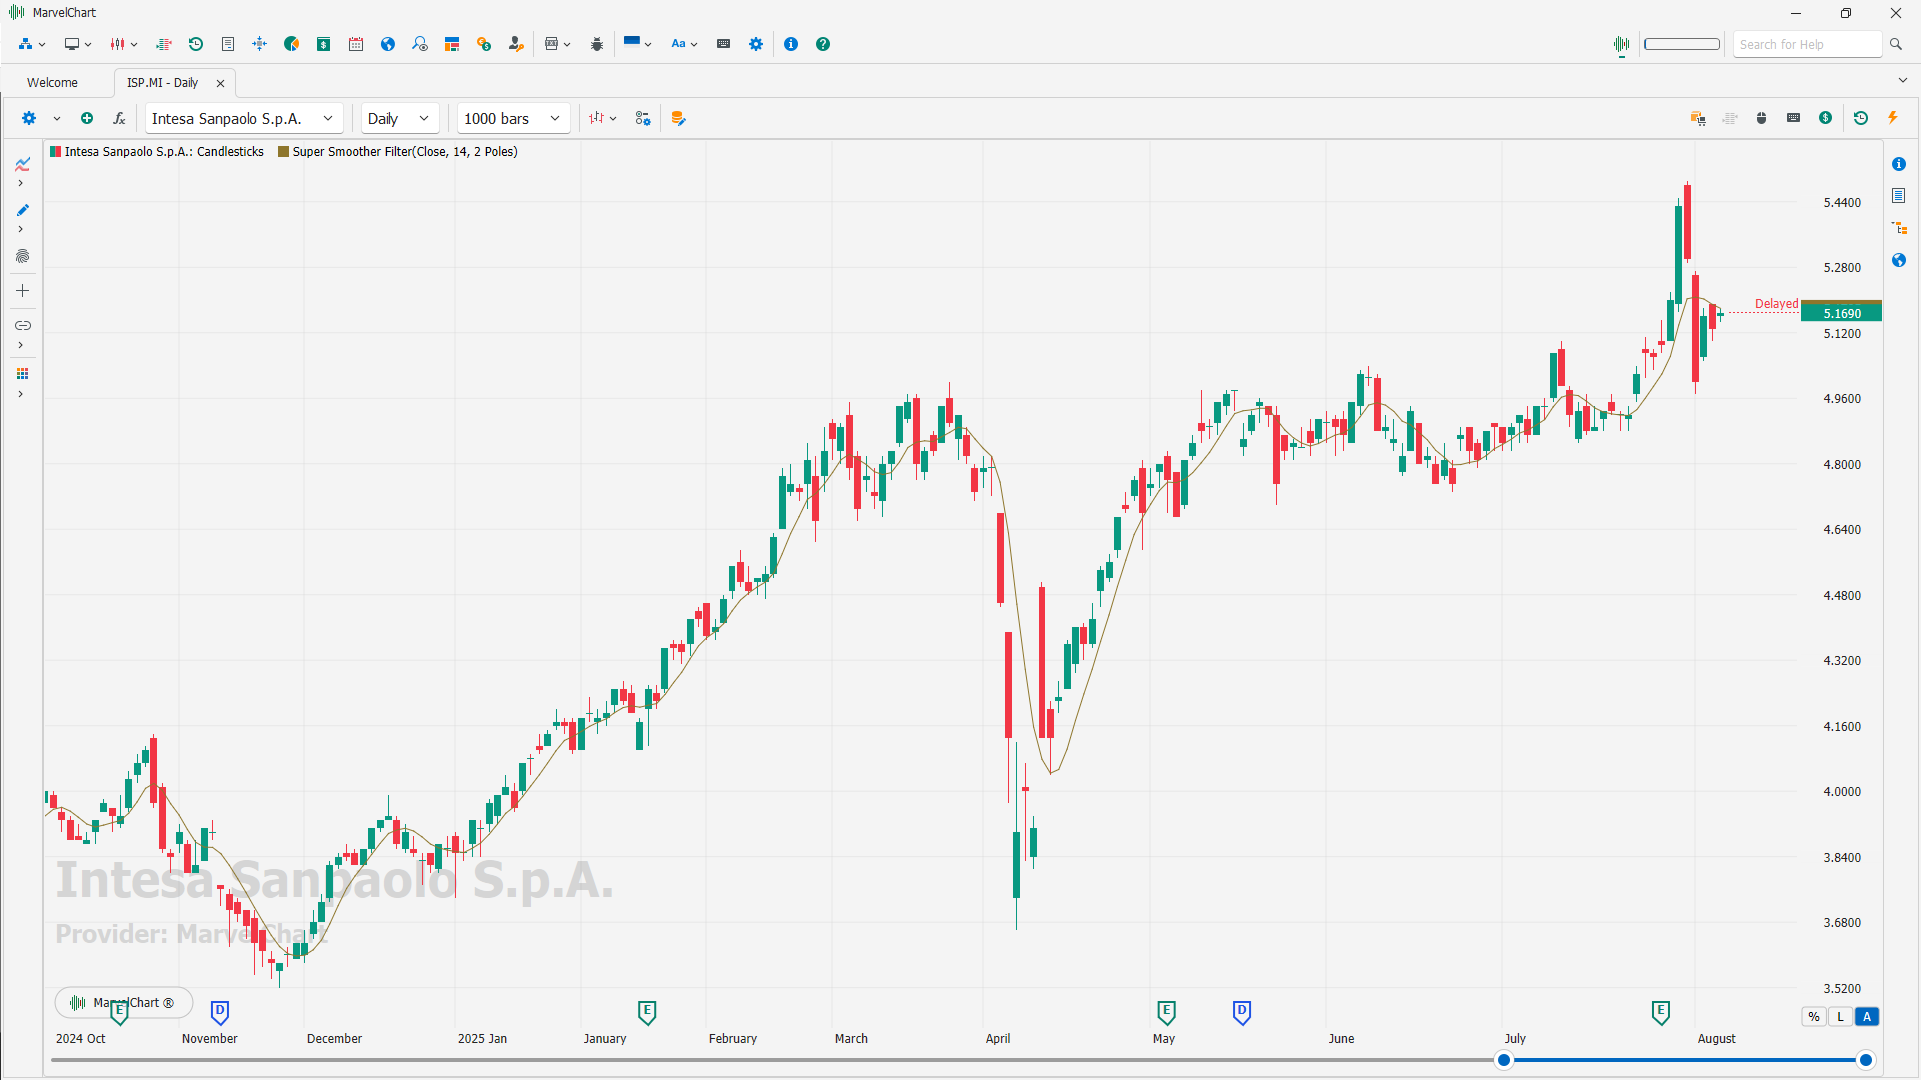
The Super Smoother filter, developed by John Ehlers, is a powerful tool in a technical analyst's arsenal, designed to provide significant smoothing of price data (or other series) with substantially less lag than traditional moving averages like the Simple Moving Average (SMA).
SuperTrend
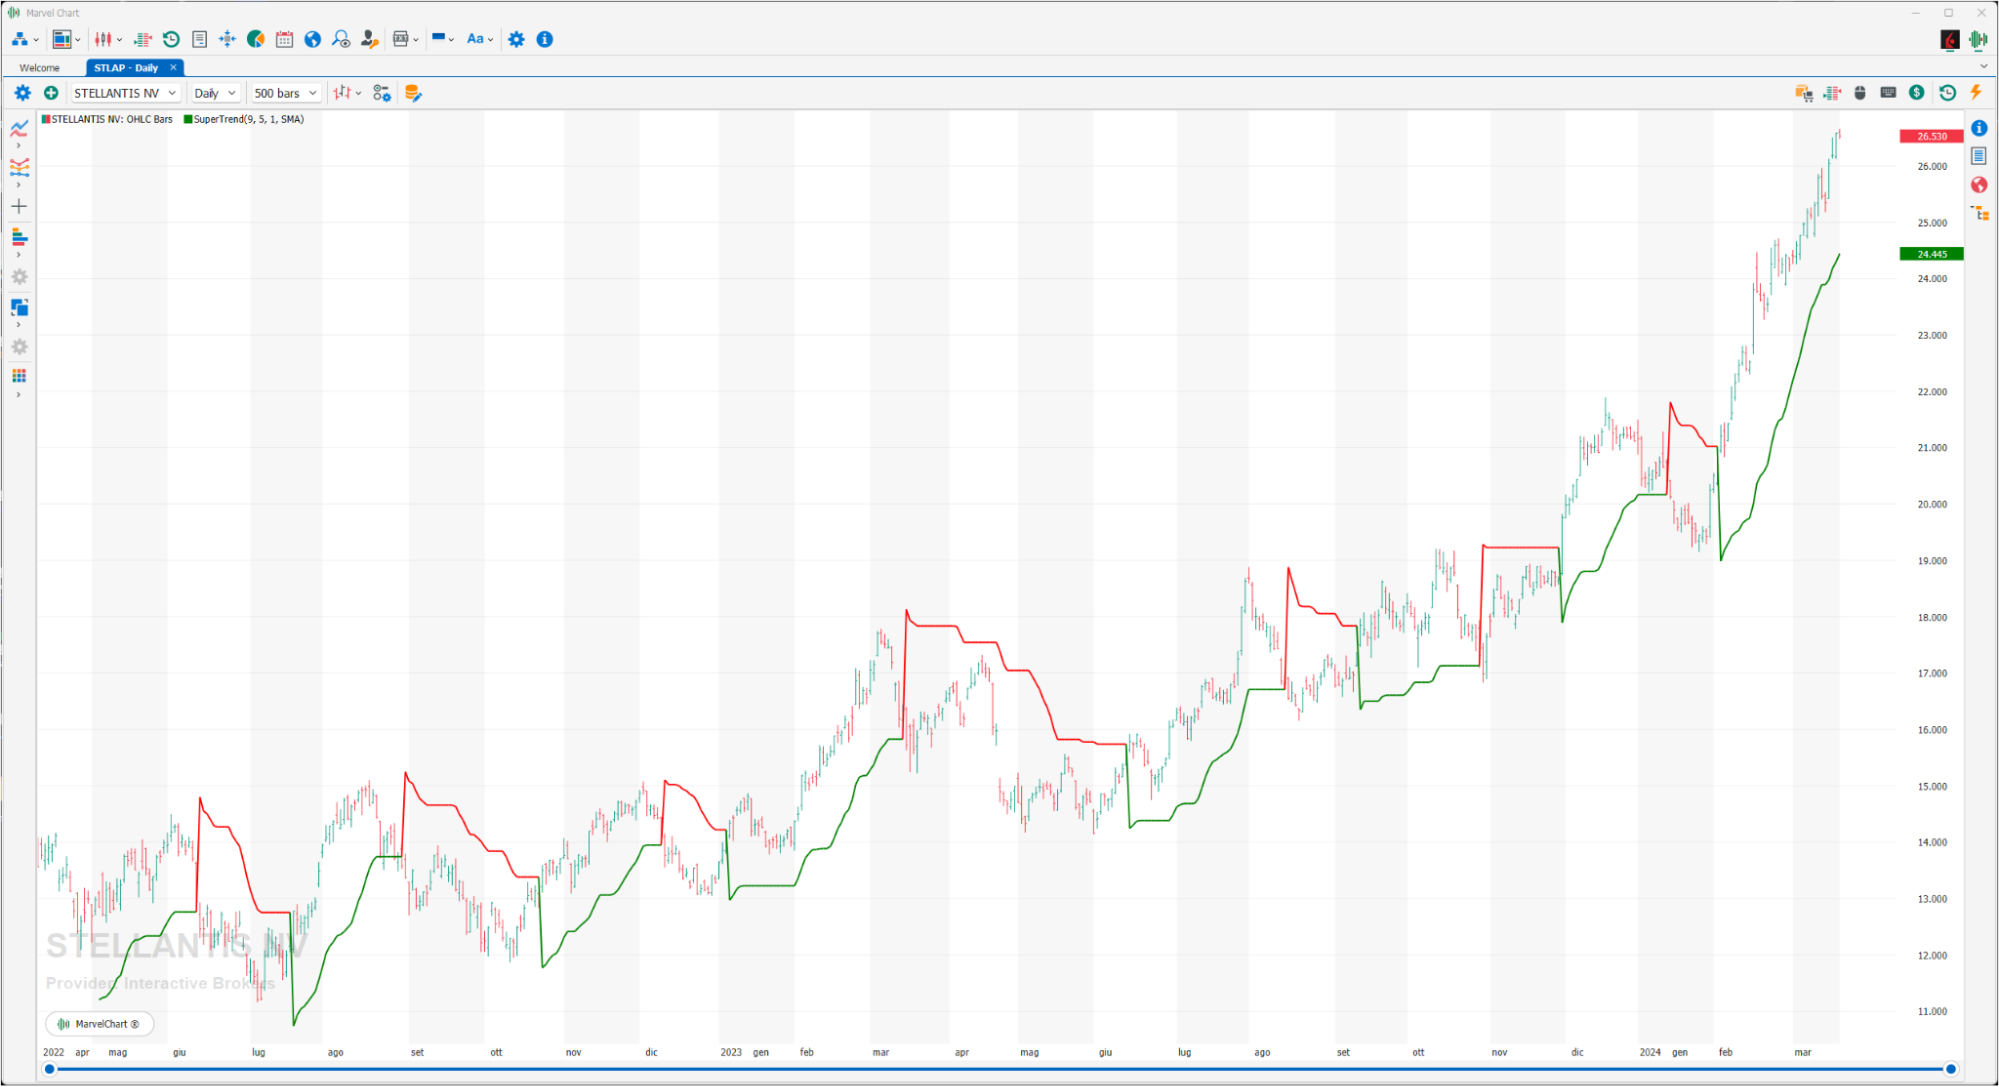
SuperTrend is an indicator created by Oliver Seban that can be applied to almost all assets. Similar in concept to the Parabolic SAR, with the added advantage of positioning itself horizontally in the trading range, thus avoiding an early exit from the market, the SuperTrend is an indicator that can be very useful for the correct exit from the market. It is very simple to interpret because it is composed of a series of points (or a line), one for each bar, under the CLOSE which indicates the start of an uptrend and a series of points (or a line), always one for each bar, above the CLOSE which gives us the indication of a downtrend, so in an intraday operation there is nothing else to do but wait for it to change position. The only drawback is that the delay in the change of direction, when the difference between the two values of the bar of the graph that produced the change occurs, will be very large, producing a significant percentage loss. The use of this indicator must be combined with other indicators that identify the failure of the trend, for example the “Price ROC”.
Swing High
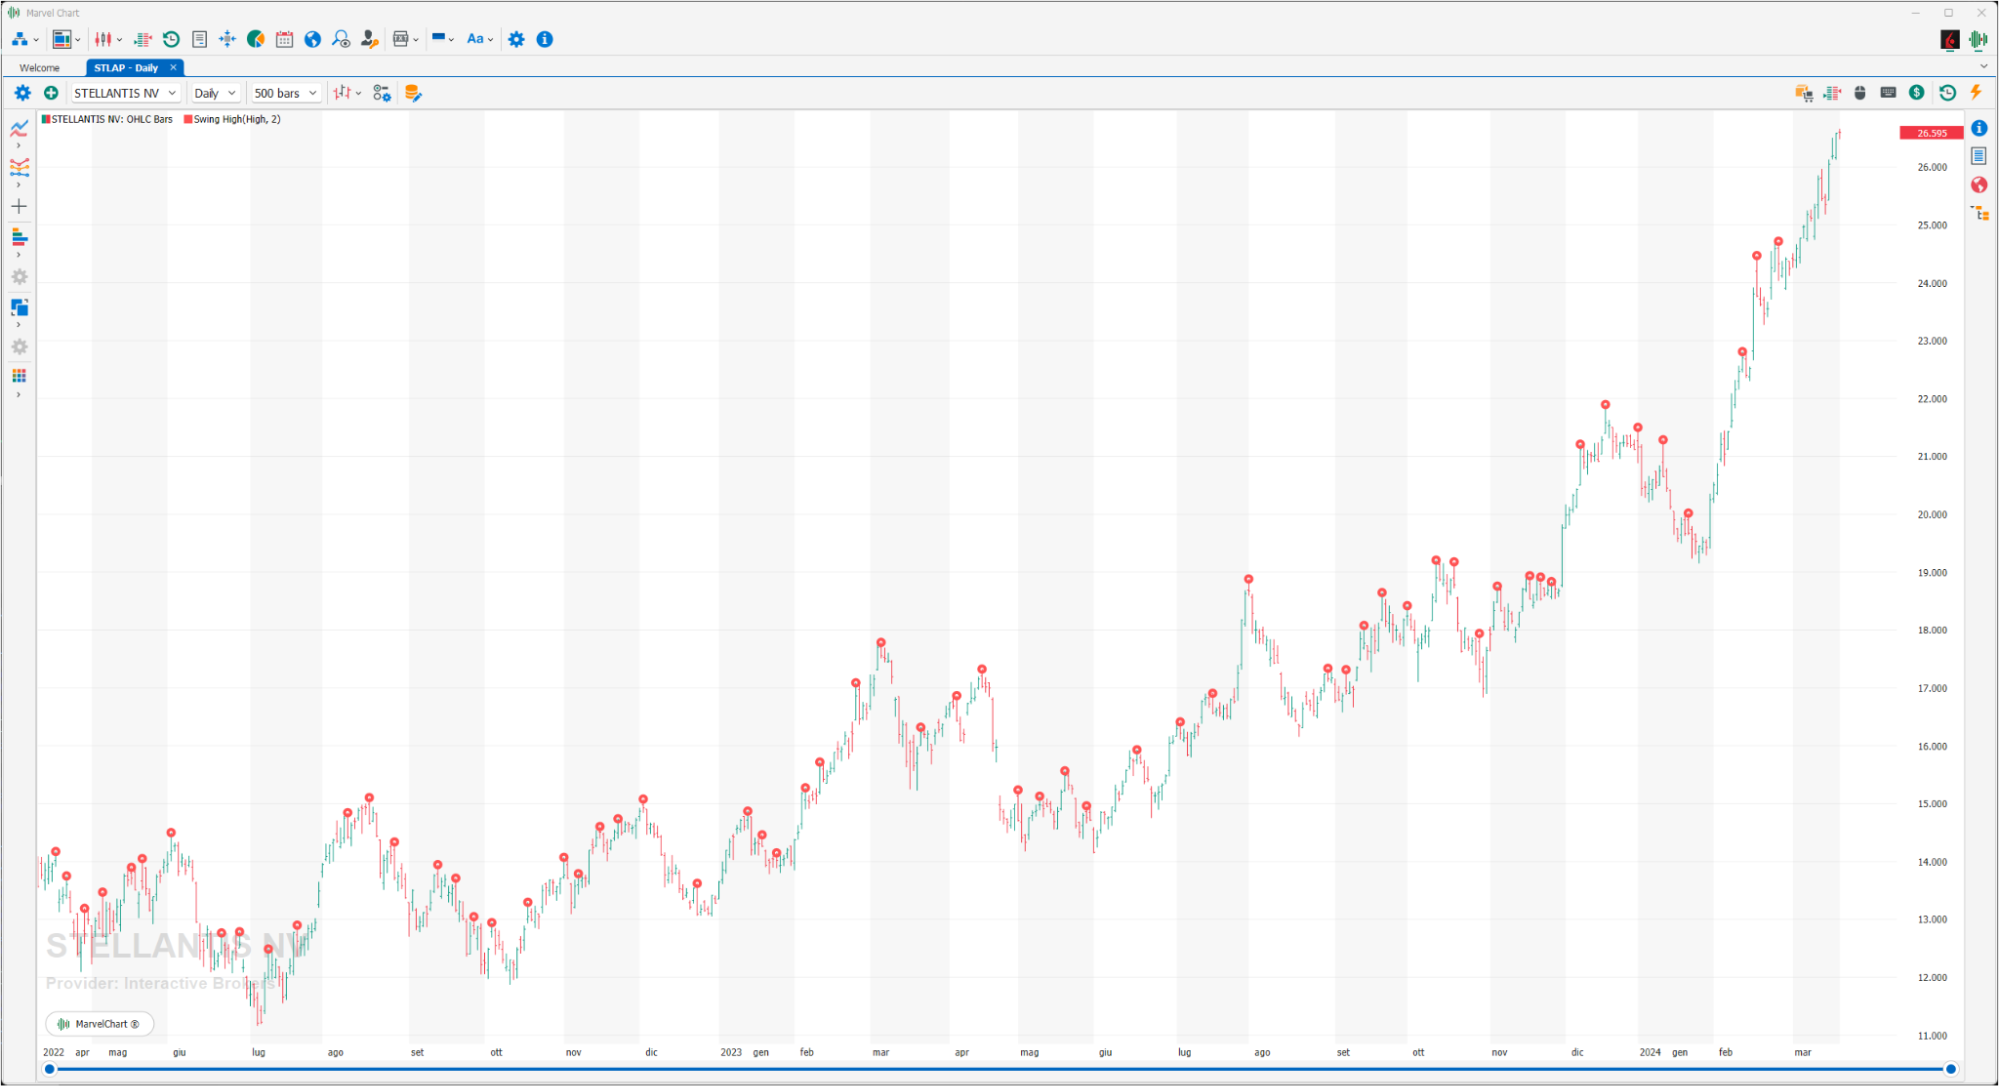
The Swing High refers to a peak reached by an indicator or by the price of a stock before a decline. A swing high is formed when the highest high reached is higher than a given number of highs positioned around it. A series of consecutively higher swing highs indicates that the security in question is in an uptrend. A swing high can occur in a sideways or trending market. Swing highs are useful to identify and use when trending, range trading, or when using technical analysis indicators. Analyzing swing highs helps a trader determine the direction and strength of a trend.
Swing Low
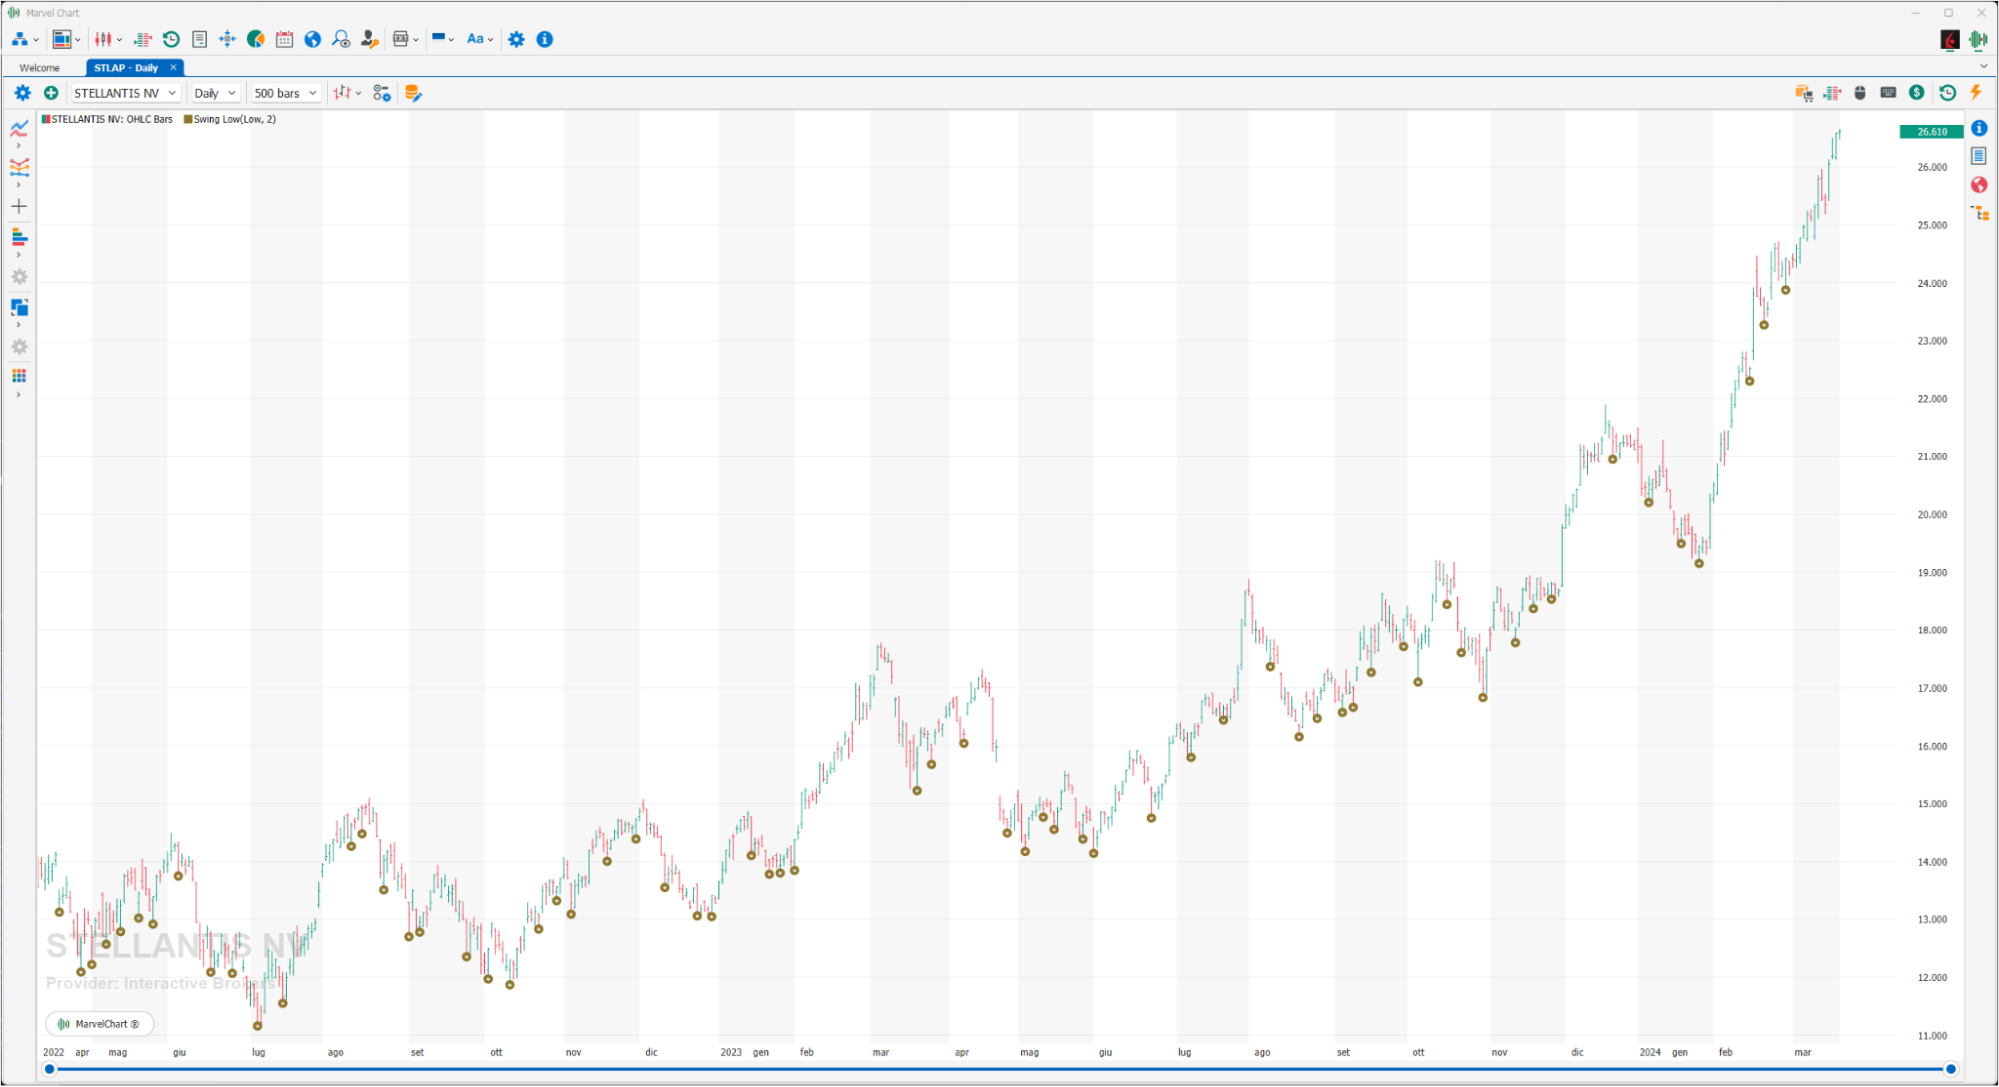
A swing low is a term used in technical analysis that refers to the lows reached by a security's price or indicator during a given period of time, usually less than 20 trading periods. A swing low is created when a low is lower than any other surrounding price during a given period of time. The opposite counterpart of a swing low is a swing high. Swing lows and swing highs are used in different ways to identify trends and ranges of volatility.
Tenkan-Sen
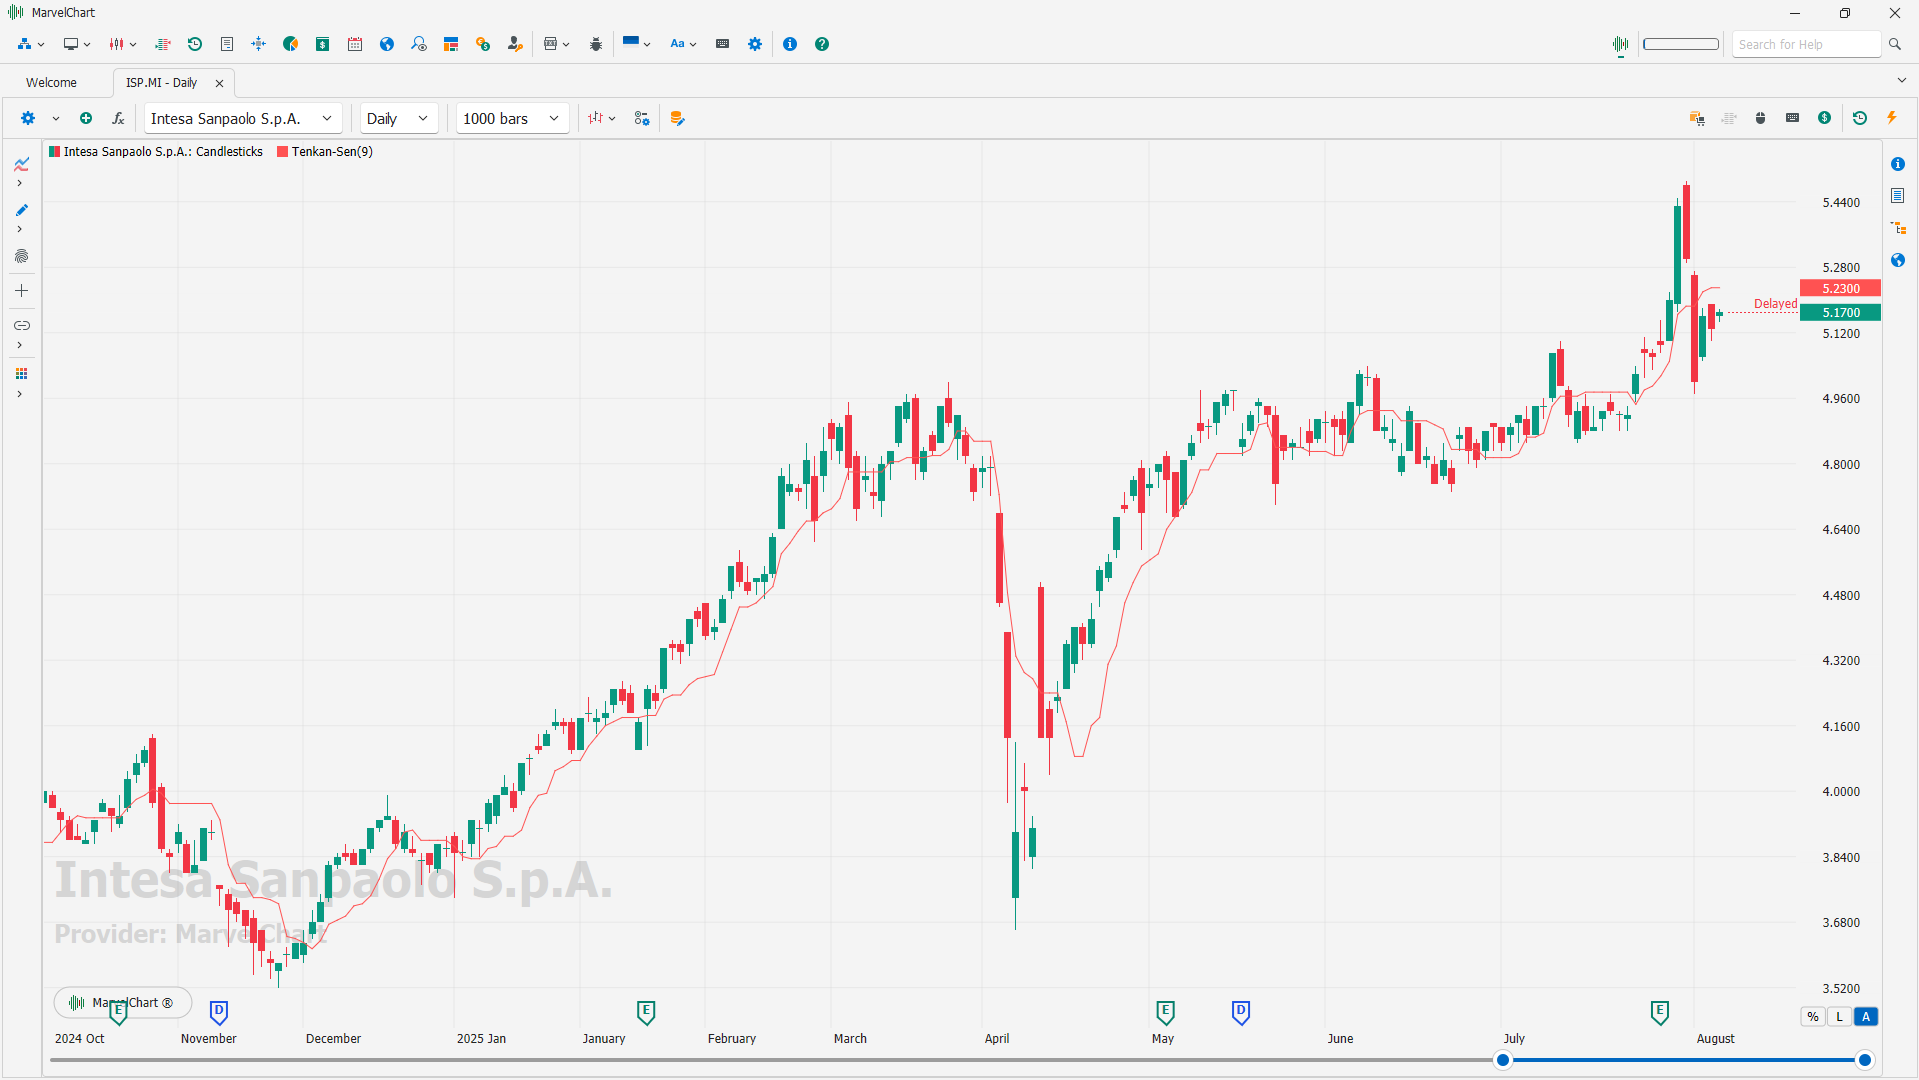
The Tenkan-Sen, commonly referred to as the Conversion Line, is an element of the Ichimoku Kinko Hyo trading system.
Computed by averaging the highest high and the lowest low for a particular period, typically the past 9 periods, it is designed to represent the midpoint of a market's price range, thereby offering insight into potential future price movement.
It is primarily used as a signal line and a minor support/resistance line. This is the turning line and is derived by averaging the highest high and the lowest low for the past nine periods. The Tenkan-Sen is an indicator of the market trend. If the line is moving up or down, it indicates that the market is trending. If it moves horizontally, it signals that the market is ranging.
The Kijun-Sen indicator is calculated exactly in the same way, except for the default number of periods, which is 26 in that case.
Volatility Stop
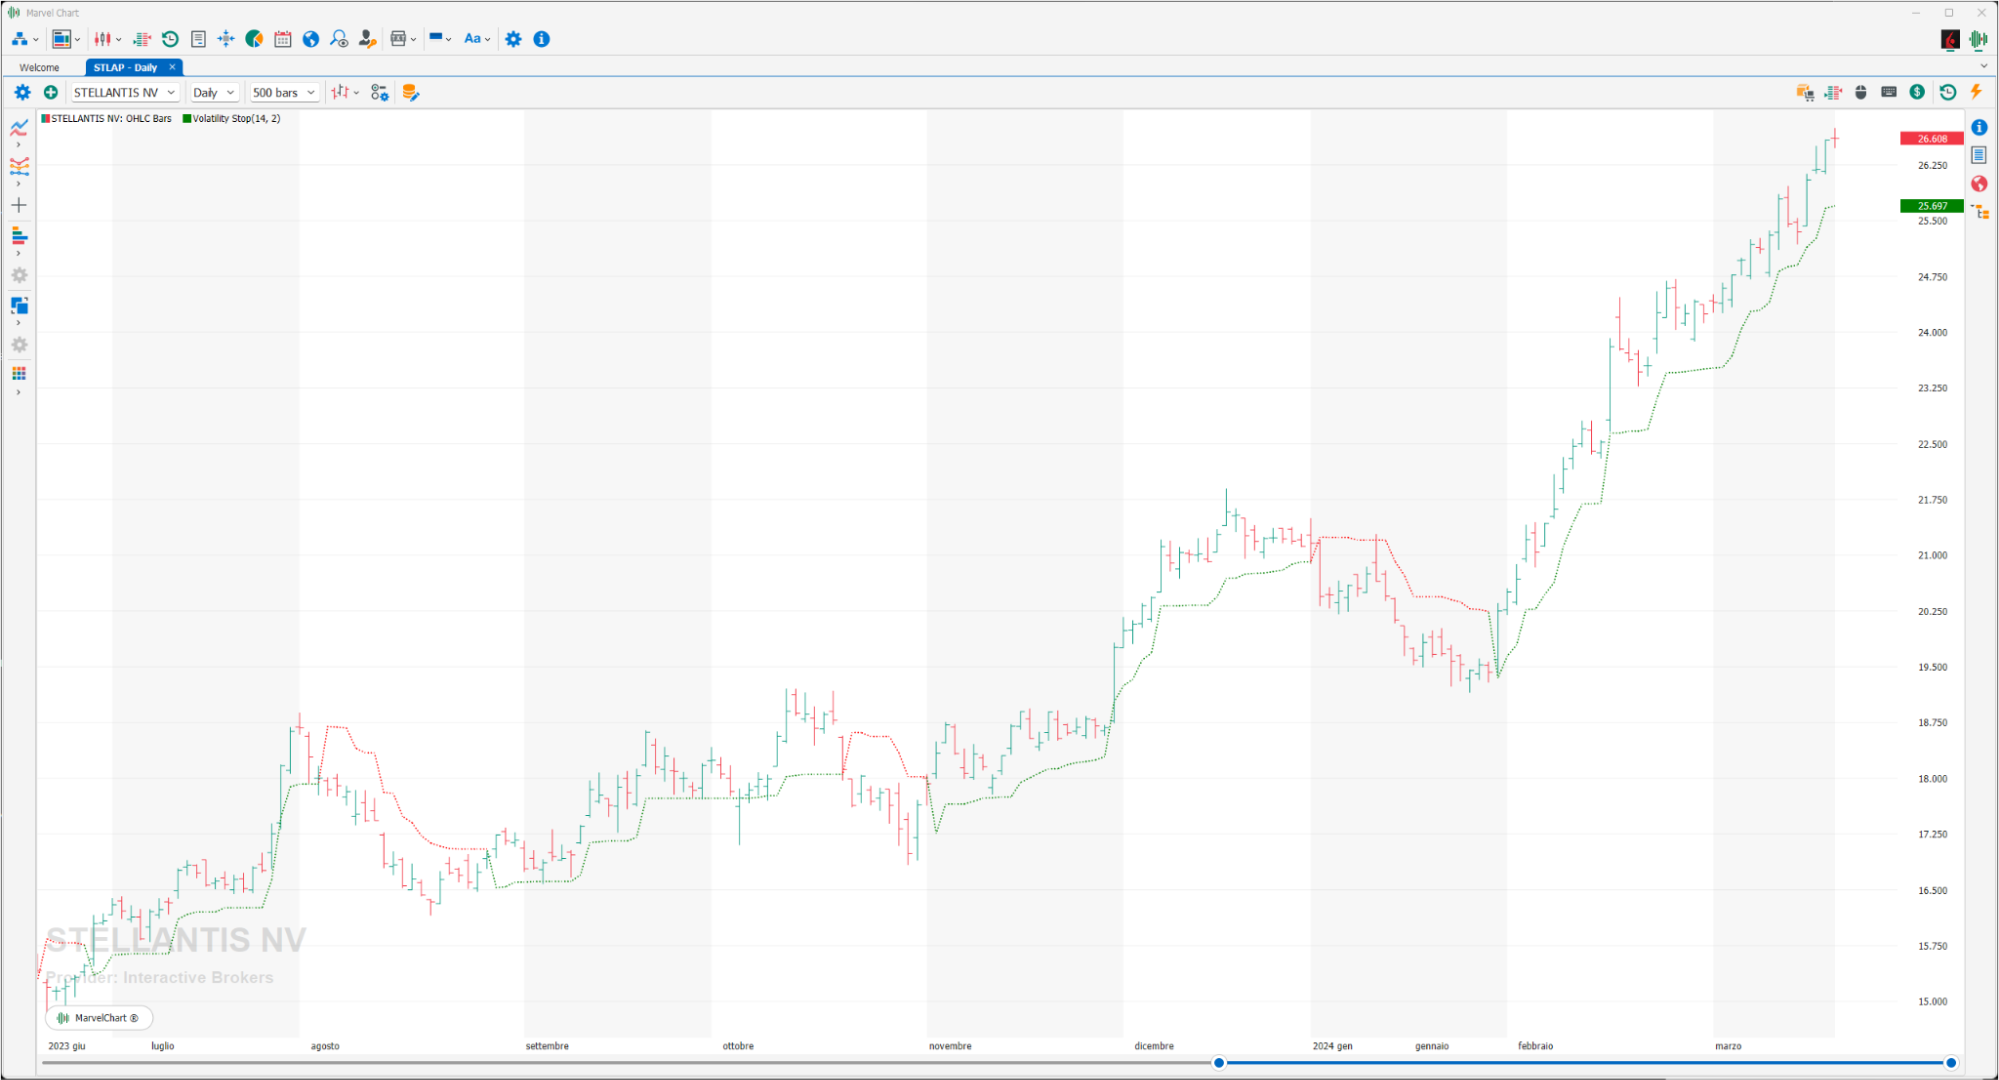
The Wilder Volatility Stop was introduced by Welles Wilder in his book “ New Concepts in Technical Trading Systems”. The Welles Wilder Volatility Stop calculates the signal's long stop by subtracting an ATR multiple from the "significant close" in the lookback period. In an uptrend the "significant close" is found at the highest CLOSE since the start of the trend. On the contrary, for the short stop adds the ATR multiple to the “significant close”. The “significant close” is therefore the lowest close since the start of the trend. When used with time-based bars, the trailing stop here fits the current market context . This allows the channel to stop widening when volatility increases and narrowing when it decreases. Wilder used a default lookback period of 7 bars for his Volatility Stop. When used with longer lookback periods, the “significant close ” can be replaced with a Donchian Channel calculated from the bar closes. Using the Donchian Channel is the standard approach for calculating the Chandelier Stop. In this scenario, a longer lookback period is applied, typically 22 bars.By activating this option, the long stop subtracts a multiple of the ATR from the highest close within the lookback period. In contrast, the short stop adds a multiple of the ATR to the highest close within the lookback period.
Williams Alligator
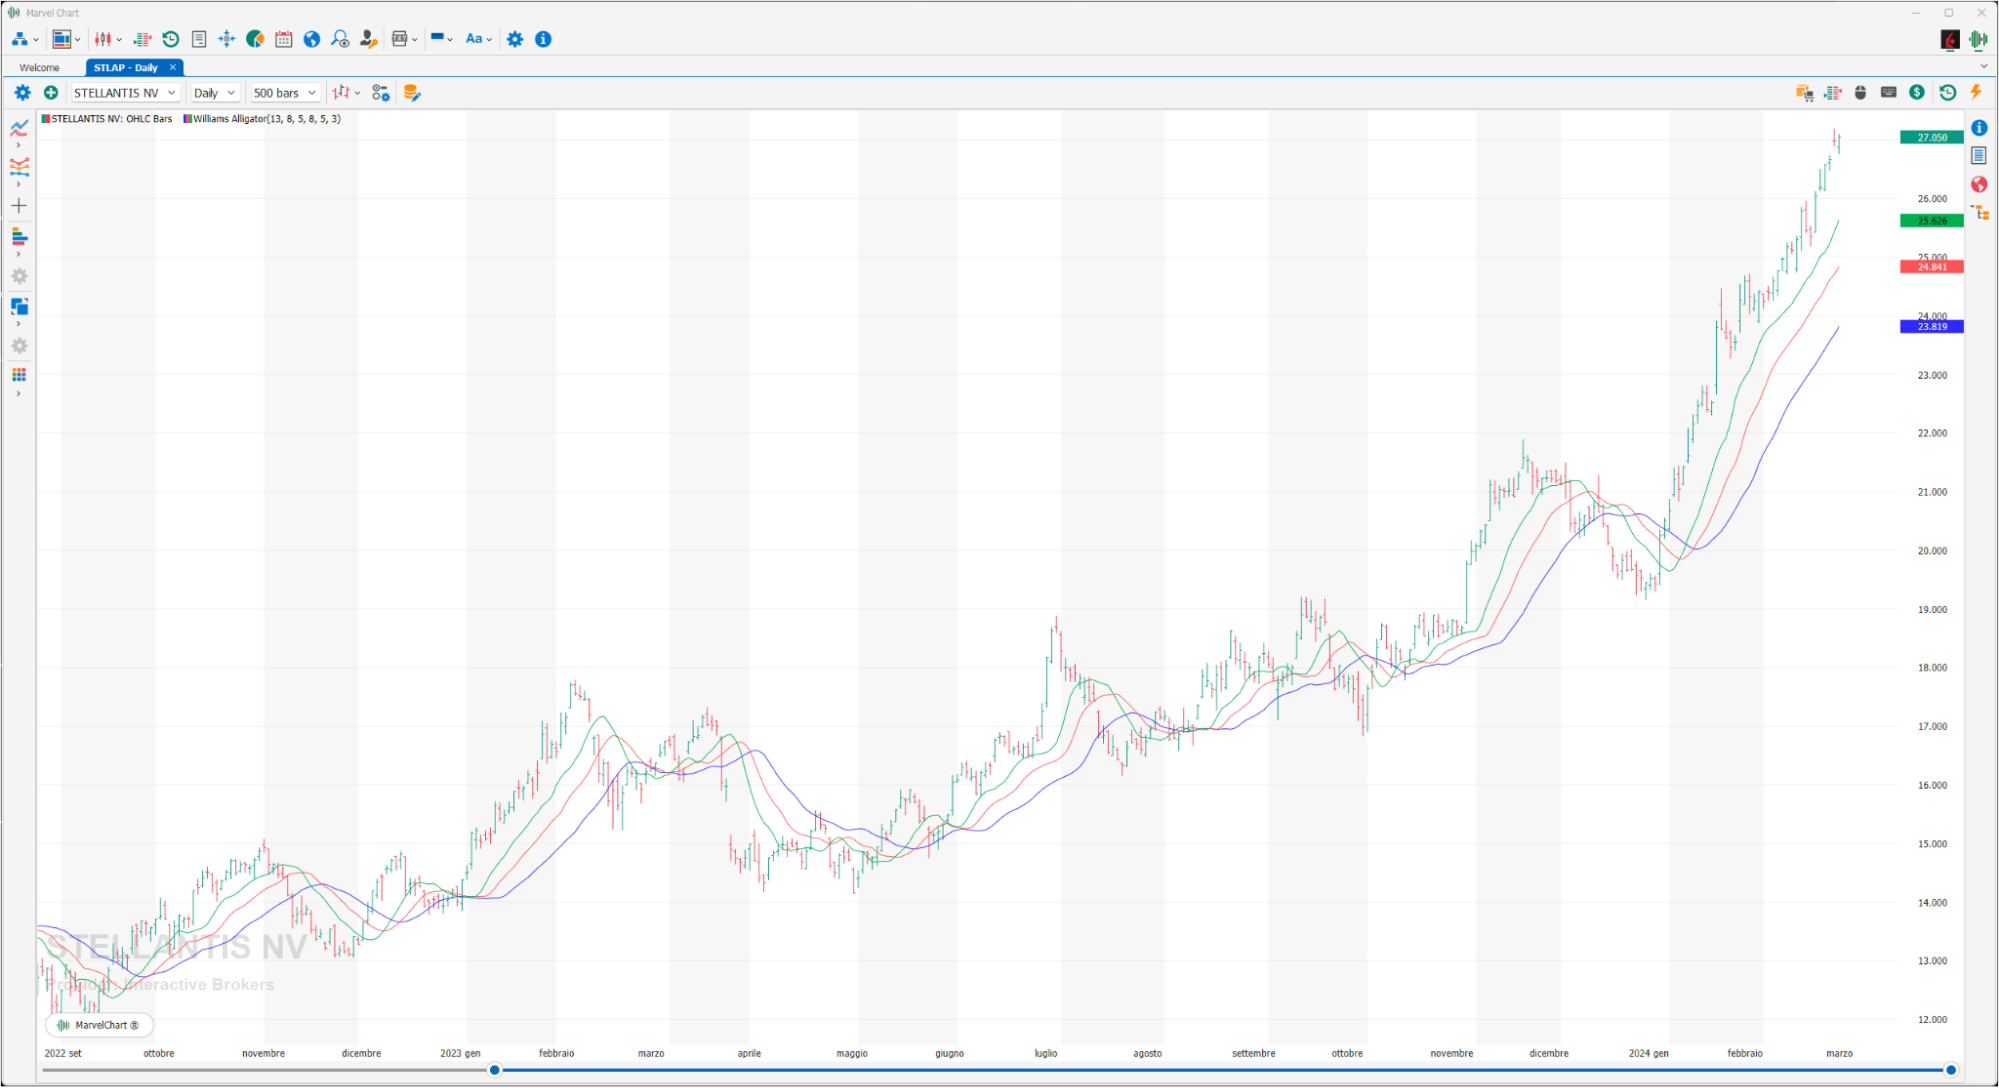
Like many other trend indicators, the alligator indicator works by plotting multiple moving averages (MAs) on a chart. Three moving averages are used, each representing a part of the "alligator": a blue line represents the jaw, a red line represents the teeth, and a green line represents the lips. The way the indicator works can be explained using the following analogy. When the alligator's jaw, teeth, and lips are closed (the moving average lines are intertwined), it means that it is tired or sleeping. This is when many traders avoid taking a position because the trend is too weak. The longer the alligator sleeps, the hungrier it becomes: when it wakes up, it is ready to hunt bears and bulls. The alligator opens its jaws (the lines cross and move up or down) and eats until it is full. So now the alligator has lost interest in eating and closes its mouth to rest (the lines move closer together). This is when some traders close their positions if they have made a profit, as the upside or downside may have stopped.
Williams Fractals
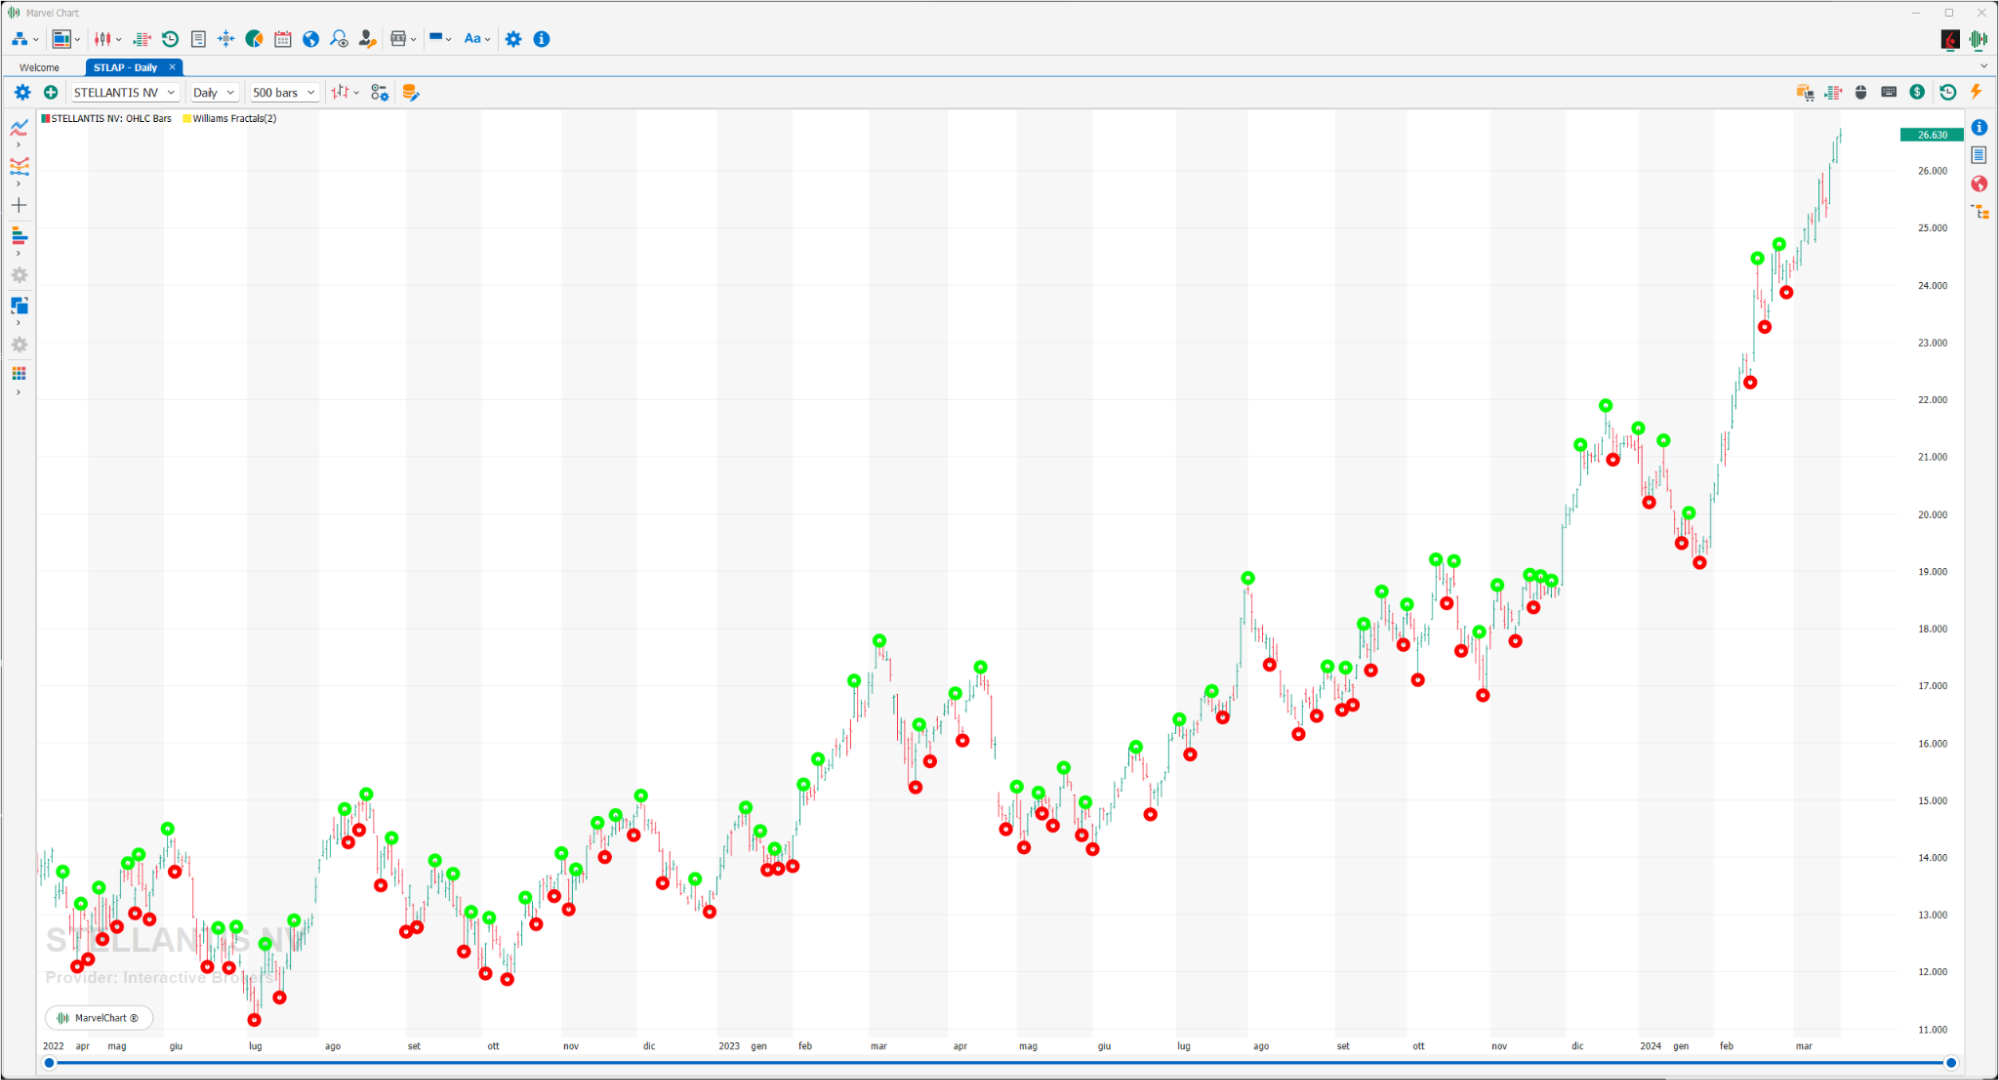
The Williams Fractal indicator aims to detect reversal points through highs and lows. It is known for being one of the first indicators to use fractals and introduce them to mainstream trading. Typically, the indicator is shown with a green or red dot to indicate its high or low status.
Zig-Zag
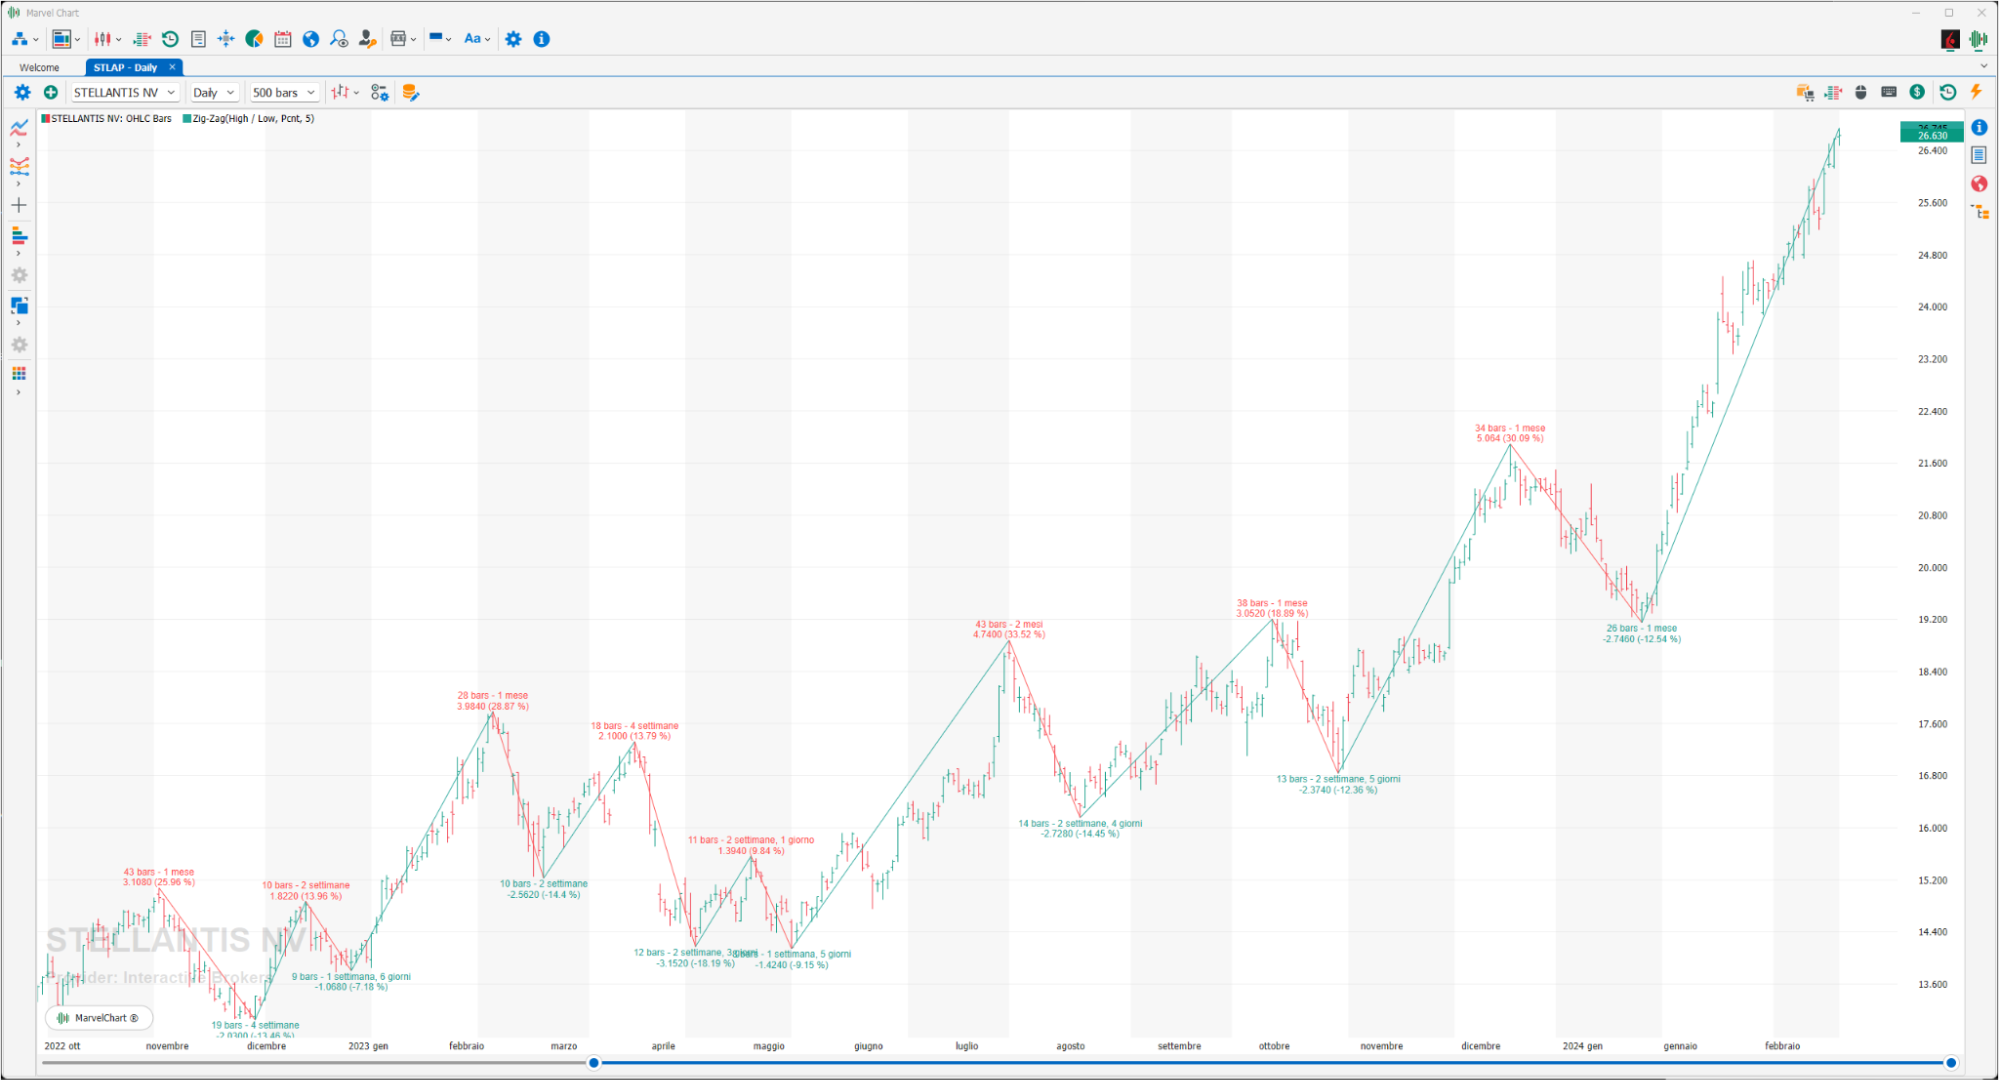
The Zig Zag indicator reduces the impact of price fluctuations and is used to help identify price trends and changes in price action. Points are drawn on a chart whenever prices reverse by a greater percentage of a chosen variable. An analyst can set the percentage level to trigger the indicator. Straight lines are then drawn connecting these points.