Volume
Cumulative Daily Volume
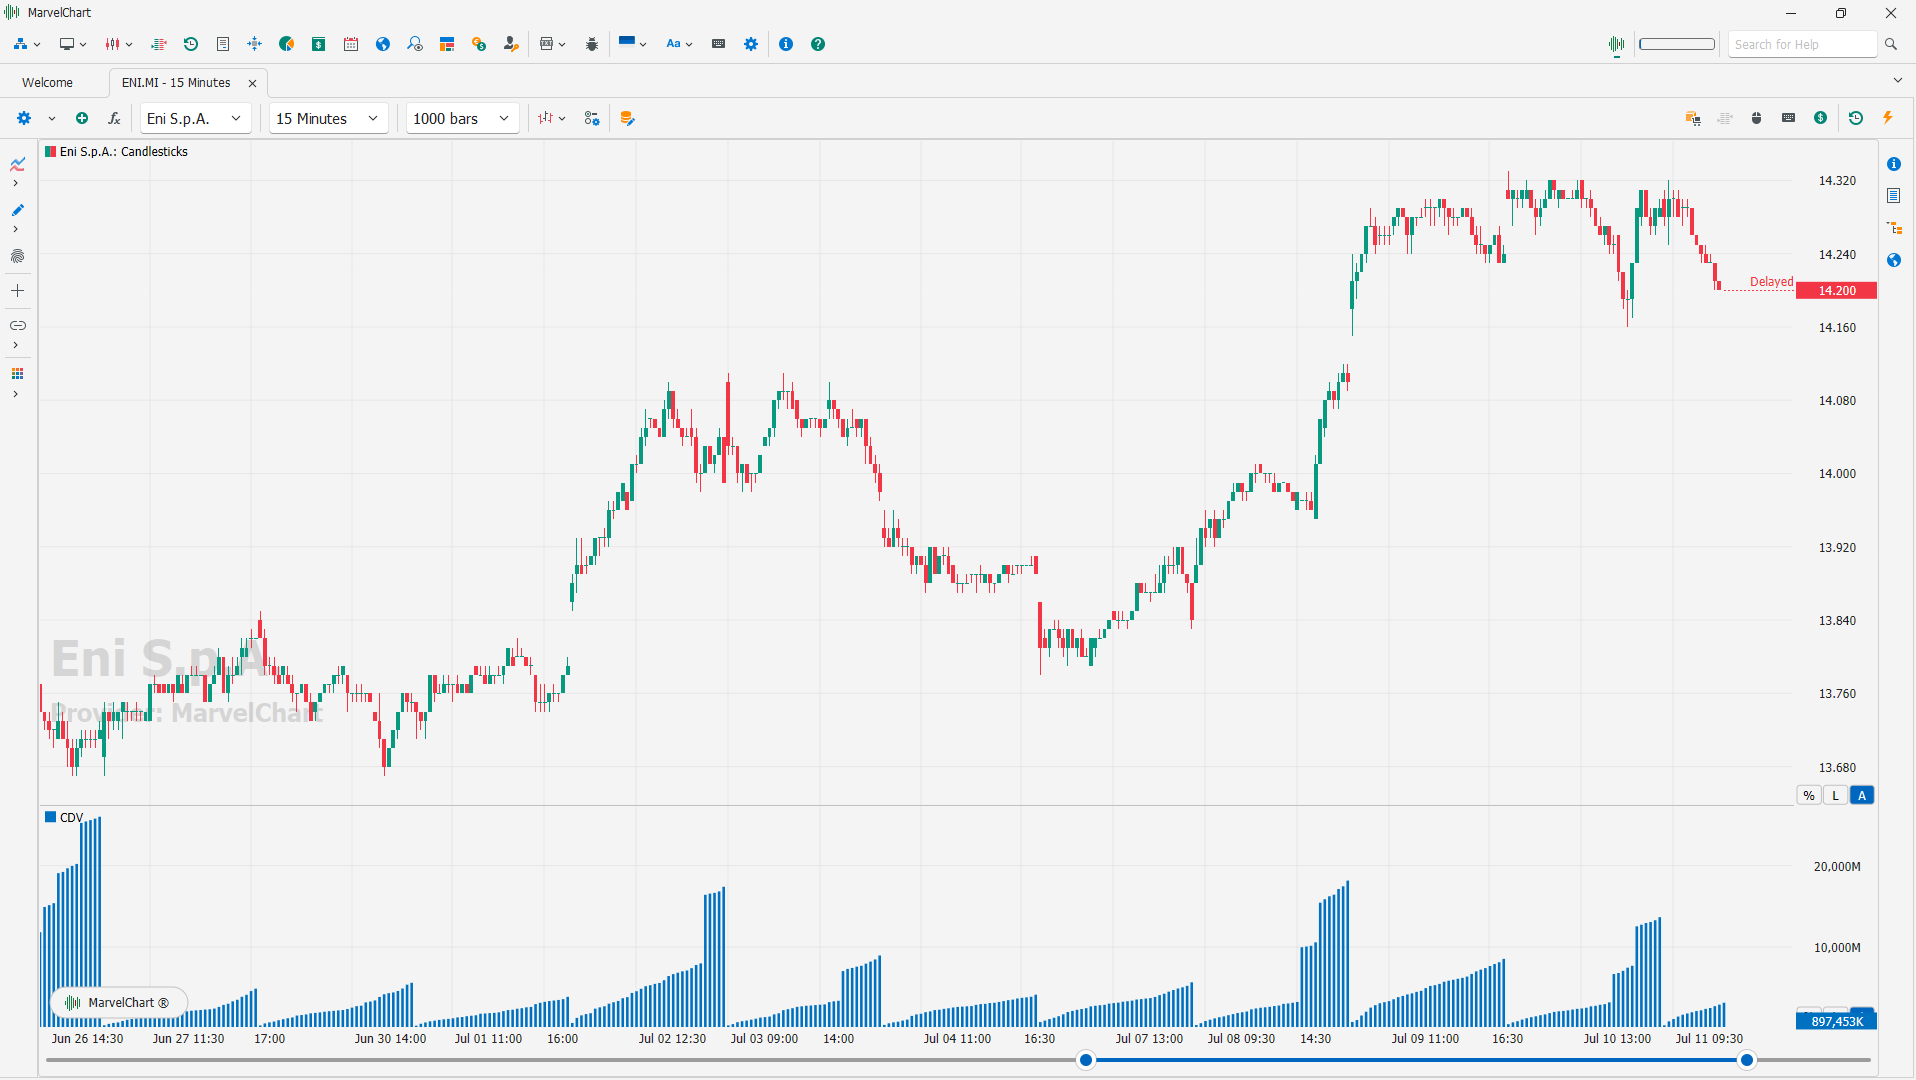
This indicator displays the cumulative volume over a daily period.
Cumulative Volume Oscillator
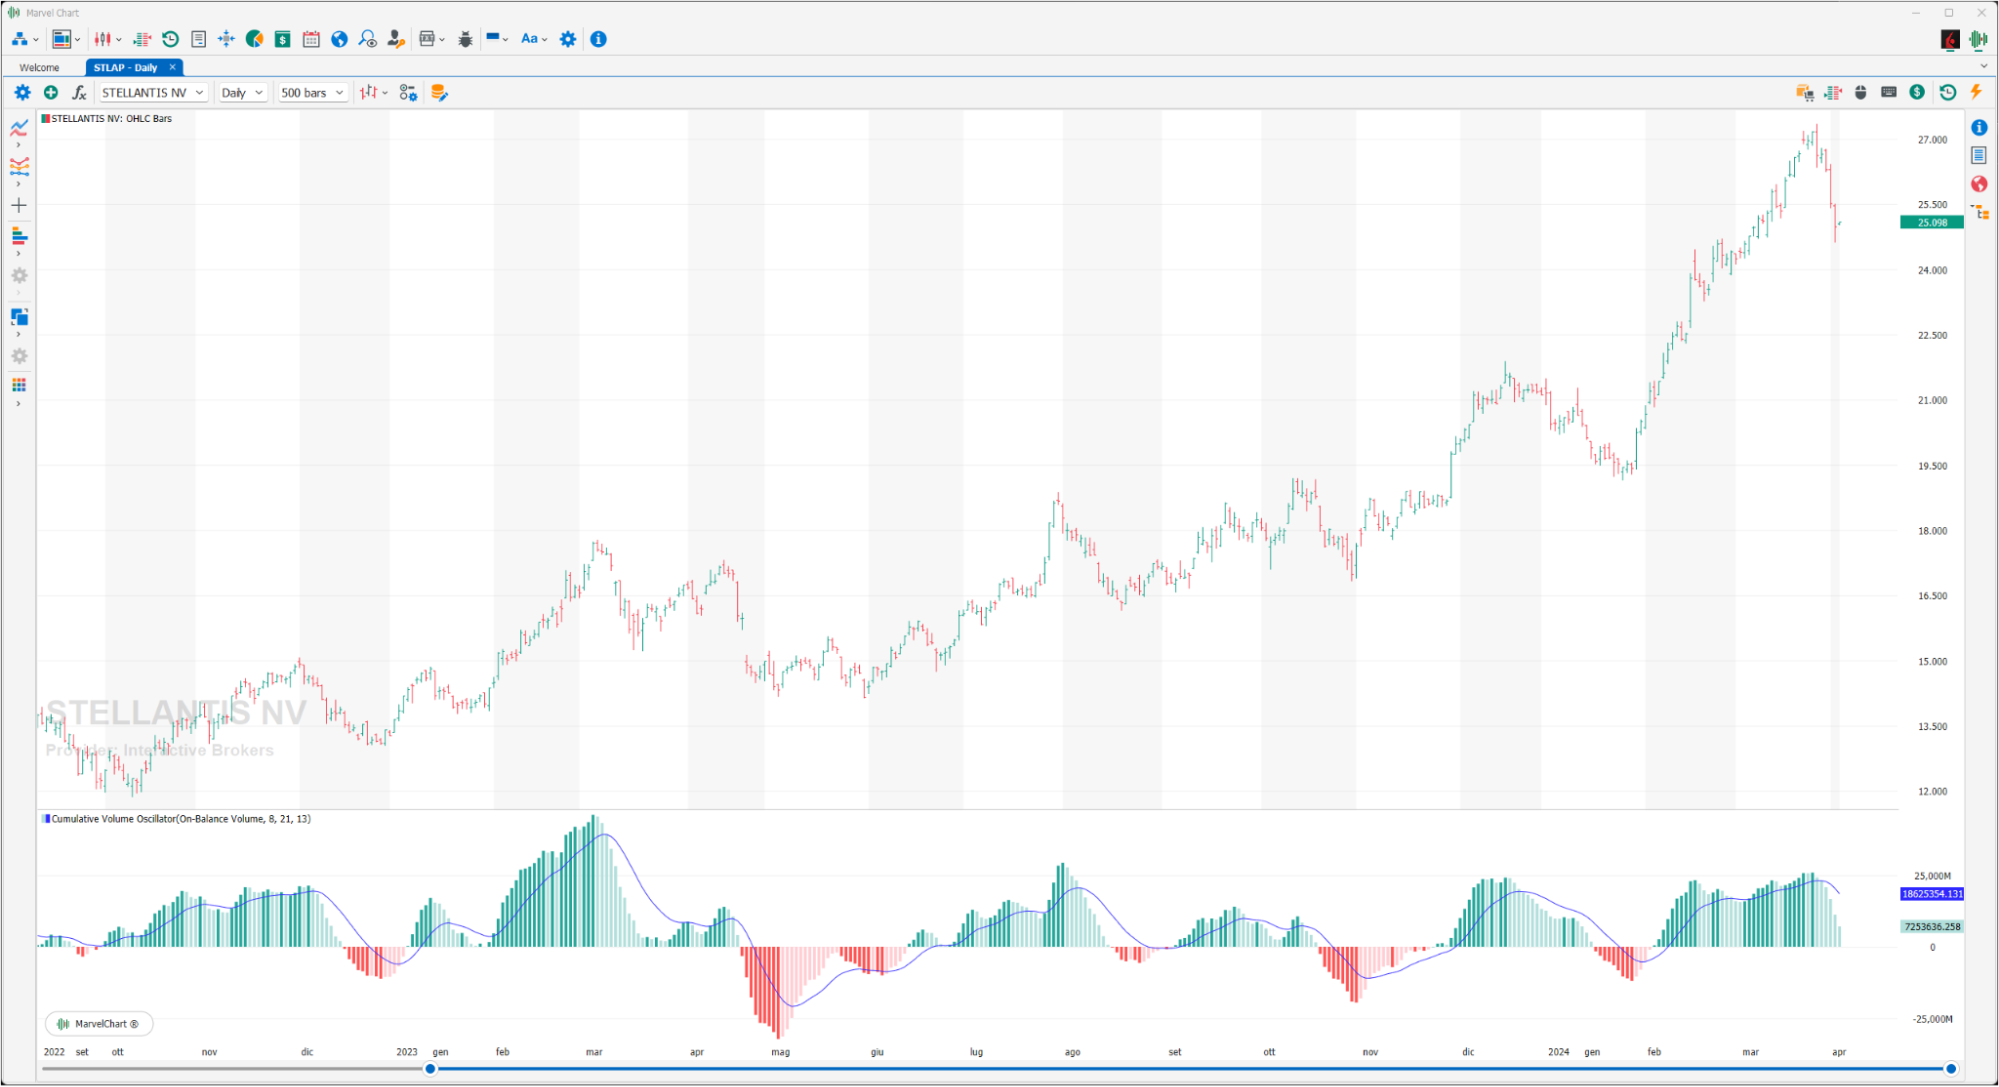
The Cumulative Volume Oscillator, or CVI, is a momentum indicator that measures the movement of funds within the stock market by calculating the difference between advancing and declining stocks. The Cumulative Volume Oscillator is a breadth indicator that shows the direction of a market or index, such as the New York Stock Exchange or the S&P 500. Although its name makes it sound similar to the On-Balance-Volume indicator, the difference is that the CVI only looks at the number of stocks rather than their volume, similar to the Advance/Decline index. When reading the CVI, it is important to note that the actual number does not matter because it is not normalized (it is only a running total). Traders and investors should instead look at the trend of the CVI over time relative to the price of the index to interpret its meaning. Many traders and investors also use the CVI in conjunction with other forms of technical analysis, such as chart patterns or technical analysis indicators, rather than using it as a standalone indicator. In this way, they increase their chances of a successful trade by looking for trend confirmations or reversals.
Demand Index
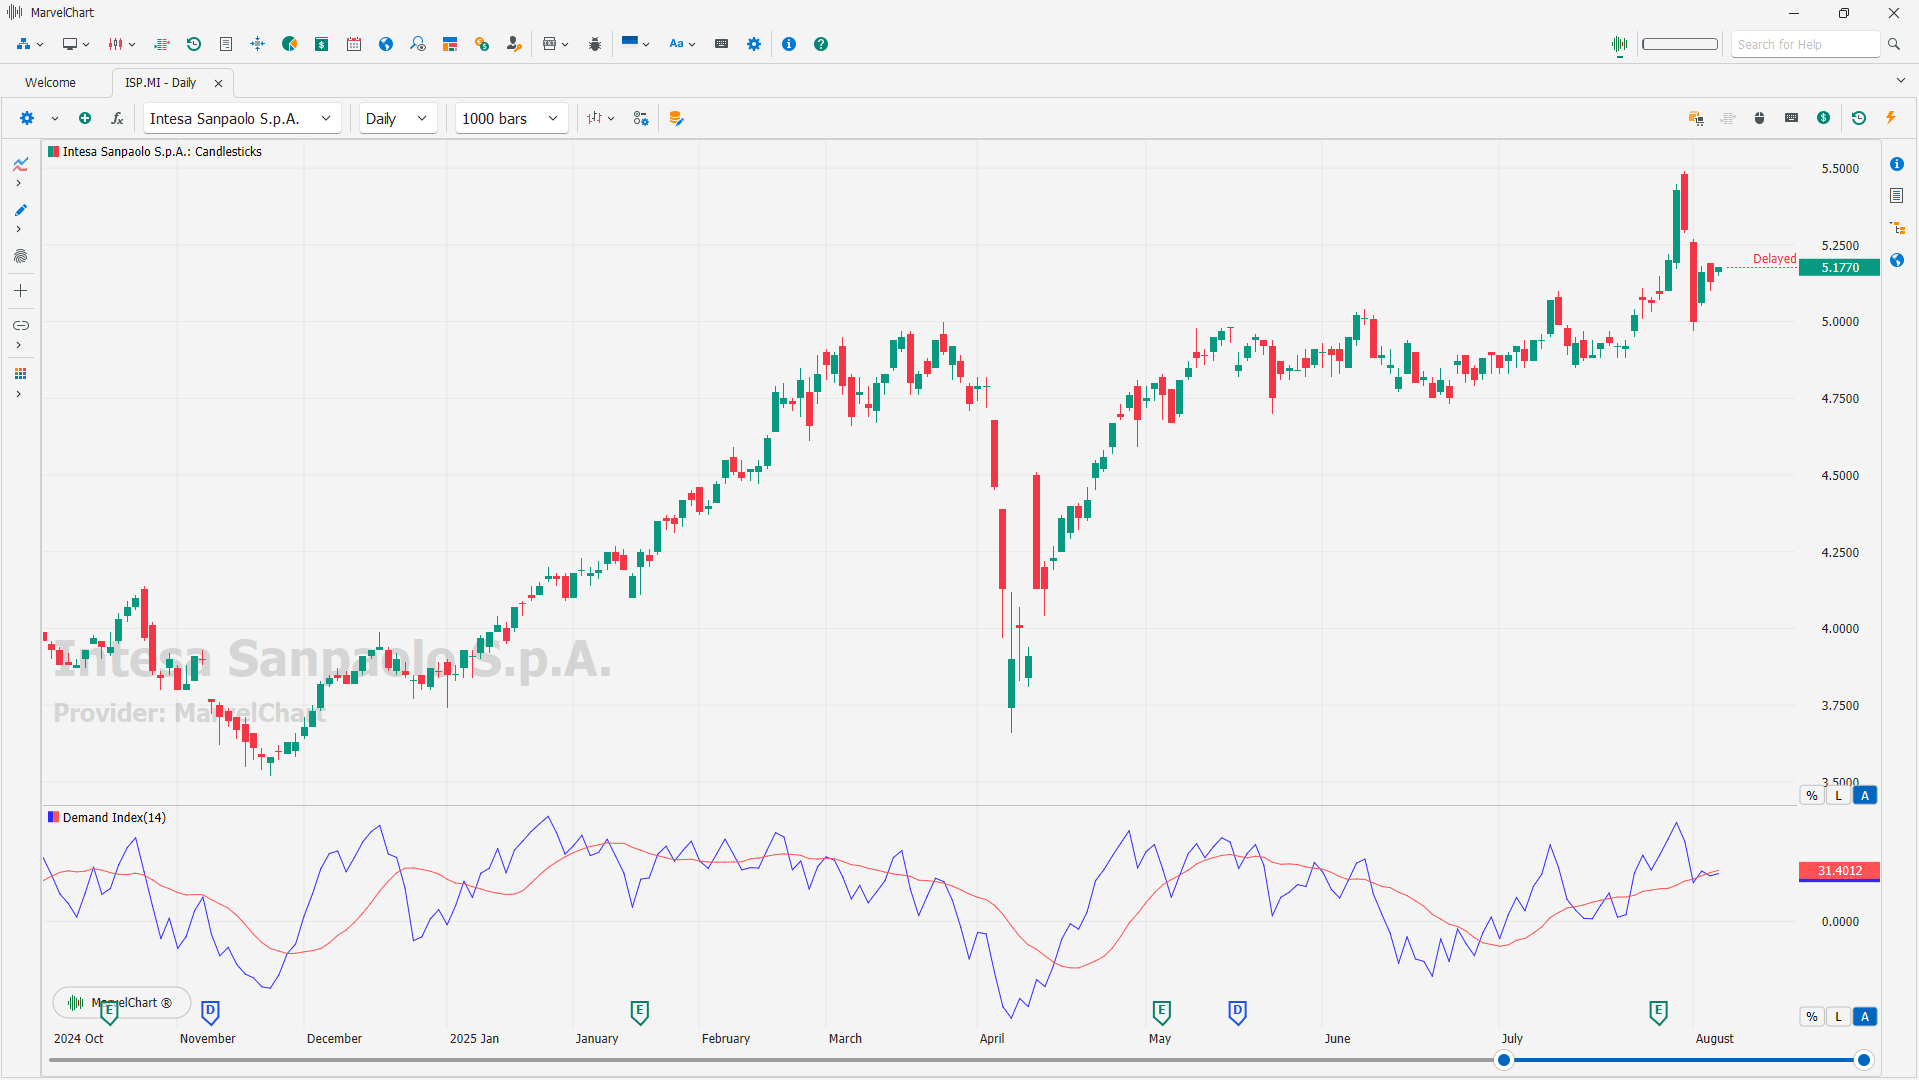
The Demand Index is a technical indicator, developed by James Sibbet, that uses price and volume data to assess buying and selling pressure in a market. It is often used as a leading indicator to anticipate potential price movements. The index is calculated based on the ratio of buying pressure to selling pressure, and its readings can be interpreted to gauge the strength of demand and potential trend changes.
Ease Of Movement
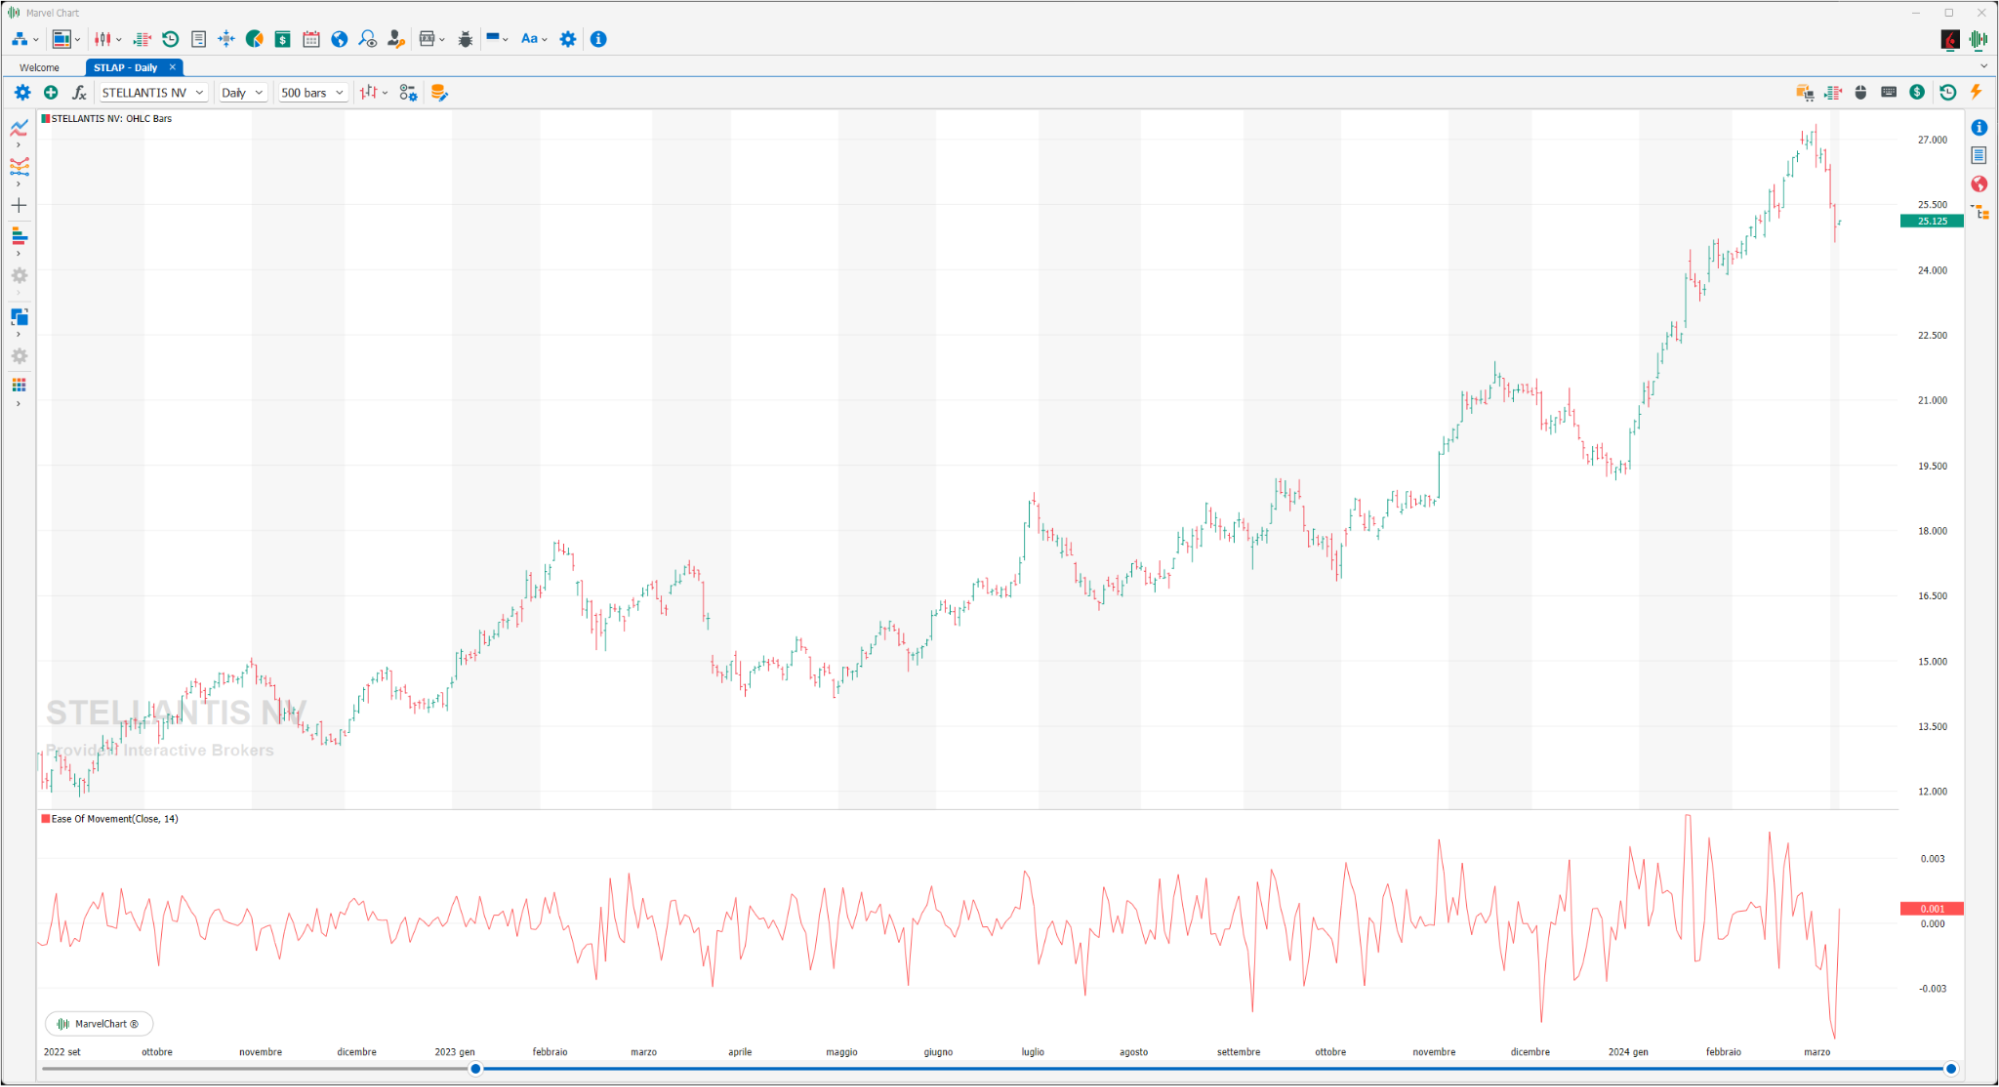
The Ease Of Movement uses changes in price and volume to determine how quickly the market price is able to move up or down. The index shows high values when prices are moving up on low volume, and low values when prices are moving down on low volume. The index will be close to zero if prices move little, or if they move but with high volumes as if, in fact, a significant mass of trades were needed to move them. The signals provided by the Ease of Movement indicator give a BUY signal when it moves above zero and a SELL signal when it breaks through zero downwards, that is, when they indicate that prices are starting to move more easily.
Force Index
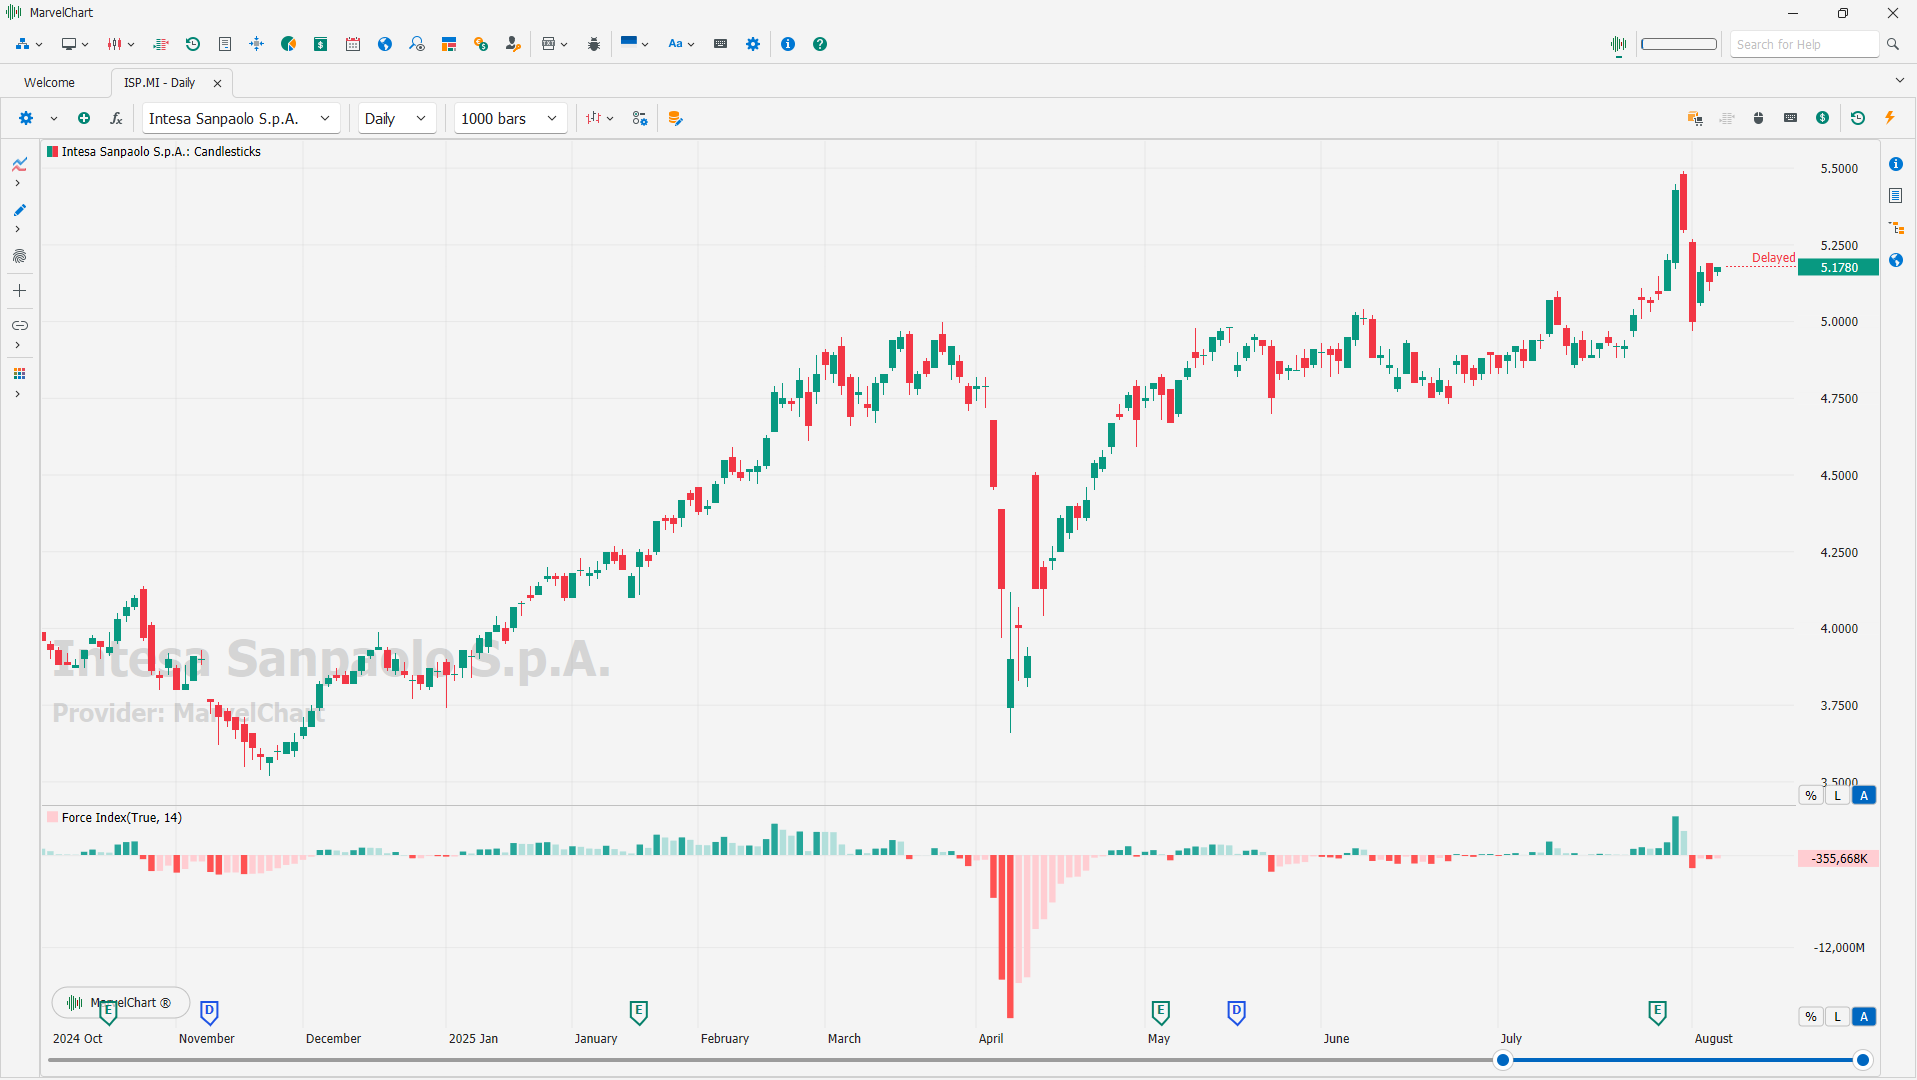
The Force Index is a technical indicator, developed by Alexander Elder, that measures the strength of buying and selling pressure in a market by considering price and volume. It combines price changes with trading volume to indicate the force behind price movements and potential trend reversals.
Calculation
The Force Index is calculated by subtracting the previous day's closing price from the current day's closing price, and then multiplying the result by the trading volume. This gives a value that is either positive or negative, indicating the direction of the "force".
Interpretation
Positive values: Suggest buying pressure, indicating an uptrend or potential uptrend continuation.
Negative values: Suggest selling pressure, indicating a downtrend or potential downtrend continuation.
Zero line: The indicator fluctuates around the zero line, and crossovers can signal potential trend changes.
Use in Trading
Confirming trends: Traders use it to confirm the strength of an existing trend by observing whether the Force Index is trending in the same direction as the price.
Identifying potential reversals: Divergences between the Force Index and price (e.g., price making new highs while the Force Index doesn't) can signal weakening momentum and potential reversals.
Finding entry and exit points: Crossovers of the zero line can suggest potential buying or selling opportunities.
Volume's Role
The volume component is crucial, as higher volume confirms the strength of a price move. A large price change accompanied by low volume might be less significant than a similar change with high volume.
Klinger Volume Oscillator
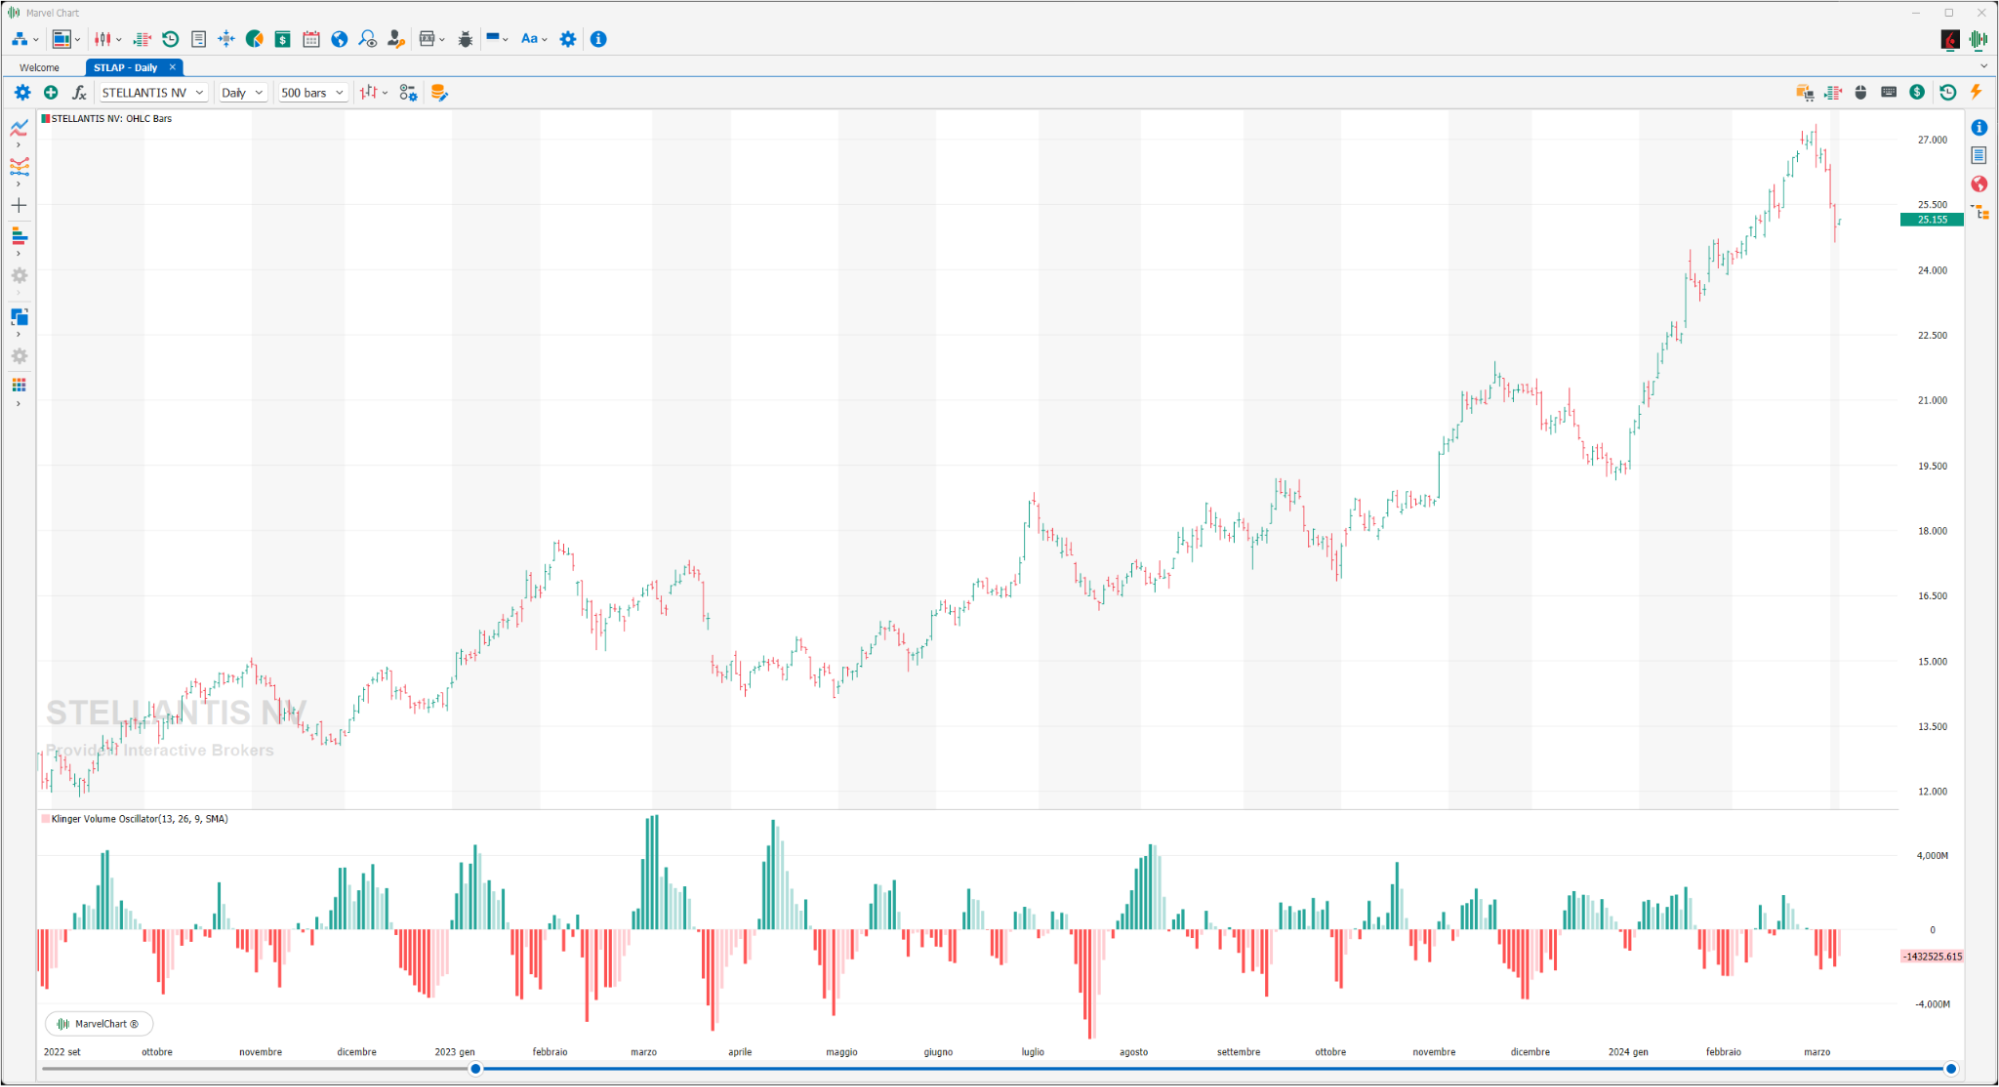
Klinger Volume Oscillator was created by Stephen J. Klinger with the aim of analyzing the relationship between price and volume in the short, but also in the medium term. The calculation method is based on three different surveys: the price range, the volume and the accumulation or distribution in the period considered. The reason for its creation is mainly that volume, together with prices, causes greater pressure on supply or demand, for this reason it is necessary to give importance to prices but also to the strength of volume that causes the rise or fall of prices. Being so closely linked to the price/volume trend with particular reference to their correlation, it is entirely logical and necessary that the indicator is used primarily to identify divergences that can highlight excesses or falls in price, thus showing new highs or lows that are not accompanied by a corresponding strength on volumes. In the standard calculation for the creation of the Klinger Volume Oscillator, the difference between a 34-period and a 55-period “Exponential Moving Average” with a 13-period trigger line is used.
Negative Volume Index
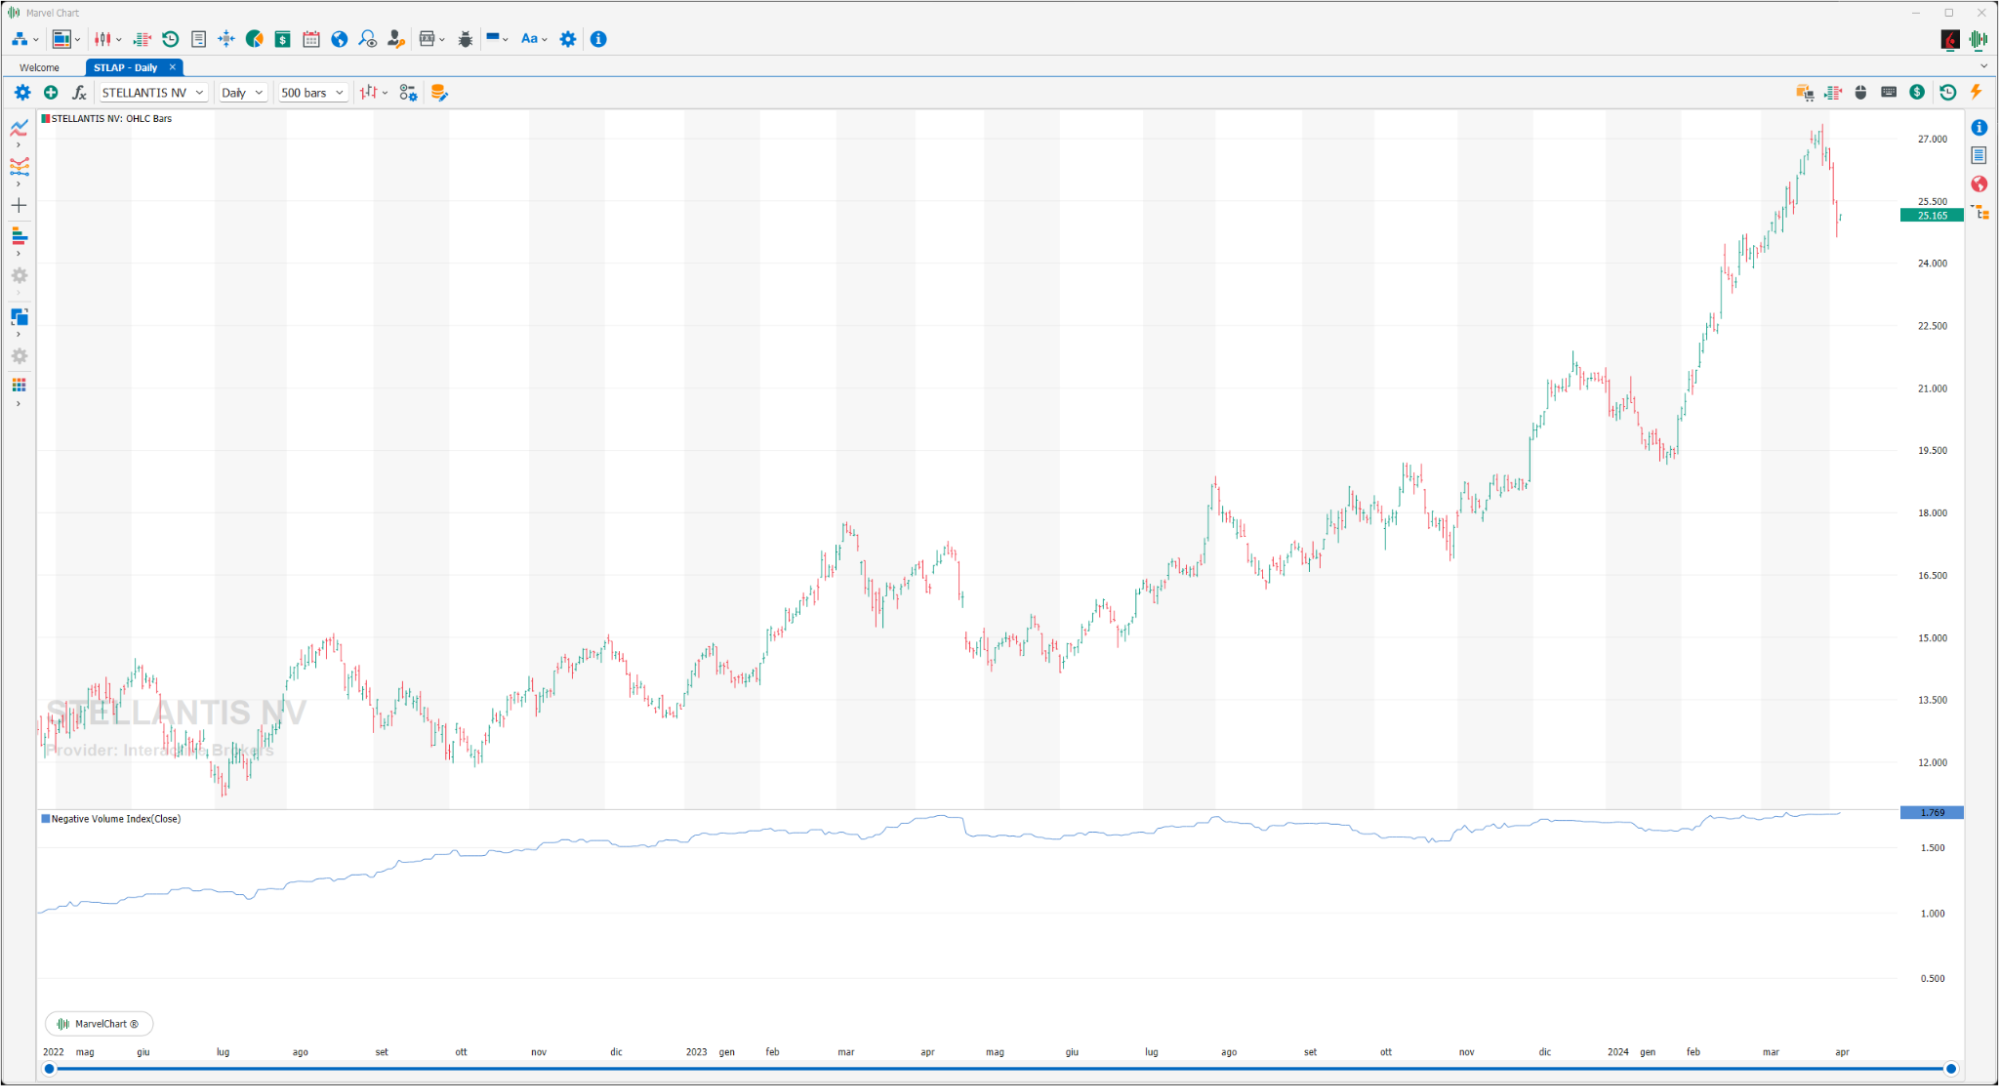
The Negative Volume Index is an indicator that correlates a decrease in volume with the change in the price of the stock. When the volume decreases compared to the previous period, the Negative Volume Index is adjusted based on the percentage change in the price of the stock. The Negative Volume Index assumes that volume increases when “uninformed” investors enter the market and decreases when “strong hands” take a position quietly. Therefore, changes in the Negative Volume Index show that there is profit taking. BUY signals occur when the Negative Volume Index is increasing; SELL signals occur when the Negative Volume Index is decreasing. Very useful if used also with the “Positive Volume Index”, the intersections of the latter can indicate the beginning of a period of lateralization of the stock.
Net Volume
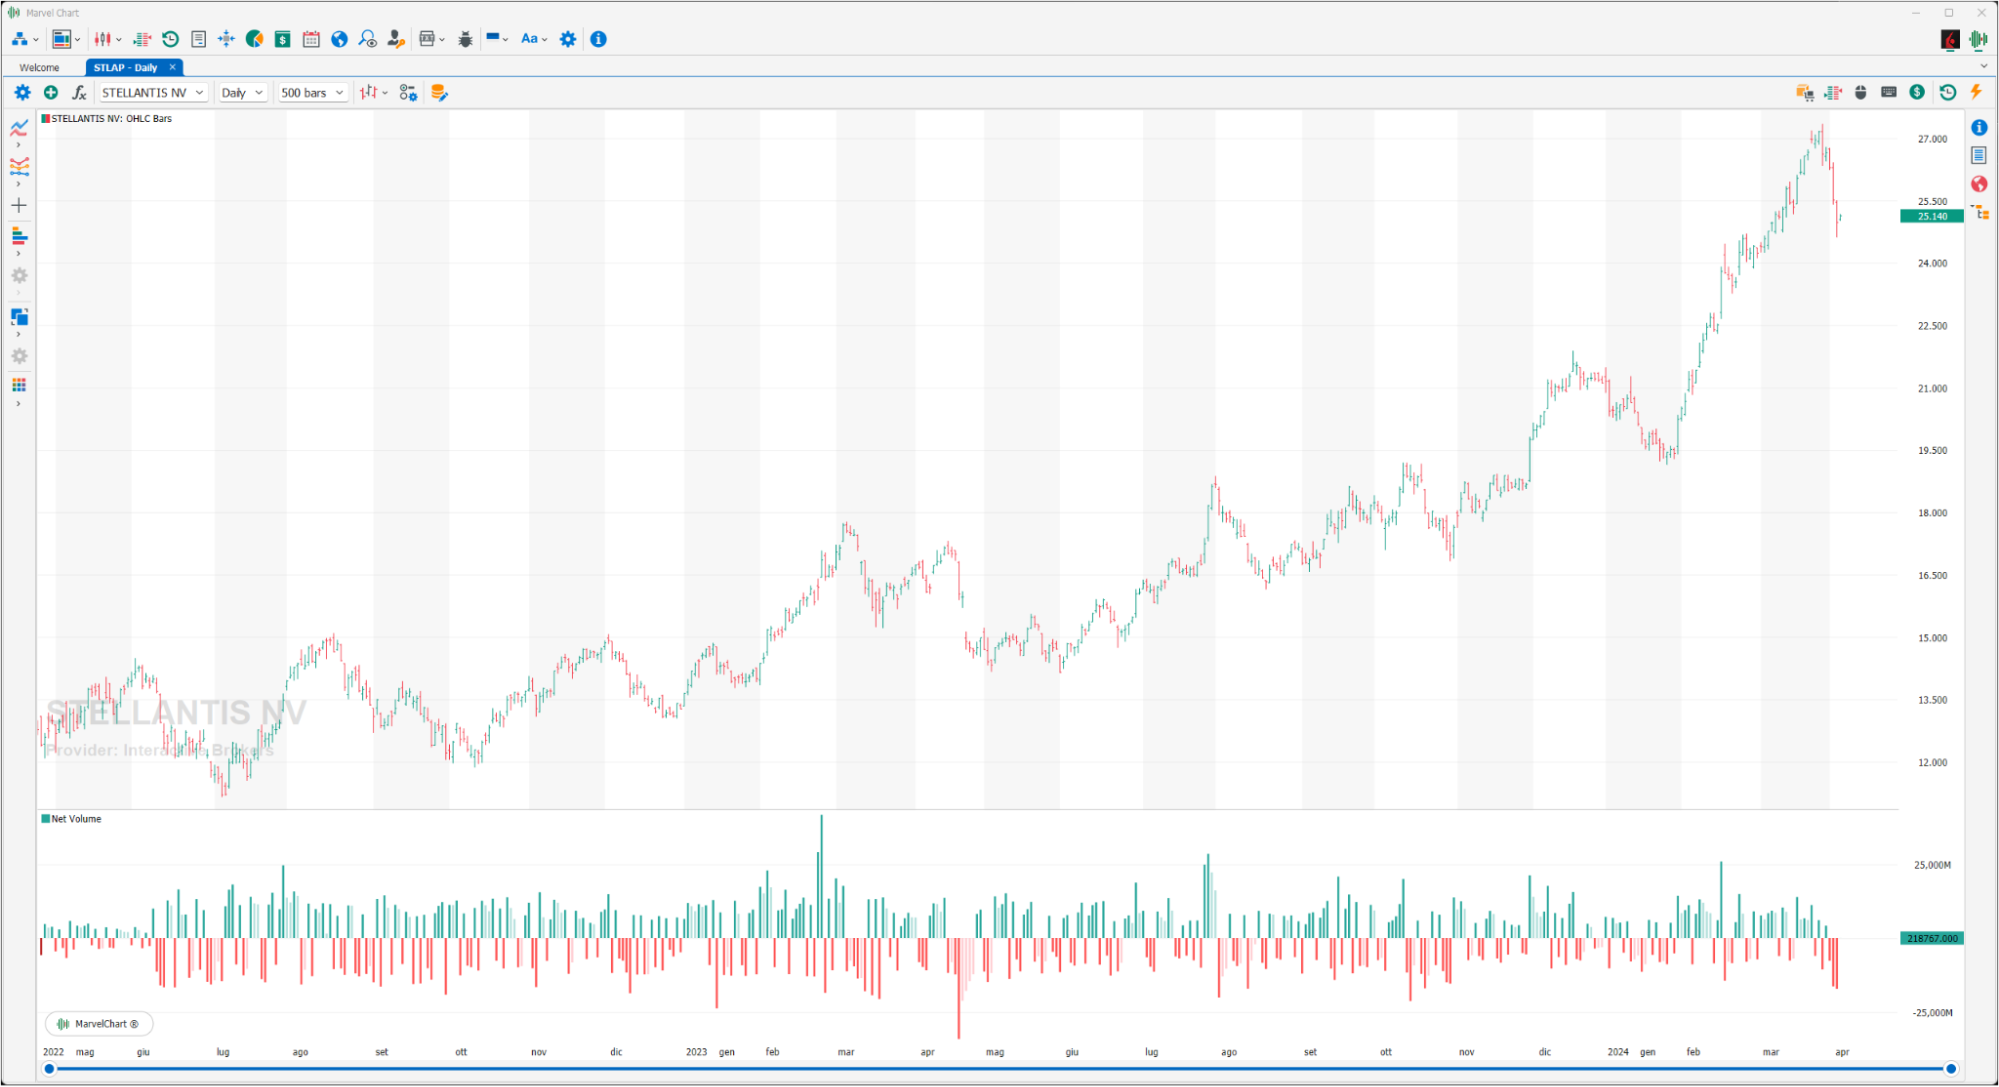
Net Volume is calculated by subtracting the upside volume of a stock or asset from the downside volume of the stock over a period of time chosen by the trader. It differs from other volume indicators because it makes a clear distinction between a bullish or bearish market. Traders will most likely use Net Volume displayed below the price chart and the bars will show the value for each given period plotted on the chart.
On Balance Volume
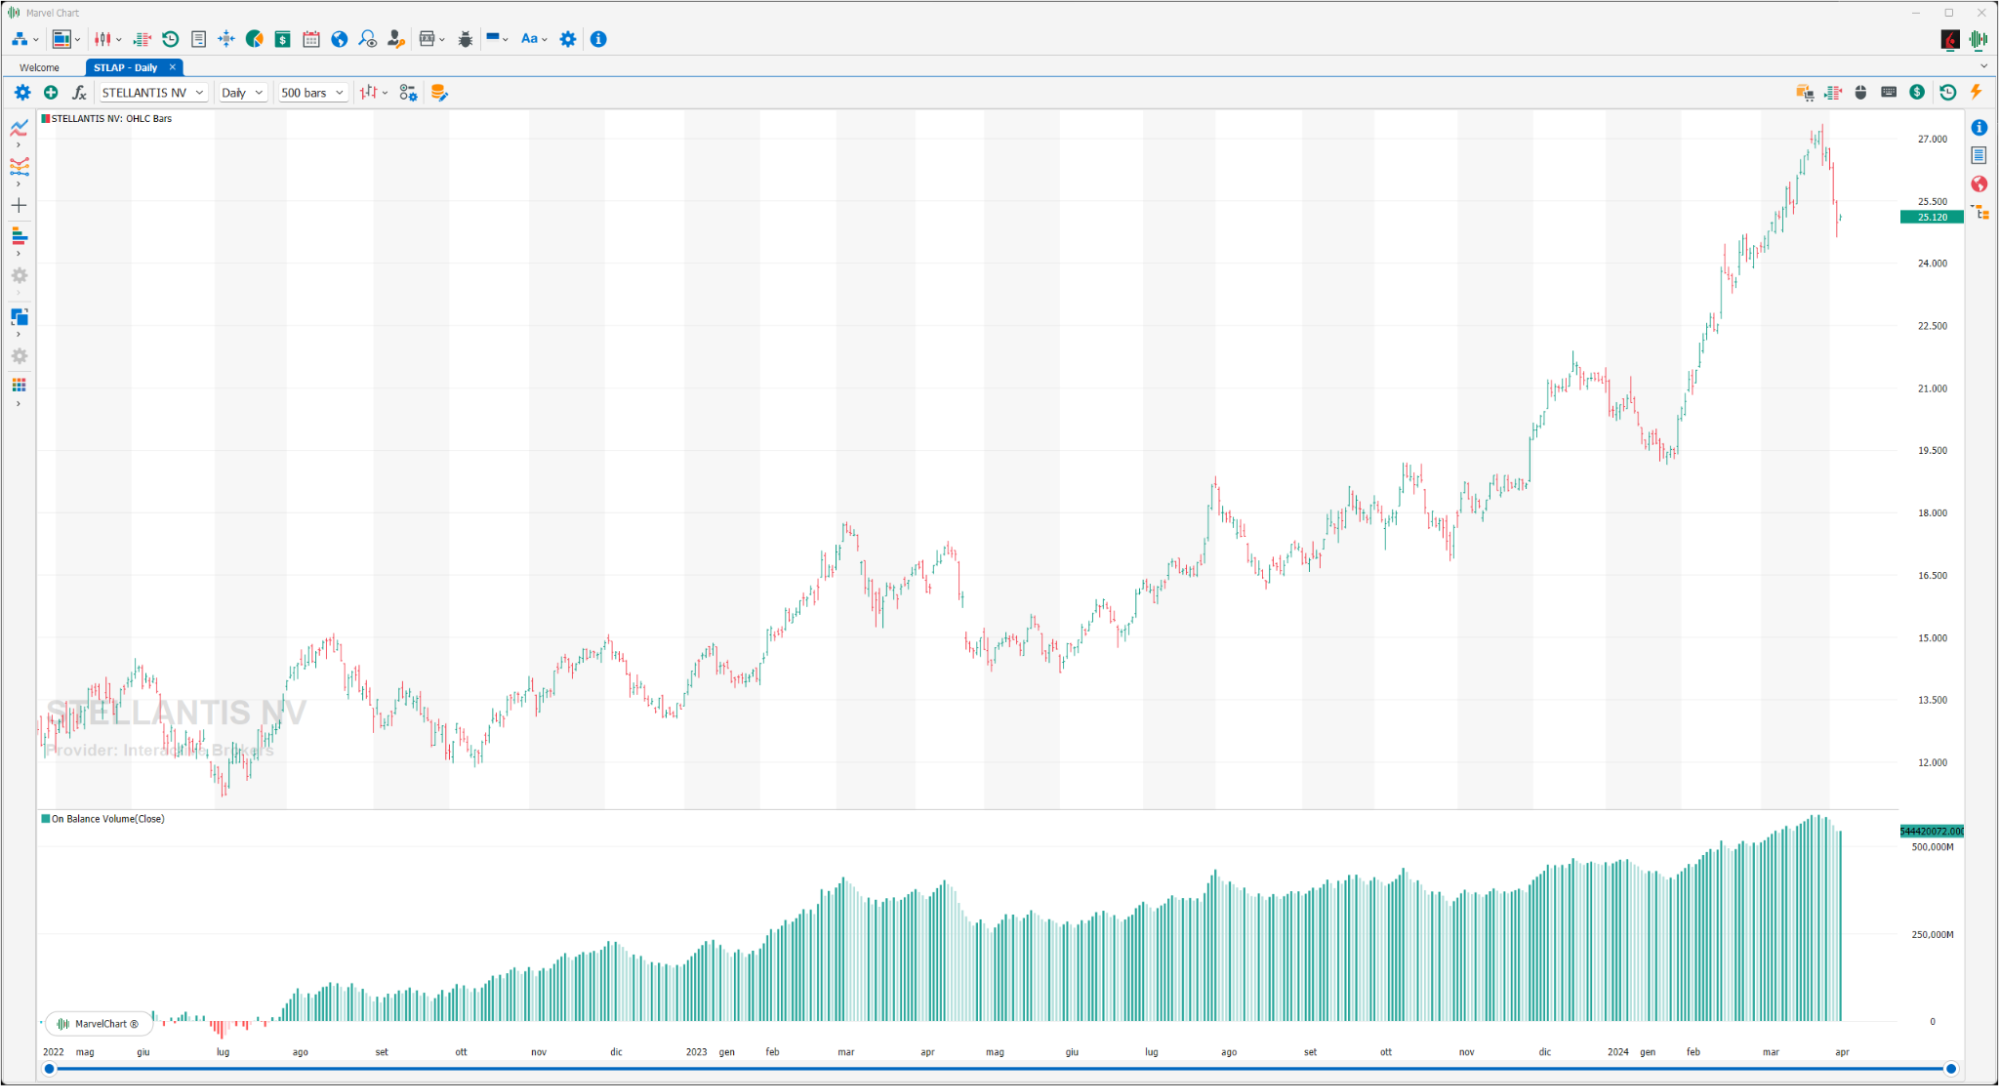
On Balance Volume (OBV) is a very basic volume indicator developed by Joseph E. Granville, based on the assumption that large investors enter (accumulation phase) or exit (distribution phase) early from the market towards the mass of investors. In fact, this indicator takes into account the trend of volumes in relation to the trend of prices, that is, it represents the algebraic sum of the volumes traded in the different stock market sessions. If the CLOSE is greater than the previous CLOSE, the VOLUME is added to the previous VOLUME, if the CLOSE is less than the previous CLOSE, the VOLUME is subtracted from the previous VOLUME, if the CLOSE is equal, the VOLUME of the previous detection is assumed. The result is a curve that serves to confirm a TREND. Much criticism has been leveled at this indicator, believing that it does not faithfully reflect which side the volumes were on. In fact, a day with high positive volumes that closes slightly negative gives a negative color to the entire volume of the volumes traded.
Positive Volume Index
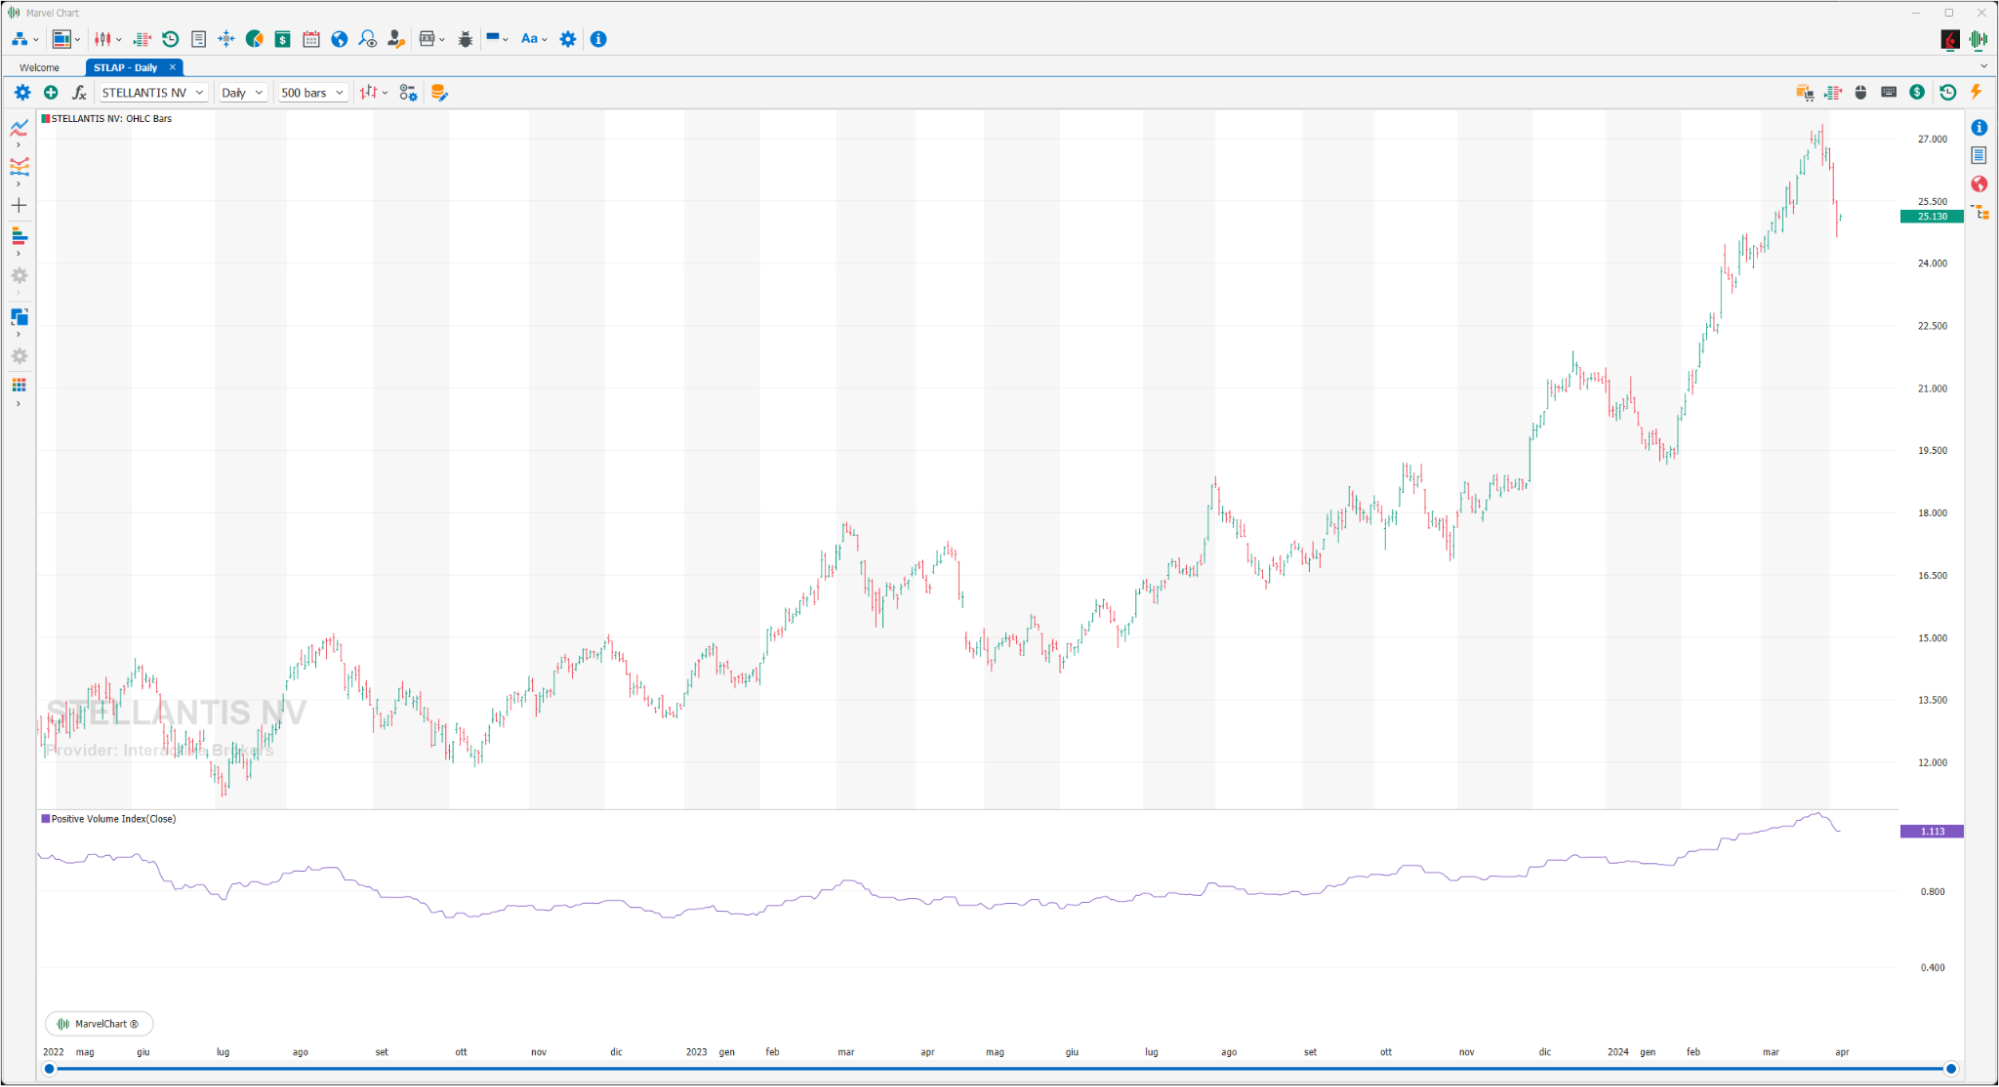
Very useful also used with the “Negative Volume Index”, the crossovers of the latter can indicate the beginning of a lateralization period of the stock.
Price Volume Trend
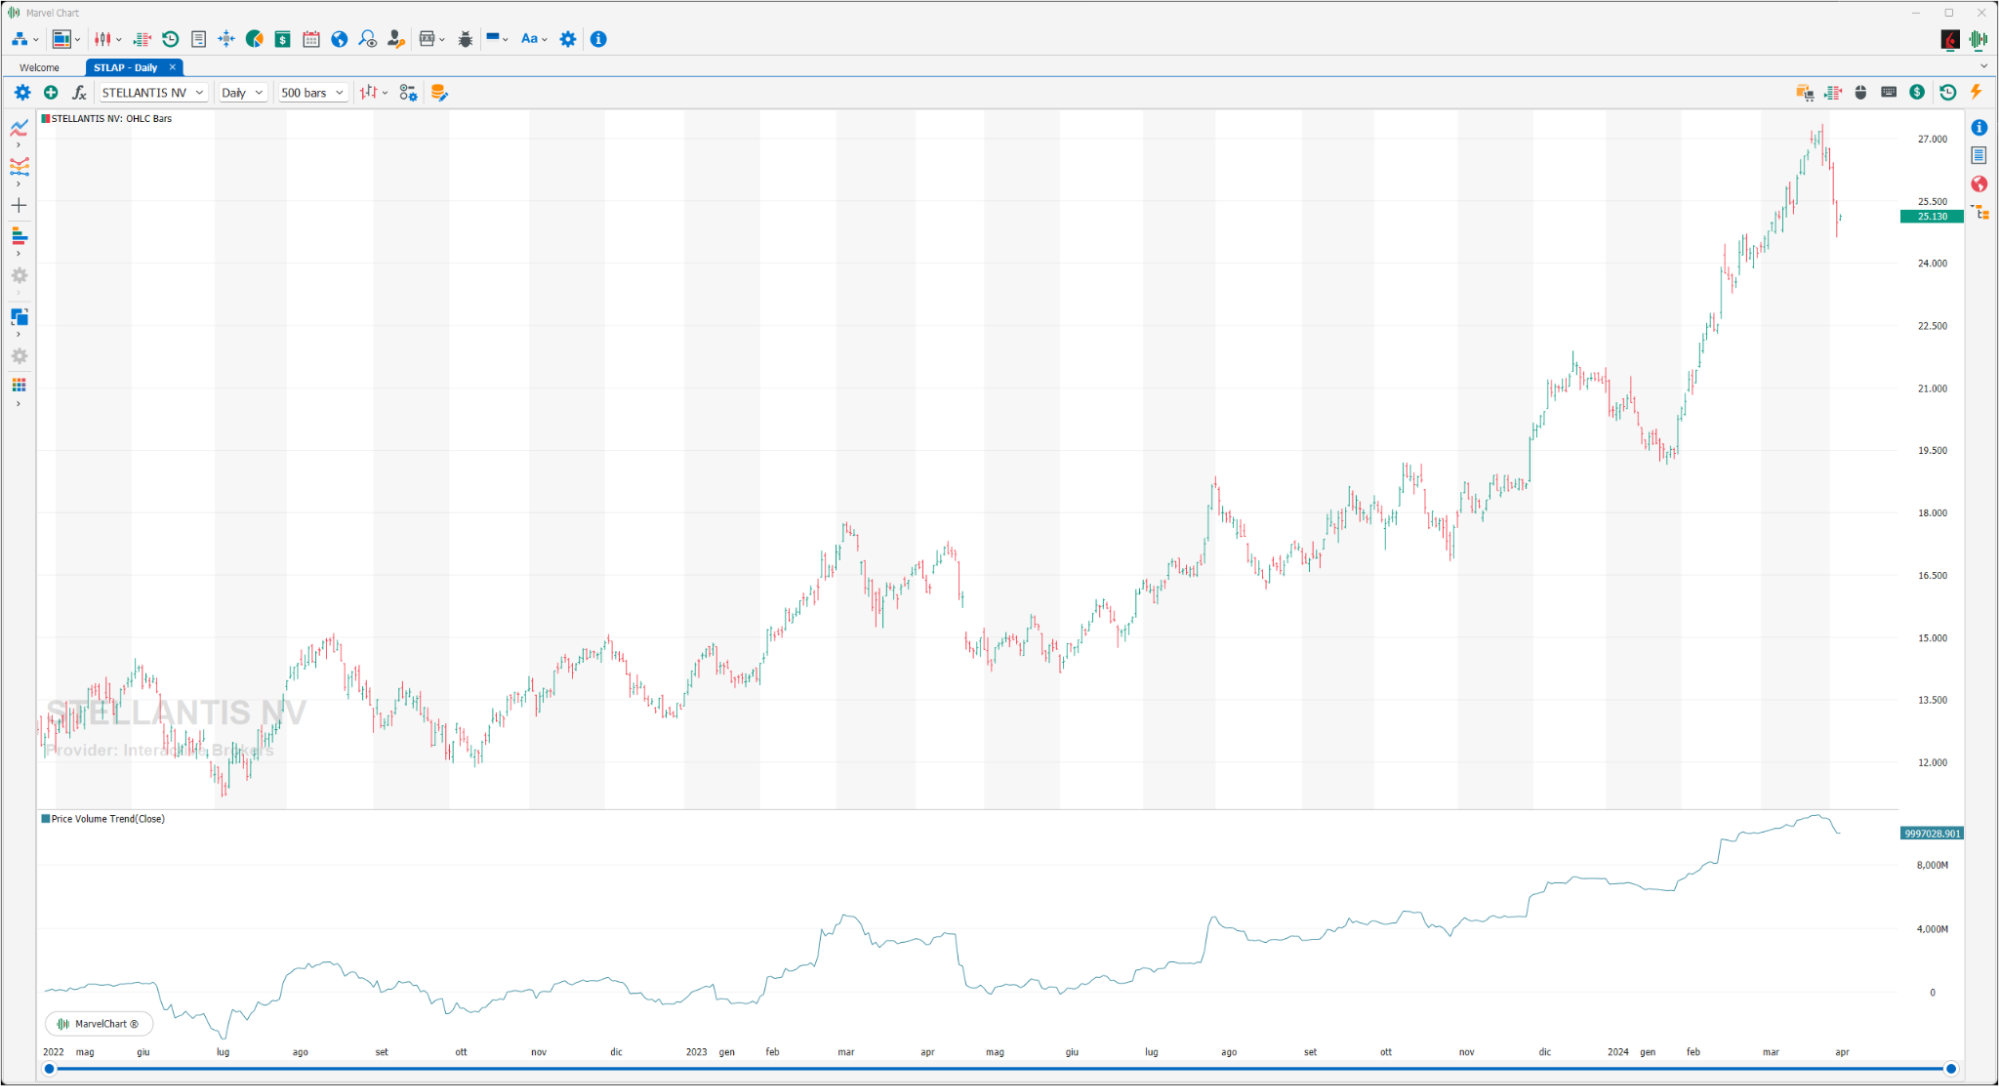
The Price Volume Trend is an indicator that aims to identify the trend of a financial instrument, through a joint analysis of price and volumes. The indicator consists of a cumulative volume line that multiplies the daily volume by the percentage change in the daily price, adding or subtracting it from the value of the indicator of the previous day. An increasing line indicates a positive trend of the stock, while a decreasing line indicates a negative trend.
Relative Volume Standard Deviation
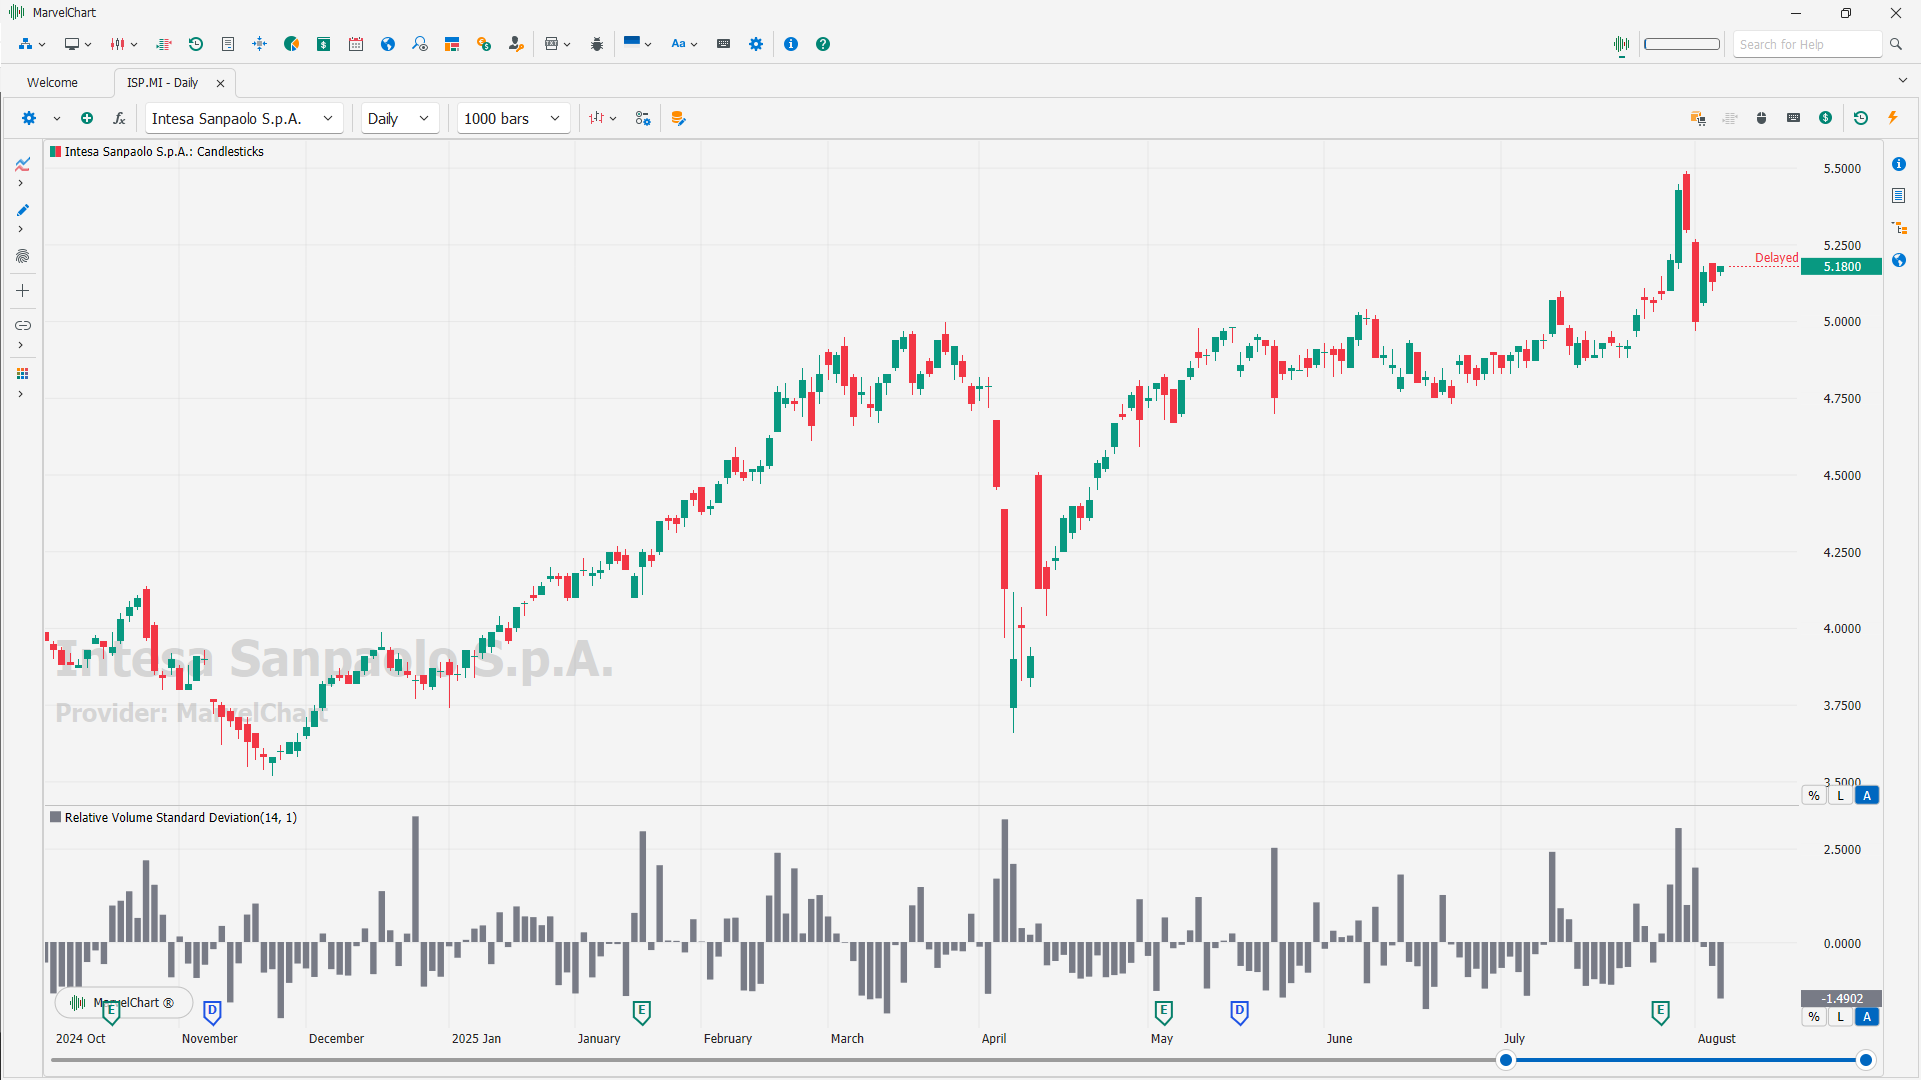
The Relative Volume Standard Deviation indicator measures how a security's trading volume deviates from its moving average, expressed in standard deviations. It helps identify potential support and resistance levels by highlighting unusual volume activity, which can signal shifts in market sentiment. This indicator is particularly useful for traders focused on volume breakout analysis, as it can help identify potential trading opportunities.
What it does
Calculates relative volume: It determines the ratio of current trading volume to its simple moving average (SMA).
Expresses in standard deviations: The ratio is then expressed in terms of standard deviations from the average volume.
Highlights unusual volume: A higher-than-average volume (in standard deviations) suggests increased buying or selling pressure, potentially indicating a defended price line or a breakout.
How it's used
Identifying potential support/resistance
By detecting unusual volume activity, the indicator can help traders identify potential price levels where buying or selling pressure is concentrated.
Confirming breakouts
When a price breaks out of a trading range with increased volume (relative to its average), it can be a strong confirmation signal.
Assessing volume strength
The indicator helps traders gauge the strength of a price move by quantifying the volume behind it.
Filtering trades
Traders can use it to filter out trades with weak volume, focusing on those with strong conviction.
Key parameters
Length: The period used to calculate the moving average of the volume.
Number of Deviations: The number of standard deviations above or below the moving average that are considered significant.
Summary
Ticks Count
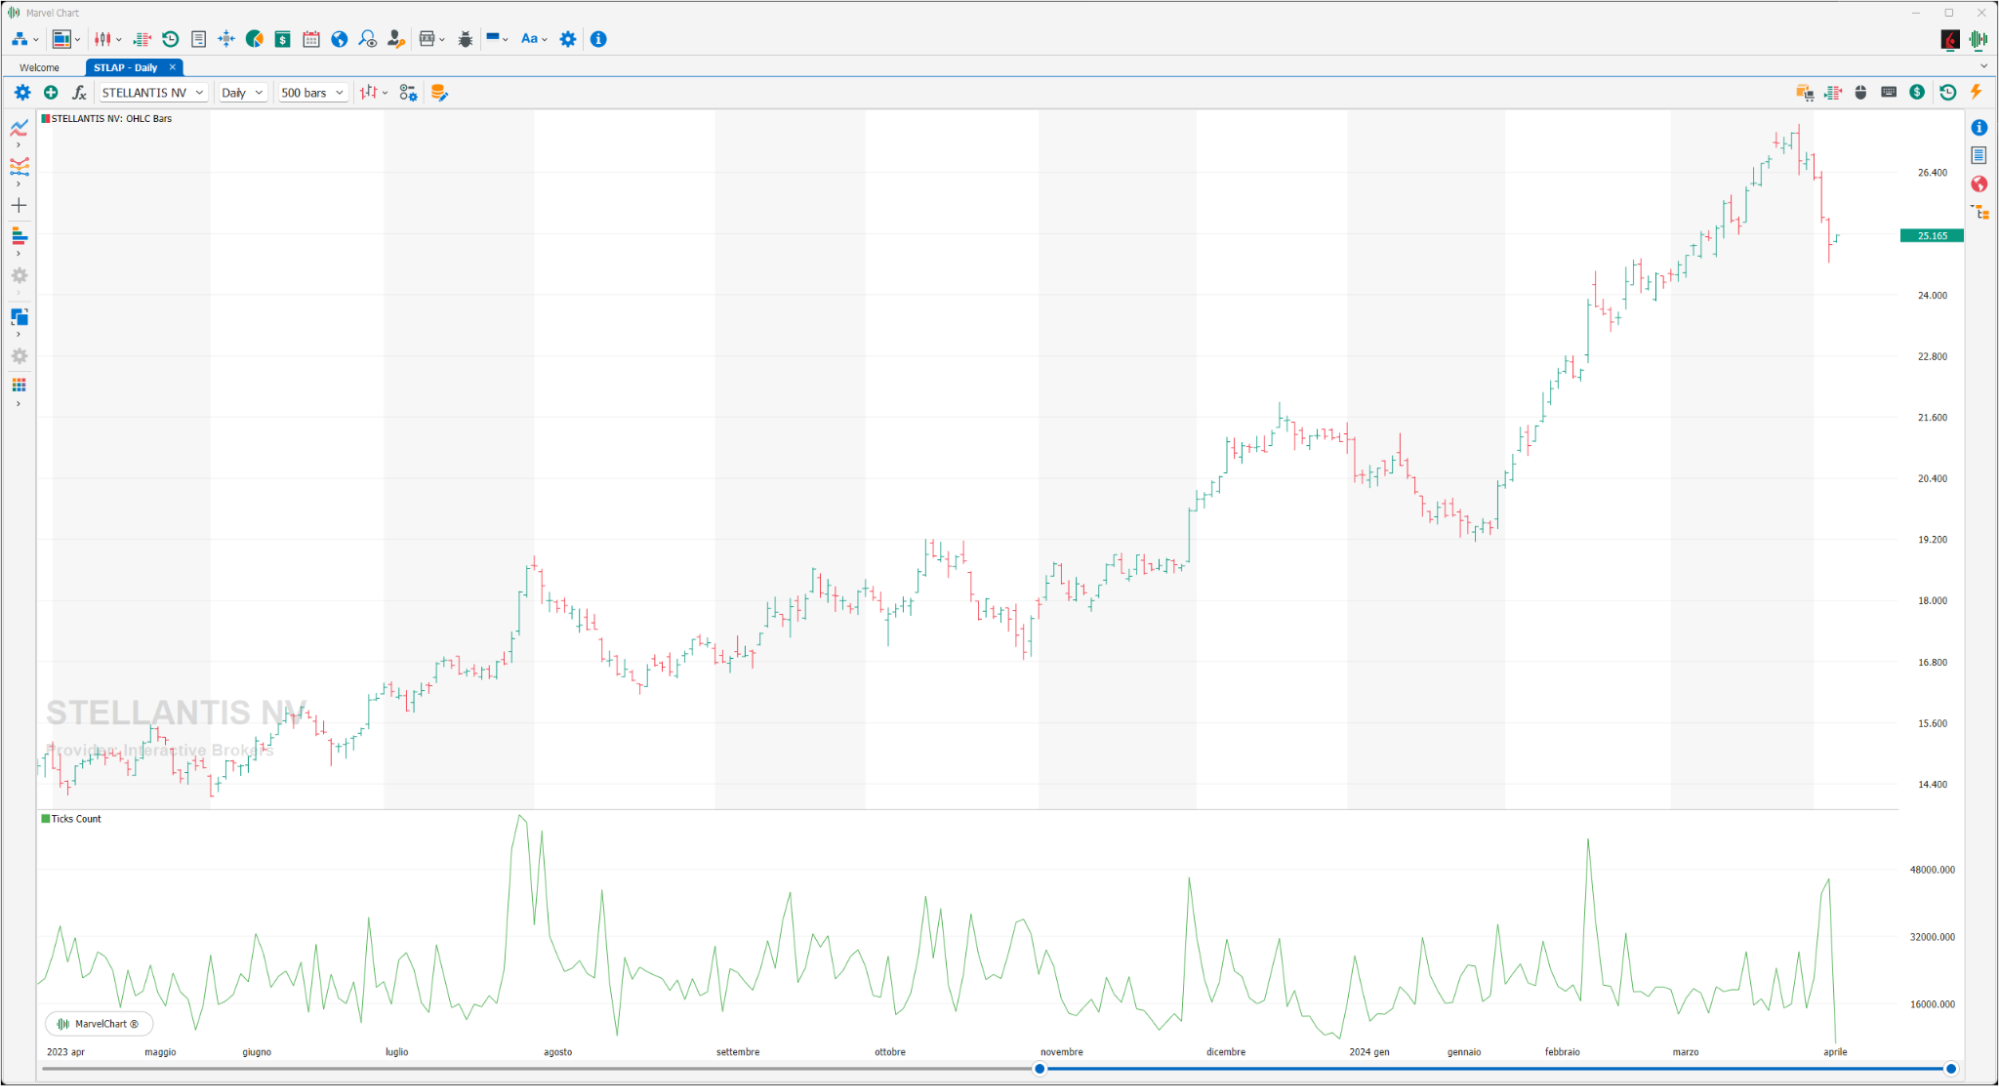
The simple number of trades executed during the trading phases of the assets.
Trade Volume Index
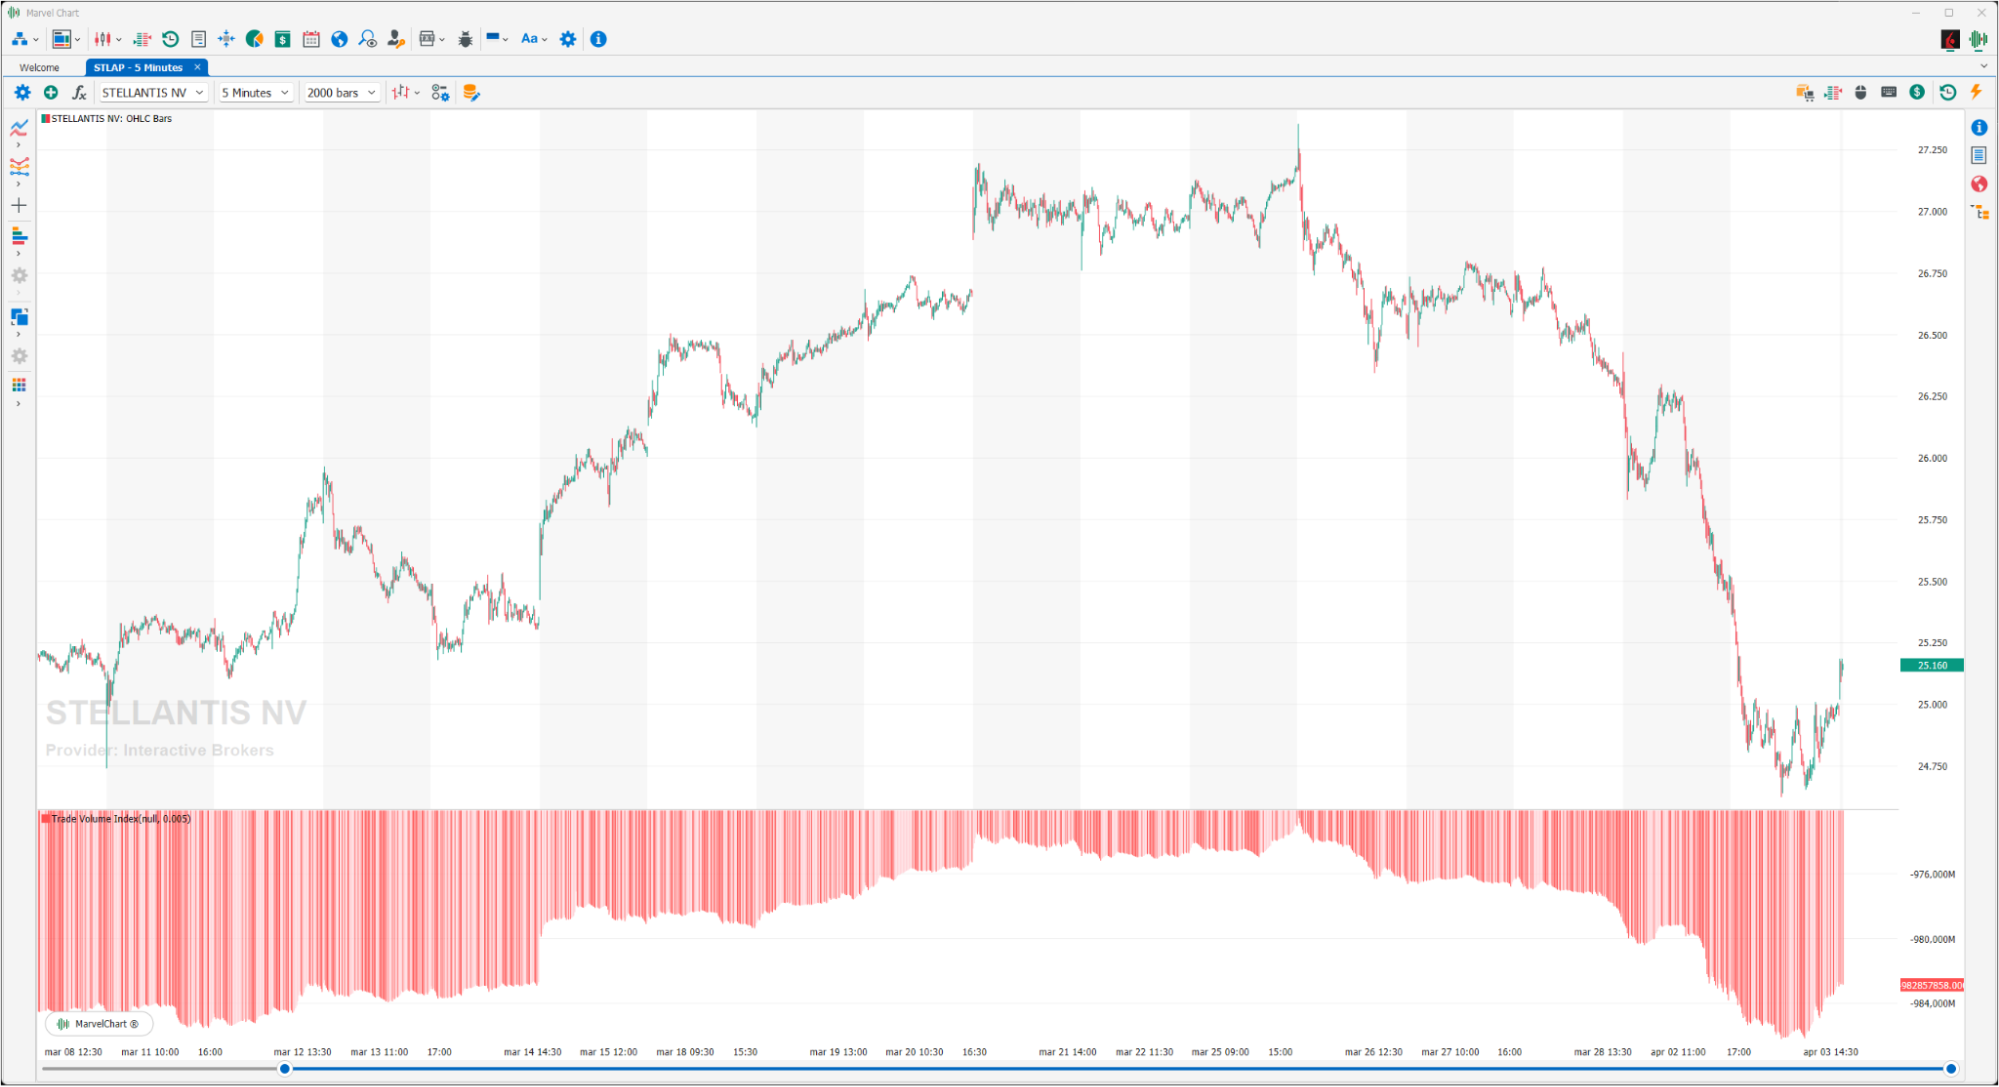
The Trade Volume Index shows whether a security is accumulating or distributing based on the trades that take place on the bid or ask. For this reason, to have an accurate indication, it is used on low time bands, minutes or hours, and only after the trades have started, because otherwise it could not distinguish the historical data transmitted. When the indicator is rising, the market is accumulating. Conversely, when the indicator is falling, the market is distributing. Prices can reverse when the indicator crosses the zero line.
Volume

The simple sum of the volumes traded during the trading phases of the assets.
Volume Accumulation
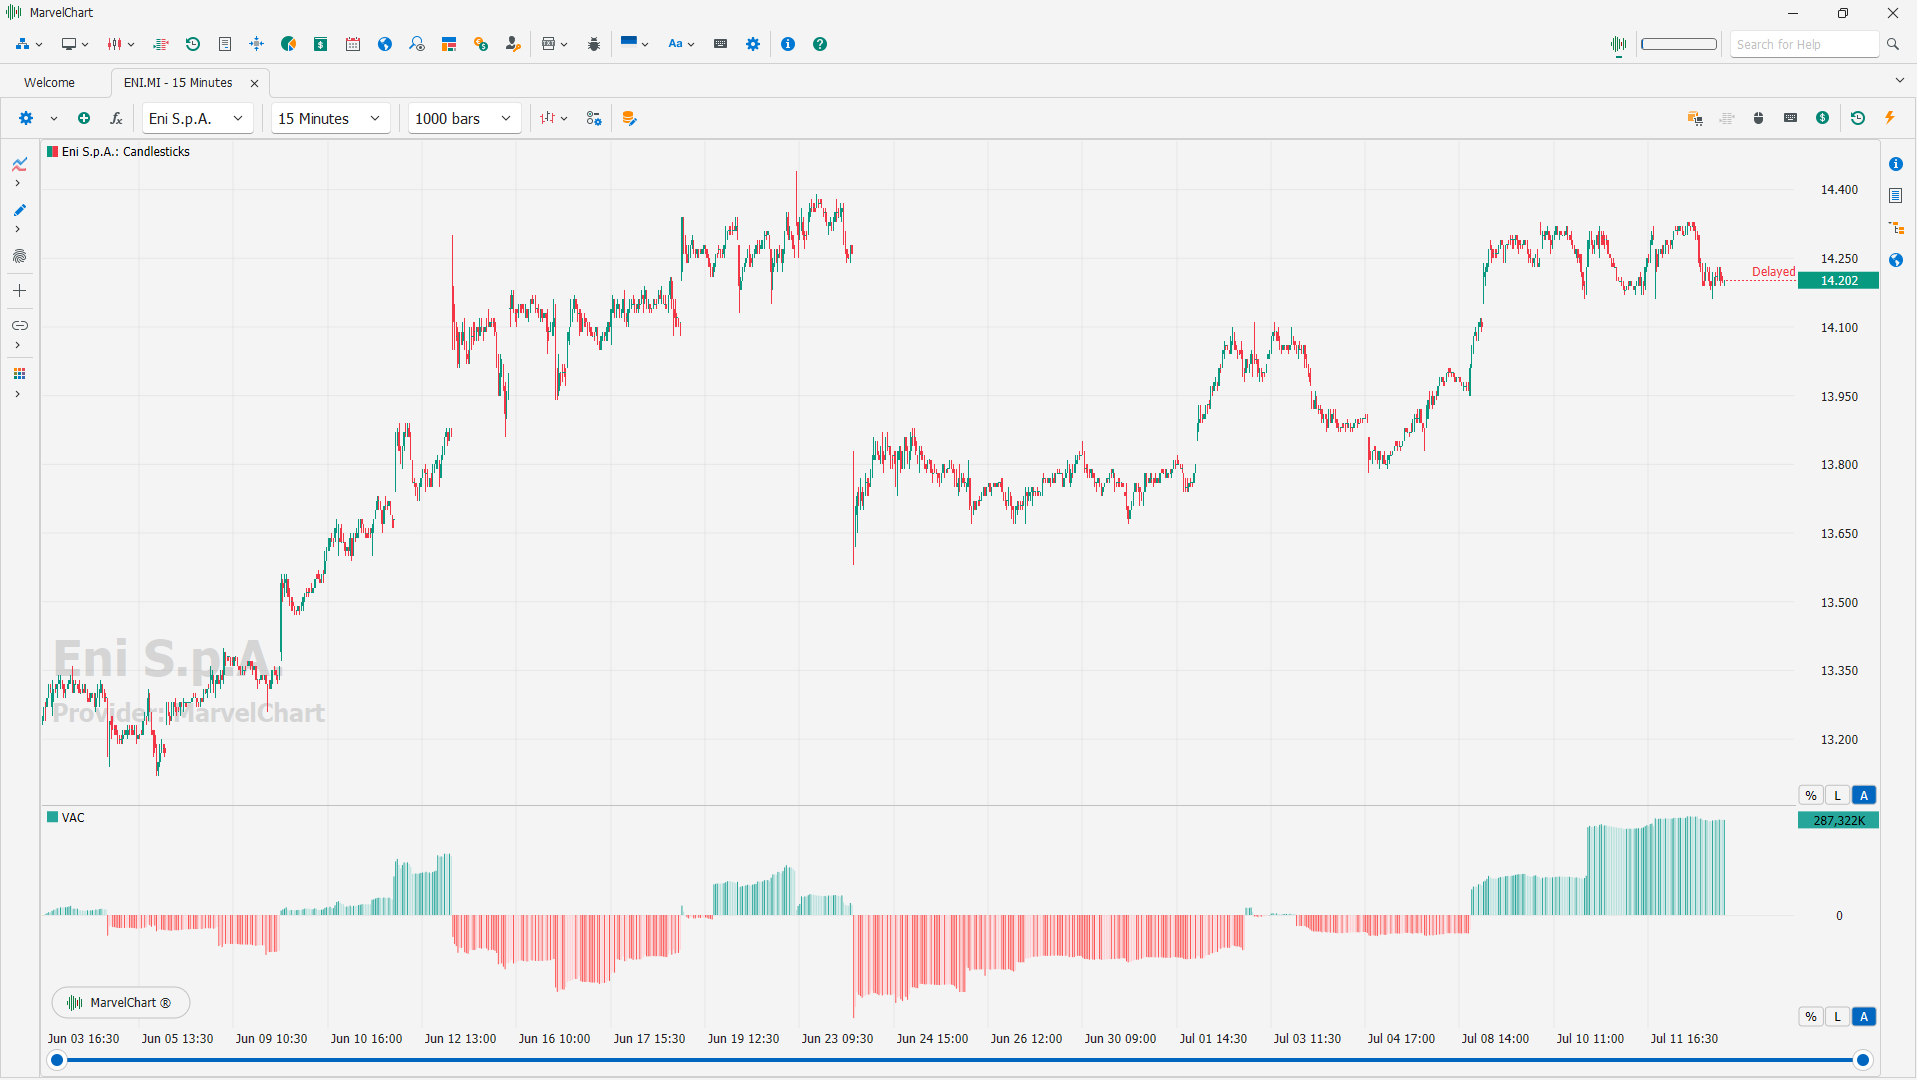
The volume accumulation indicator combines volume and a price-weighting that attempts to show the strength of conviction behind a trend. The volume accumulation indicator might prove useful in uncovering divergences.
The formula to determine volume accumulation: Volume x [Close – (High + Low)/2]
The formula only gives positive volume to the day if the close is higher than the midpoint of the high and low. If the close is towards the lower half of the range of the price action, then volume is negative for the day.
Volume Bar Range Ratio
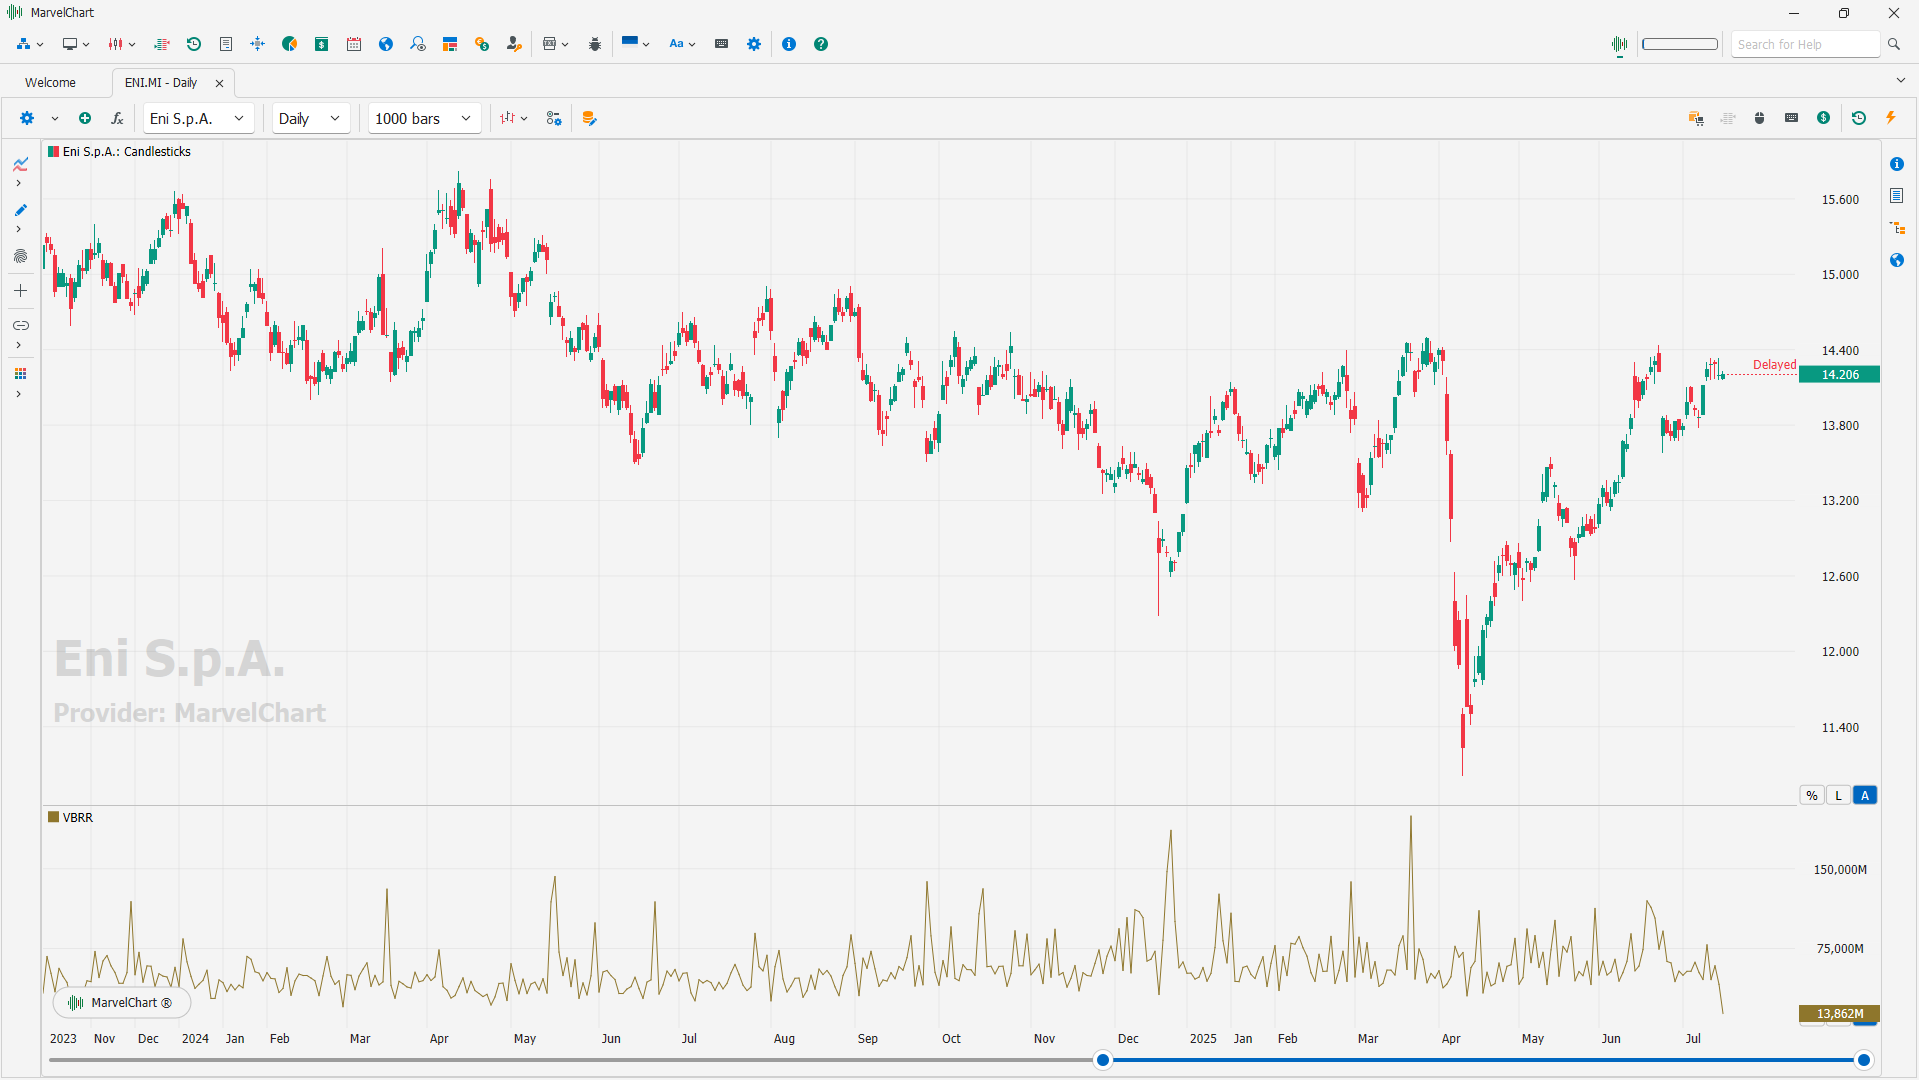
Volume Bar Range Ratio displays the ratio of bar volume to bar height.
Volume Oscillator
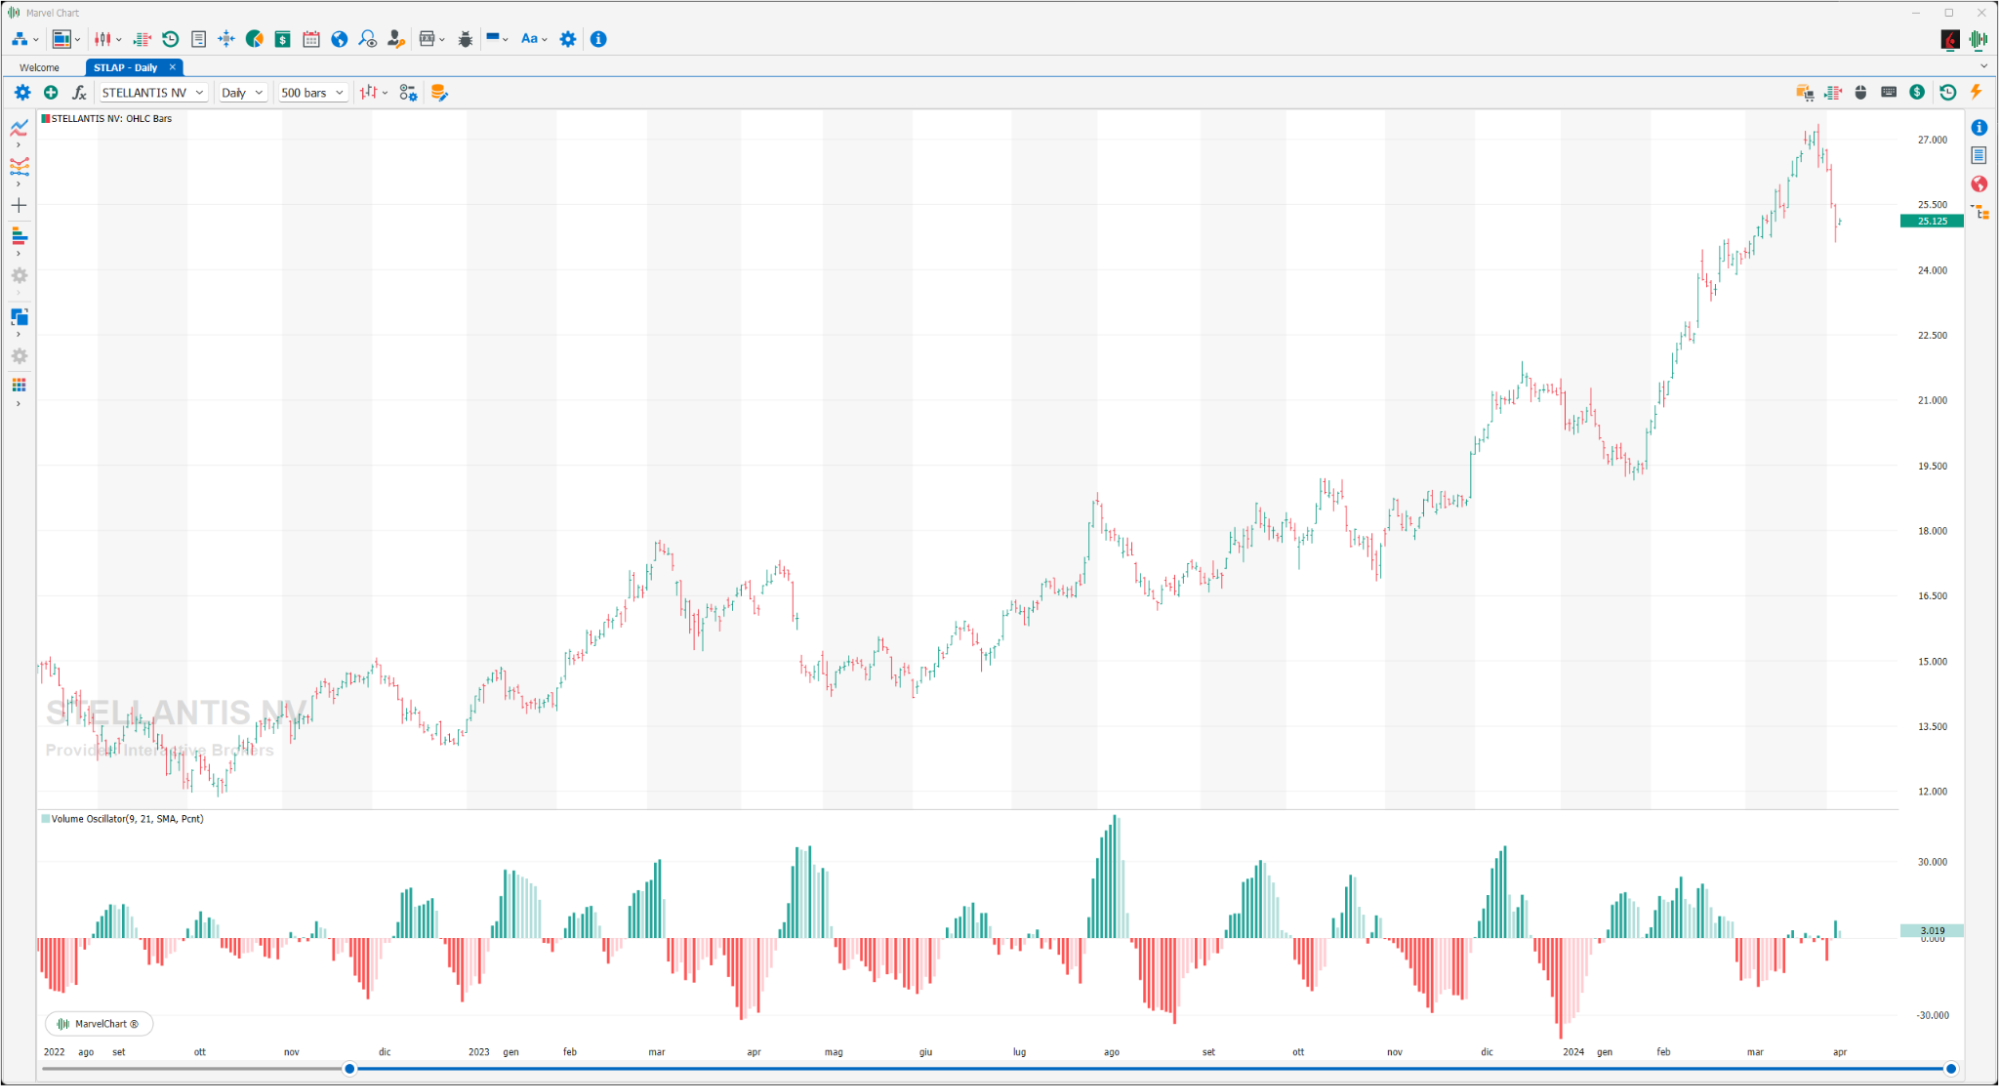
The Volume Oscillator is made up of two "moving averages" on the volumes, a fast one and a slow one. The volume of the fast moving average is subtracted from the slow moving average. The Volume Oscillator is interpreted using the same principles as volume analysis, an increase or decrease in price accompanied by an increase in volume is considered a sign of strength of the prevailing trend. Therefore, when the fast moving average of volumes (9 periods) is above the slow moving average (21 periods), the volume oscillator is above the zero line and confirms the trend, whether it is positive or negative.
Volume Rate Of Change
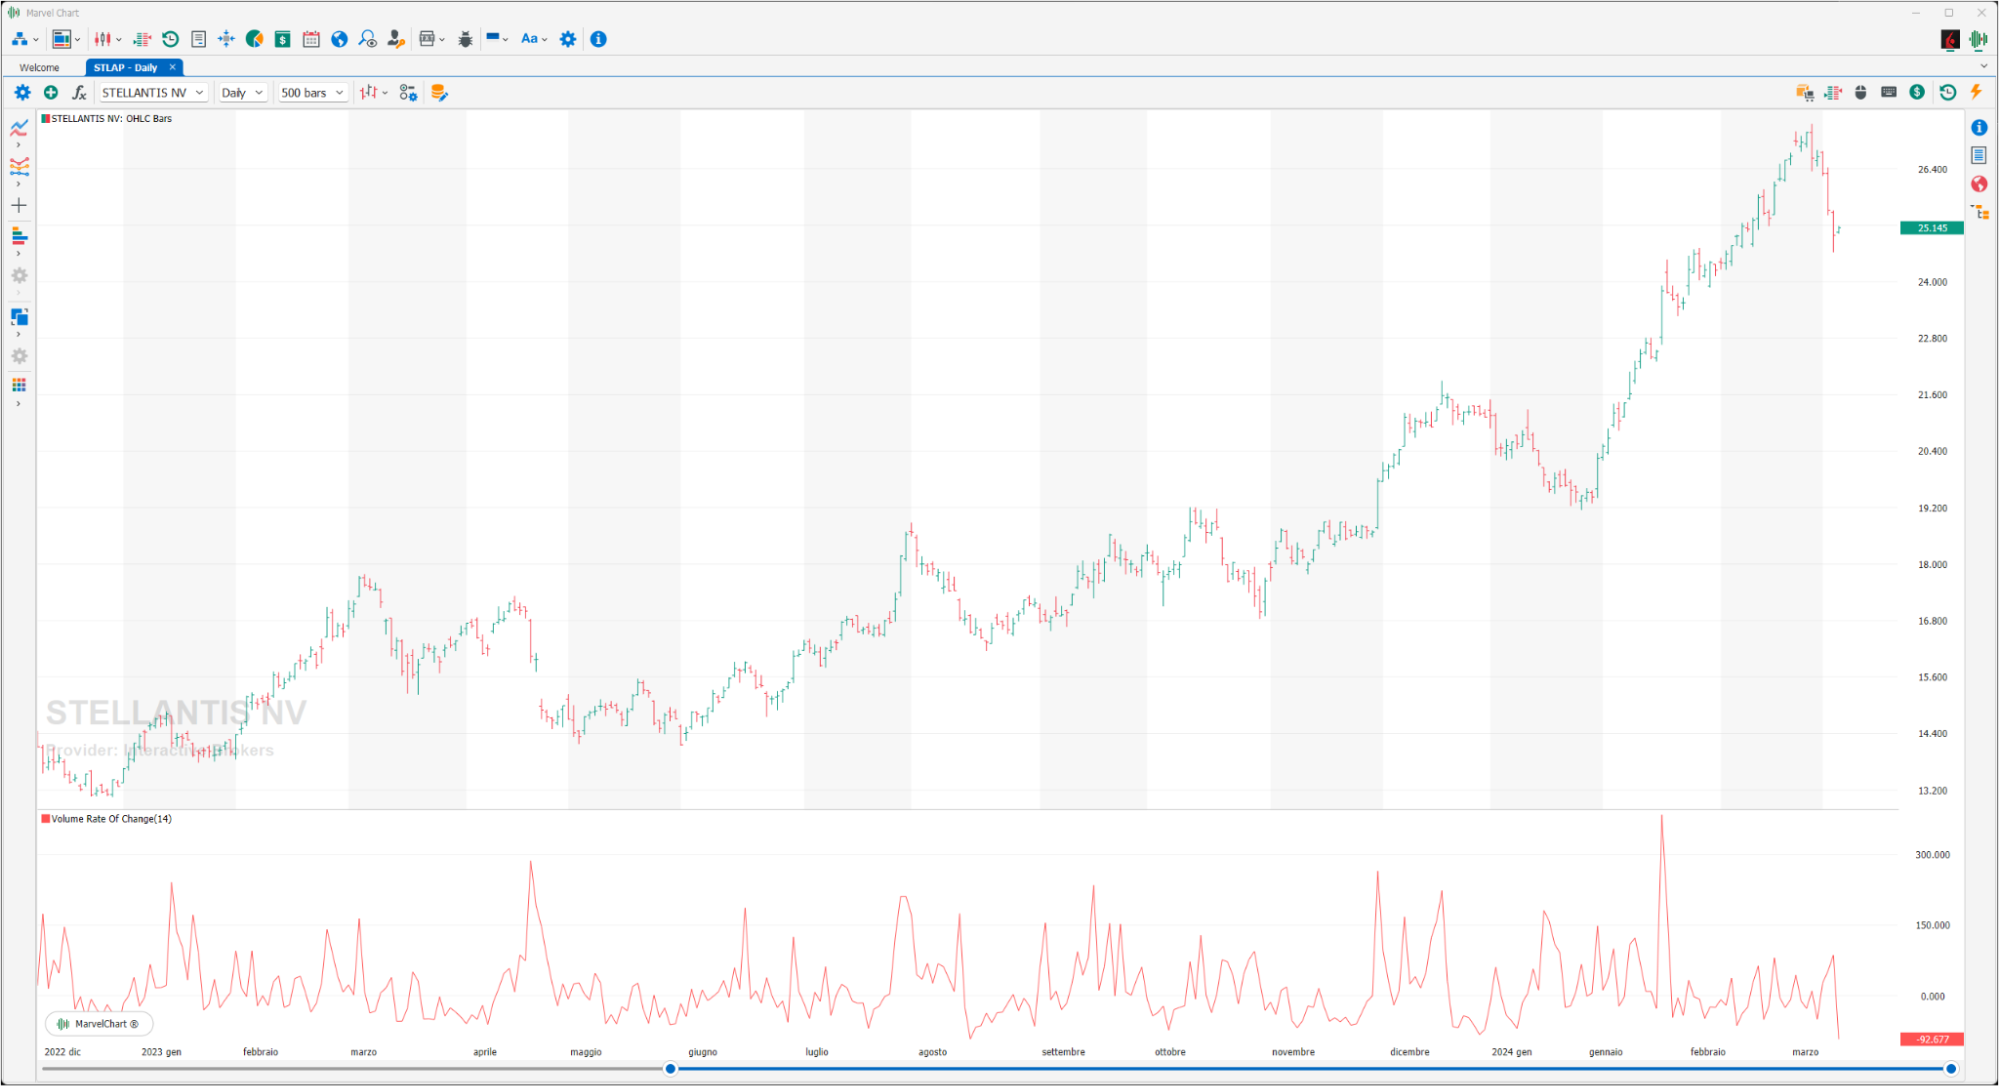
Volume ROC is a technical analysis indicator used to measure the volatility of the volumes of a financial instrument. Volume ROC is calculated in the same way as ROC and differs from it only in that the calculation is made on the volume rather than on the price of the financial instrument. Volume ROC is calculated by dividing the volume of the last “x” periods by the volume of the last “X” periods ago. If today's volume is lower than “x” periods ago, the volume ROC is negative.