Bands and Channels
BoBaO Forecast System
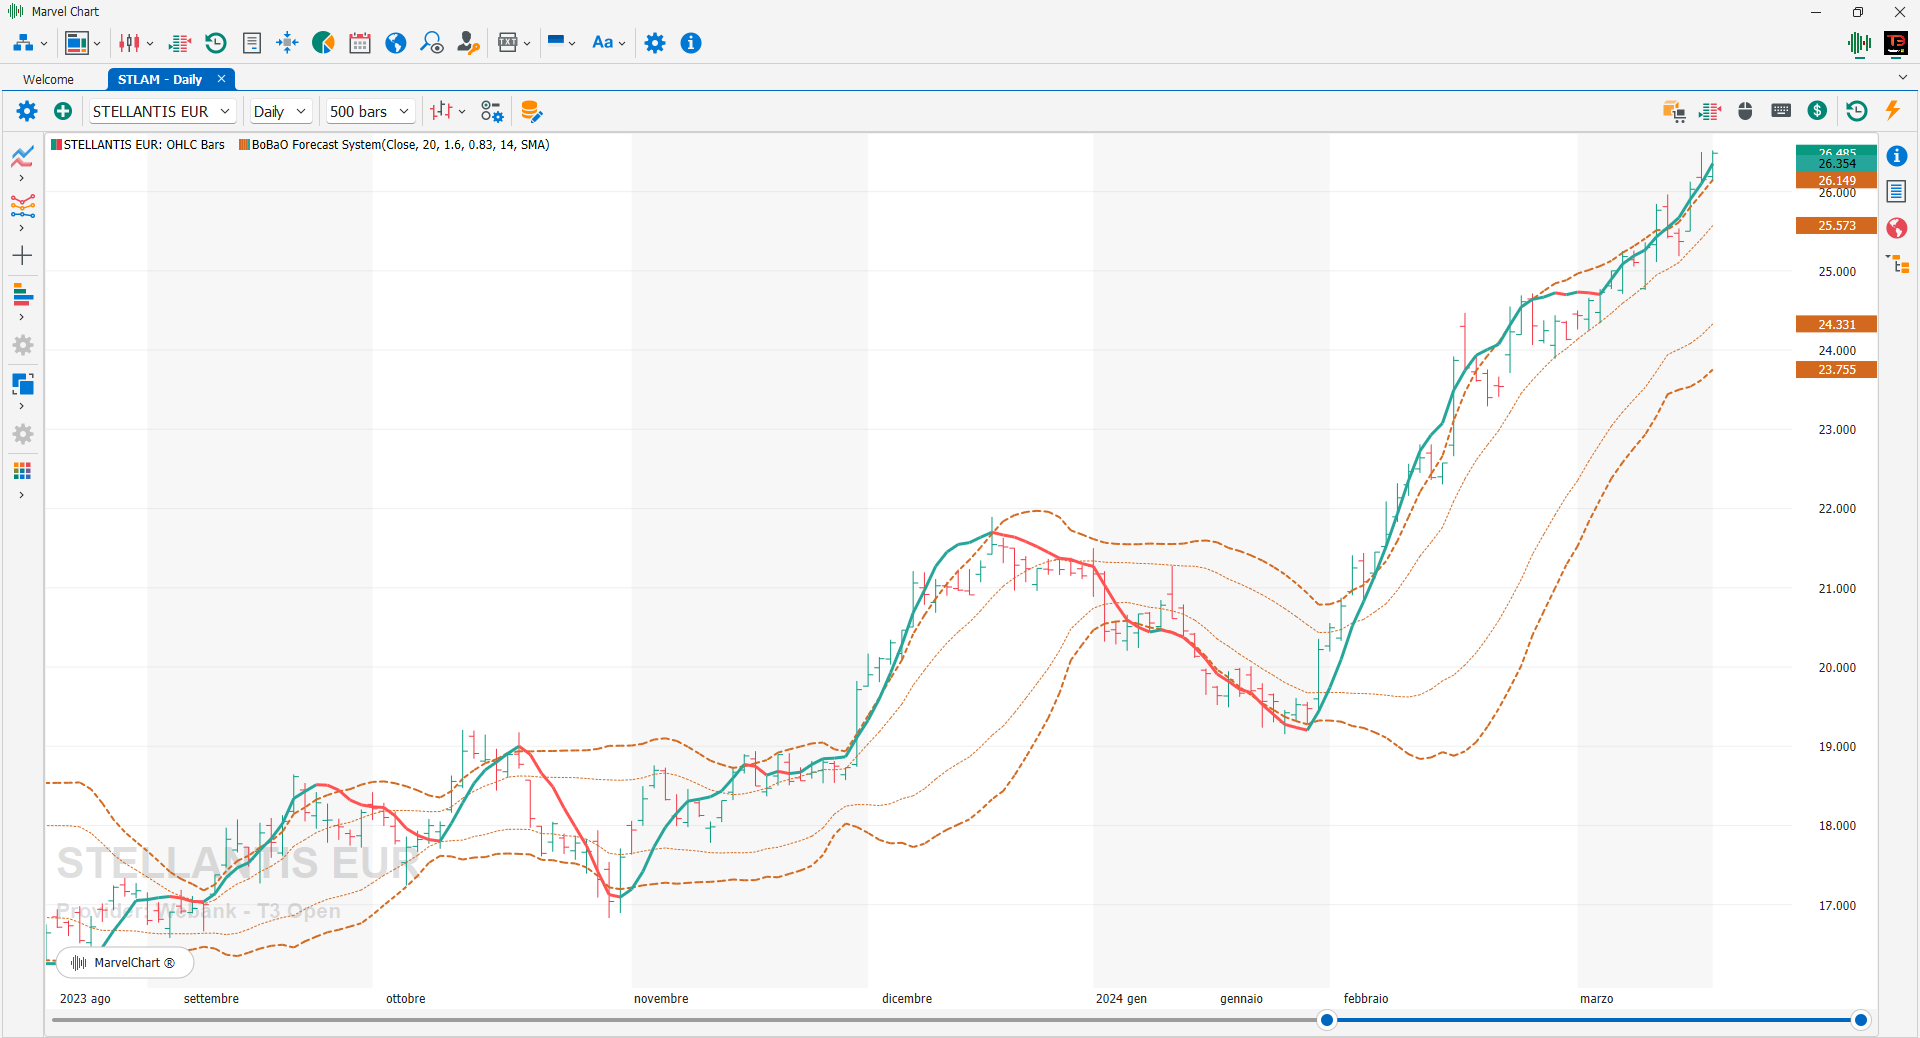
BoBao Forecast System, designed by PlayOptions.it, integrates the mathematical functions of Bollinger Bands with those of Linear Regression. Practically probability (standard deviation) and forecast (linear forecast). The calibration of the Bollinger Bands corresponds to a probability of price containment of 72% in the external bands and 50% in the internal ones. The use is very simple, the signal is generated by the regression line when it crosses one of the two external bands if the upper one is made to pass from high to low a SELL signal is generated, vice versa for the lower one a BUY signal is generated. The two central bands serve to shorten the trader's decision-making path, who will have to declare the signal false if the regression line returns to the band just exceeded, therefore four decision points for a trend.
Bollinger Bands
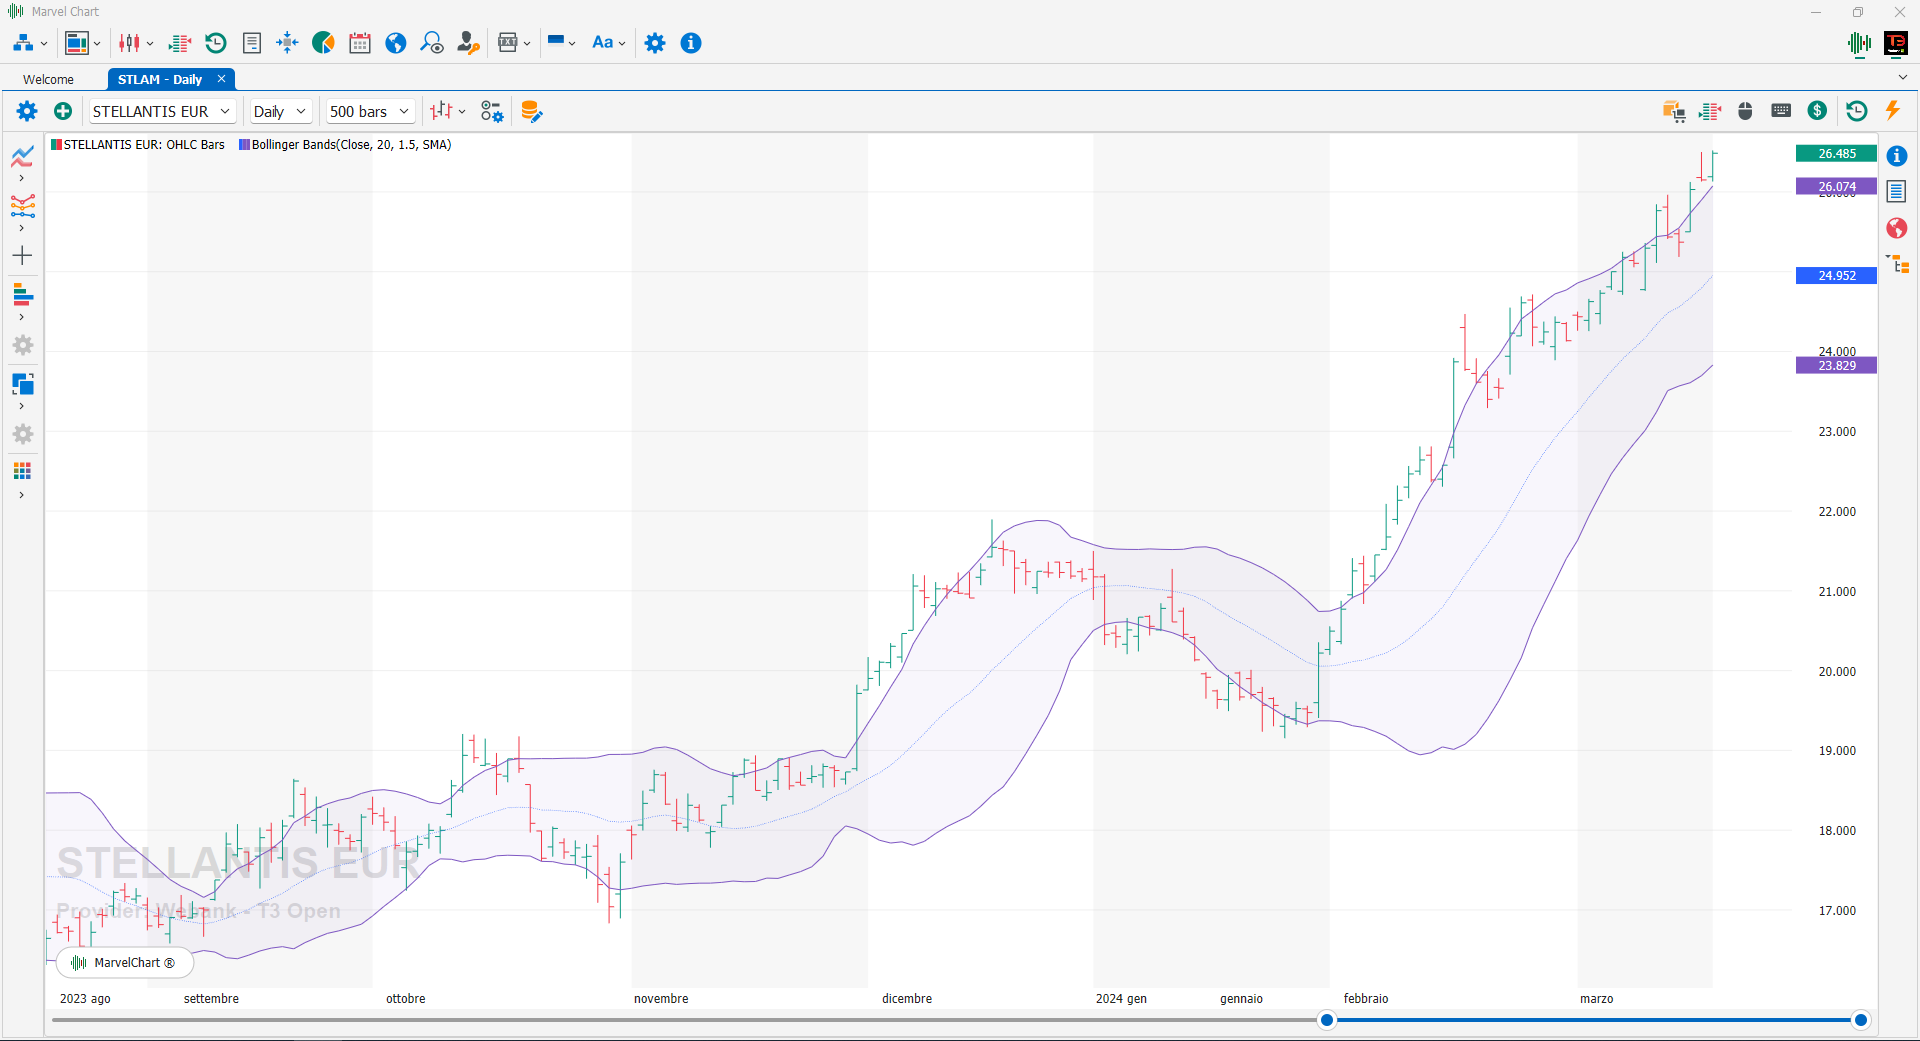
Bollinger Bands are one of the most common indicators in technical analysis, based on the volatility of the asset being analyzed. Volatility can be seen as the standard deviation, statistically defined as the standard deviation or square root of the variance. To calculate Bollinger Bands, we first use a moving average of X days to which the value of the standard deviation is added or subtracted multiplied by a given factor Y. The upper band is then obtained by adding the standard deviation to the moving average Y times. The central band is given by the moving average. The lower band is calculated by subtracting the standard deviation from the Y moving average. A larger bandwidth corresponds to high volatility. A smaller bandwidth corresponds to low volatility. Converging bands represent decreasing volatility. Diverging bands represent increasing volatility. Approximately, from an operational point of view, Bollinger Bands give buy and sell signals when the following conditions are met: SELL: when the price chart exits the upper band and then re-enters it, a rapid increase in price and a subsequent slowdown or adjustment has occurred; BUY: when the price chart exits the lower band and then re-enters it, i.e. the price has fallen very quickly to the point of stopping and probably reversing the trend.
Chande Kroll Stop
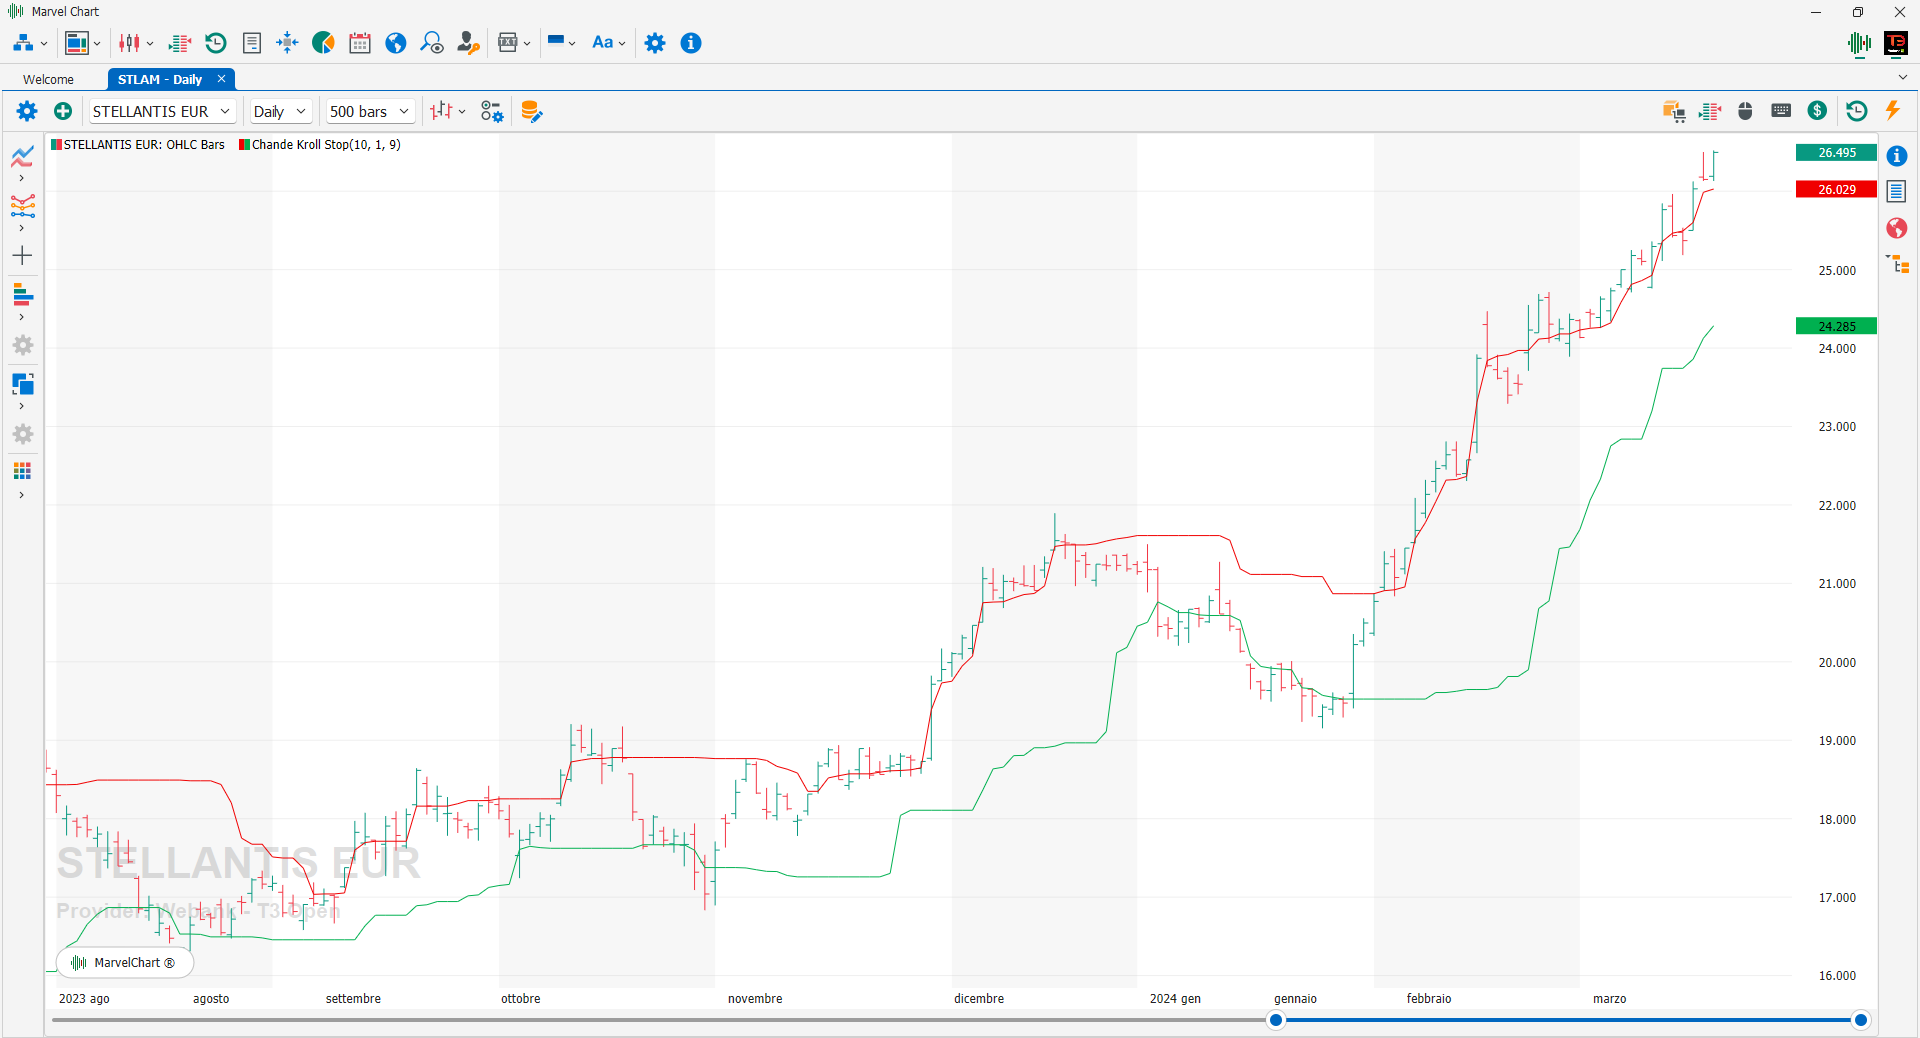
The Chande Kroll Stop indicator is a stop signal for both a short and long position. It appears as a red and green line overlaid on the price chart. The red line represents the stop level for a short position, while the green line represents the stop level for a long position. The Chande Kroll Stop is calculated on the True Range and therefore is labeled as independent of the volatility of the instruments involved.
Donchian Channels
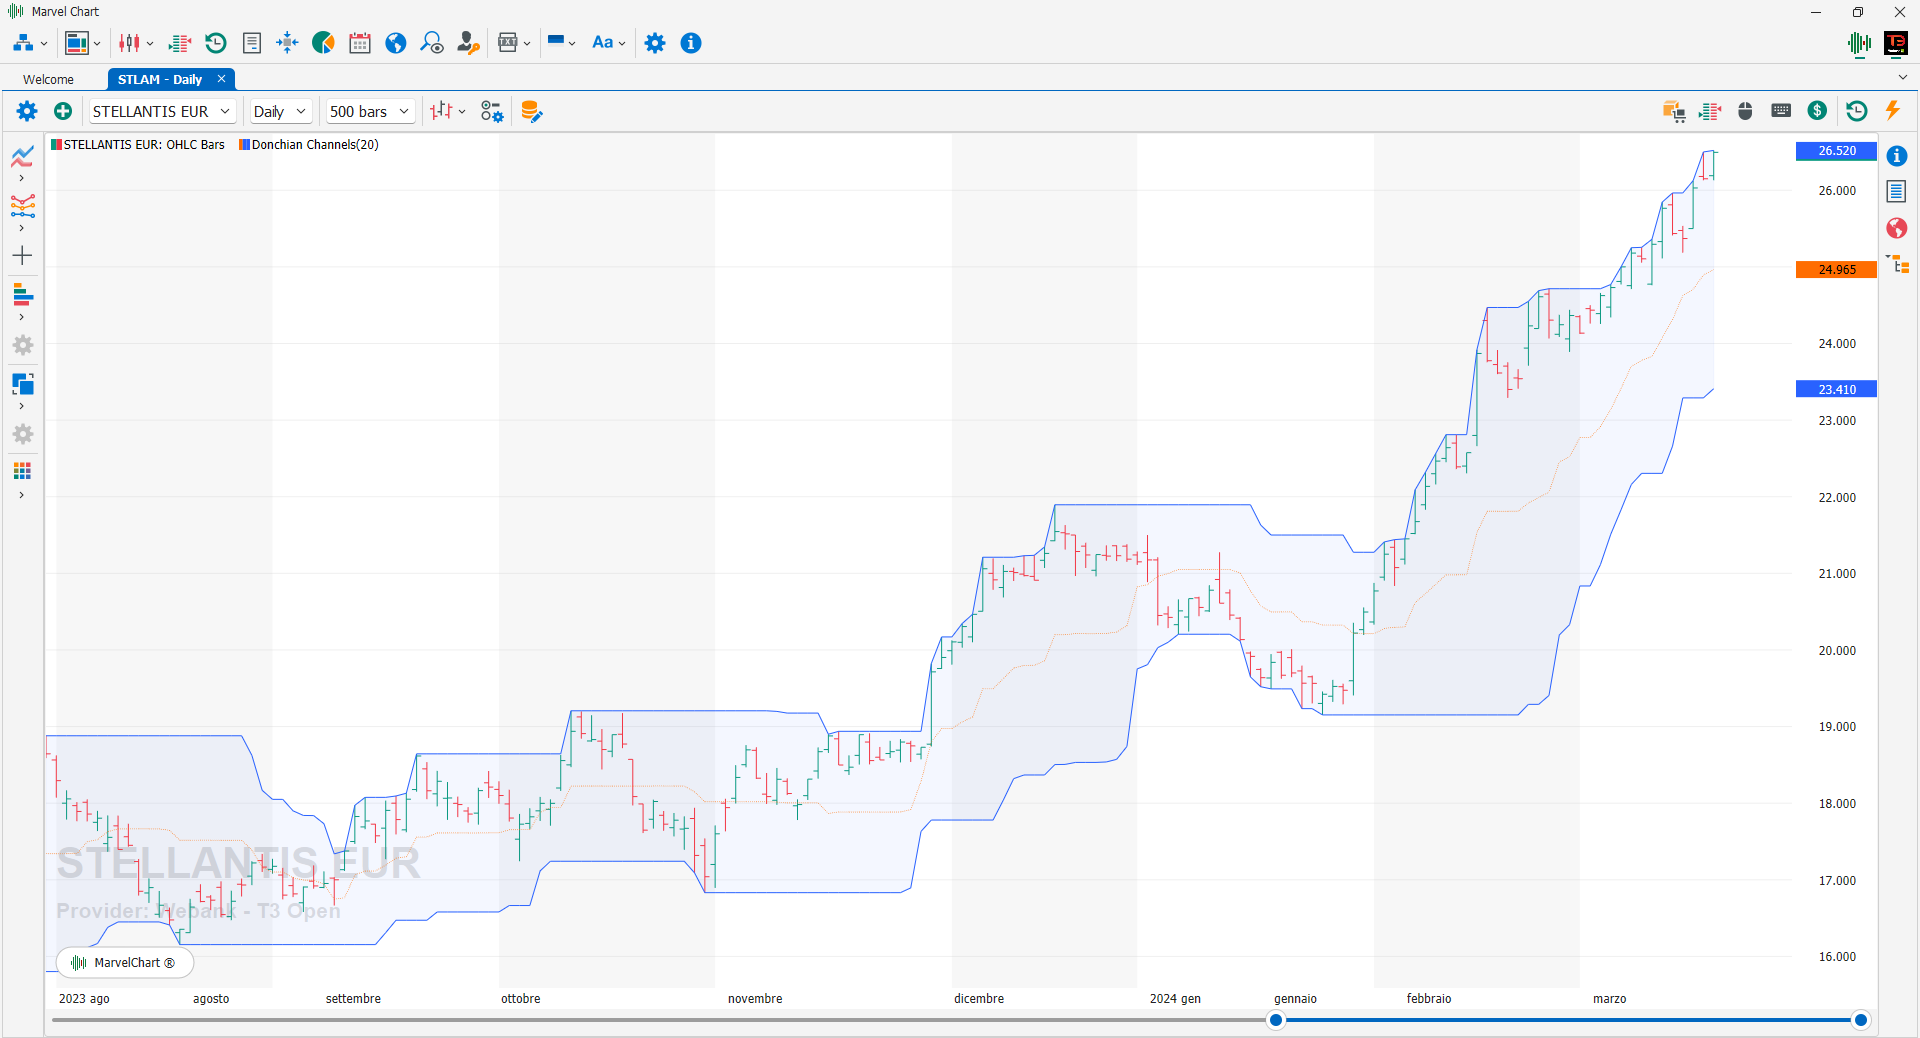
Donchian Channels are used in technical analysis to measure the volatility of a market. It is a banded indicator, similar to Bollinger Bands. In addition to measuring the volatility of a market, Donchian Channels are mainly used to identify potential breakouts or overbought/oversold conditions when the price reaches the upper or lower band. These cases would indicate possible trading signals.
Fractal Chaos Bands
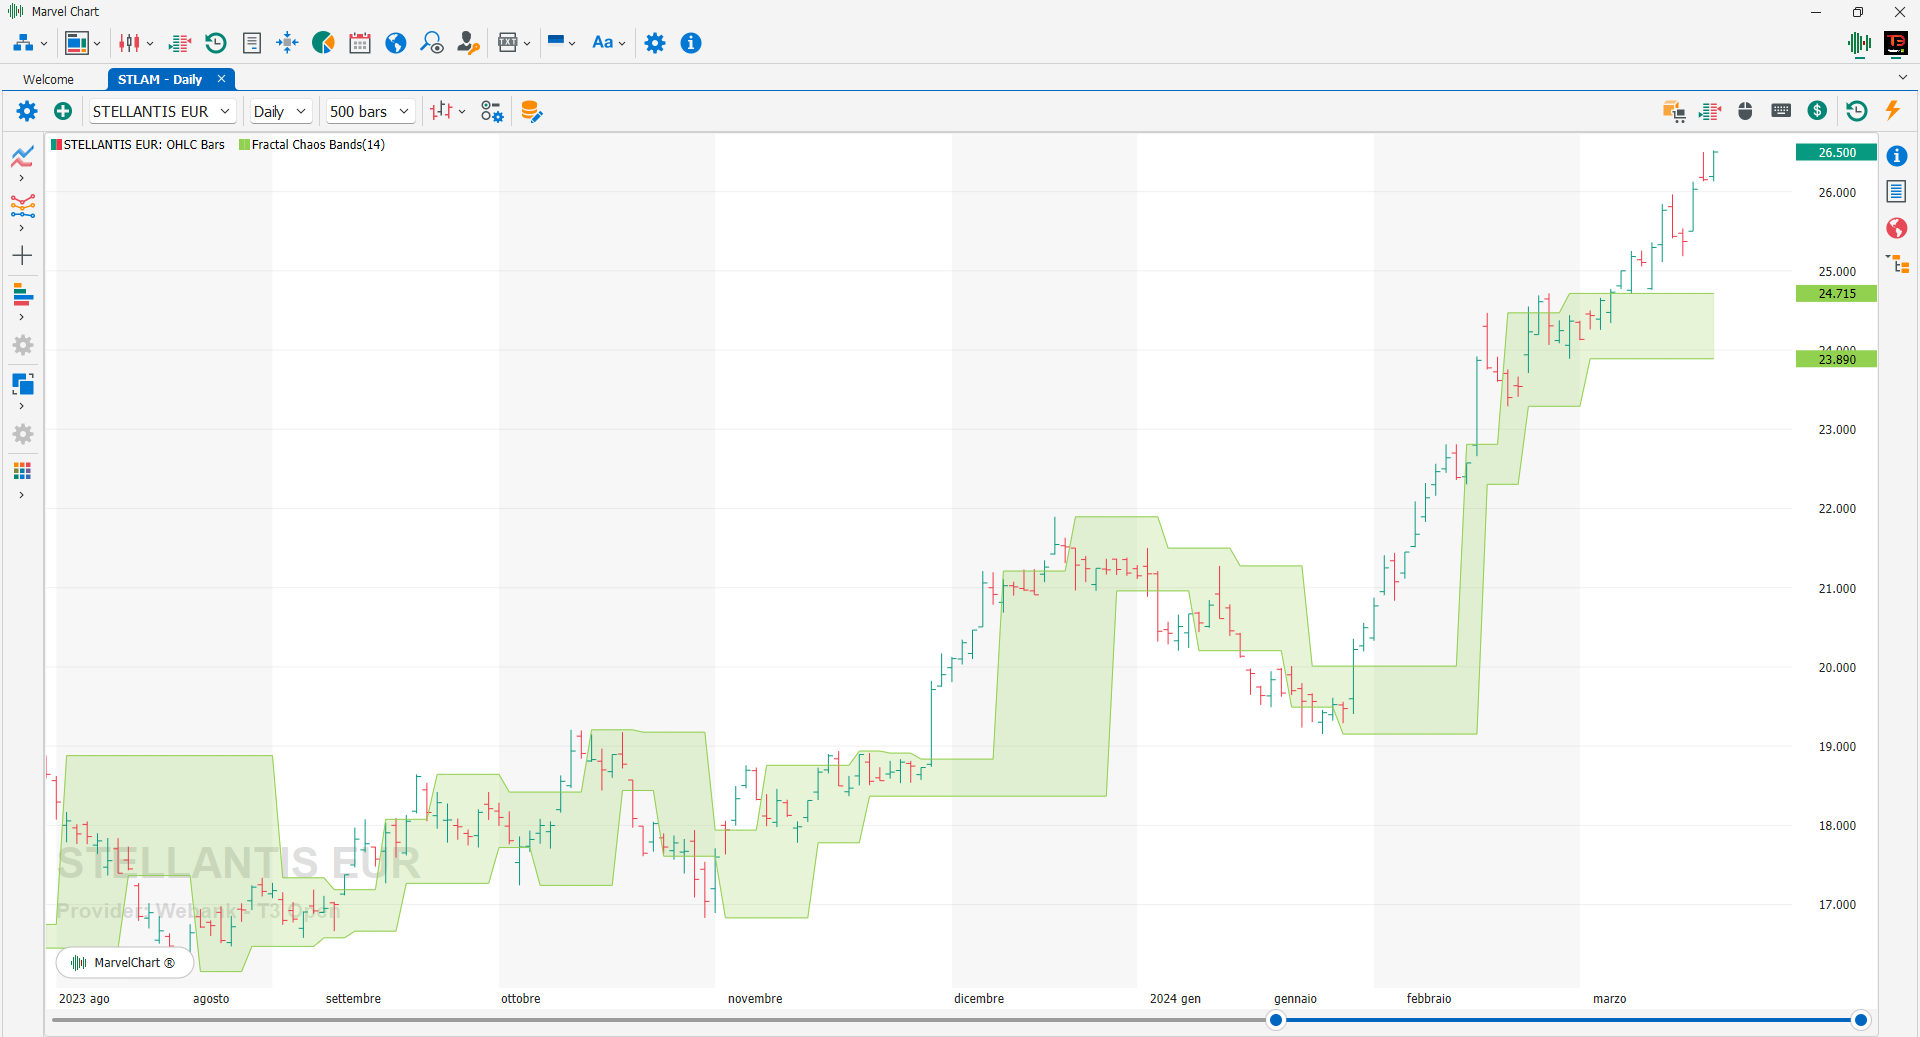
Australian trader Edward William Dreiss was the first to start using fractal geometry as a way to measure asset price movements. Fractals are mathematical tools that essentially break down large trends into extremely easy and predictable patterns, so most traders see them as recurring patterns that can predict reversals in chaotic price movements. This indicator assumes that charts with different time frames are difficult to observe if the time scale of the chart is not available, the charts look the same no matter what the time frame is, the only difference is the time frame. Fractal Chaos Bands can be used to determine what is happening with the currently set time frame and are a great indicator to use in intraday trading. The stock market moves in a chaotic way, but observing it with a higher time horizon, the movements follow a certain pattern that can be applied to more or less long periods of time and therefore we can use the Fractal Chaos Bands to identify those patterns and detect when the market is unstable, lateral or in trend.
High-Low Bands
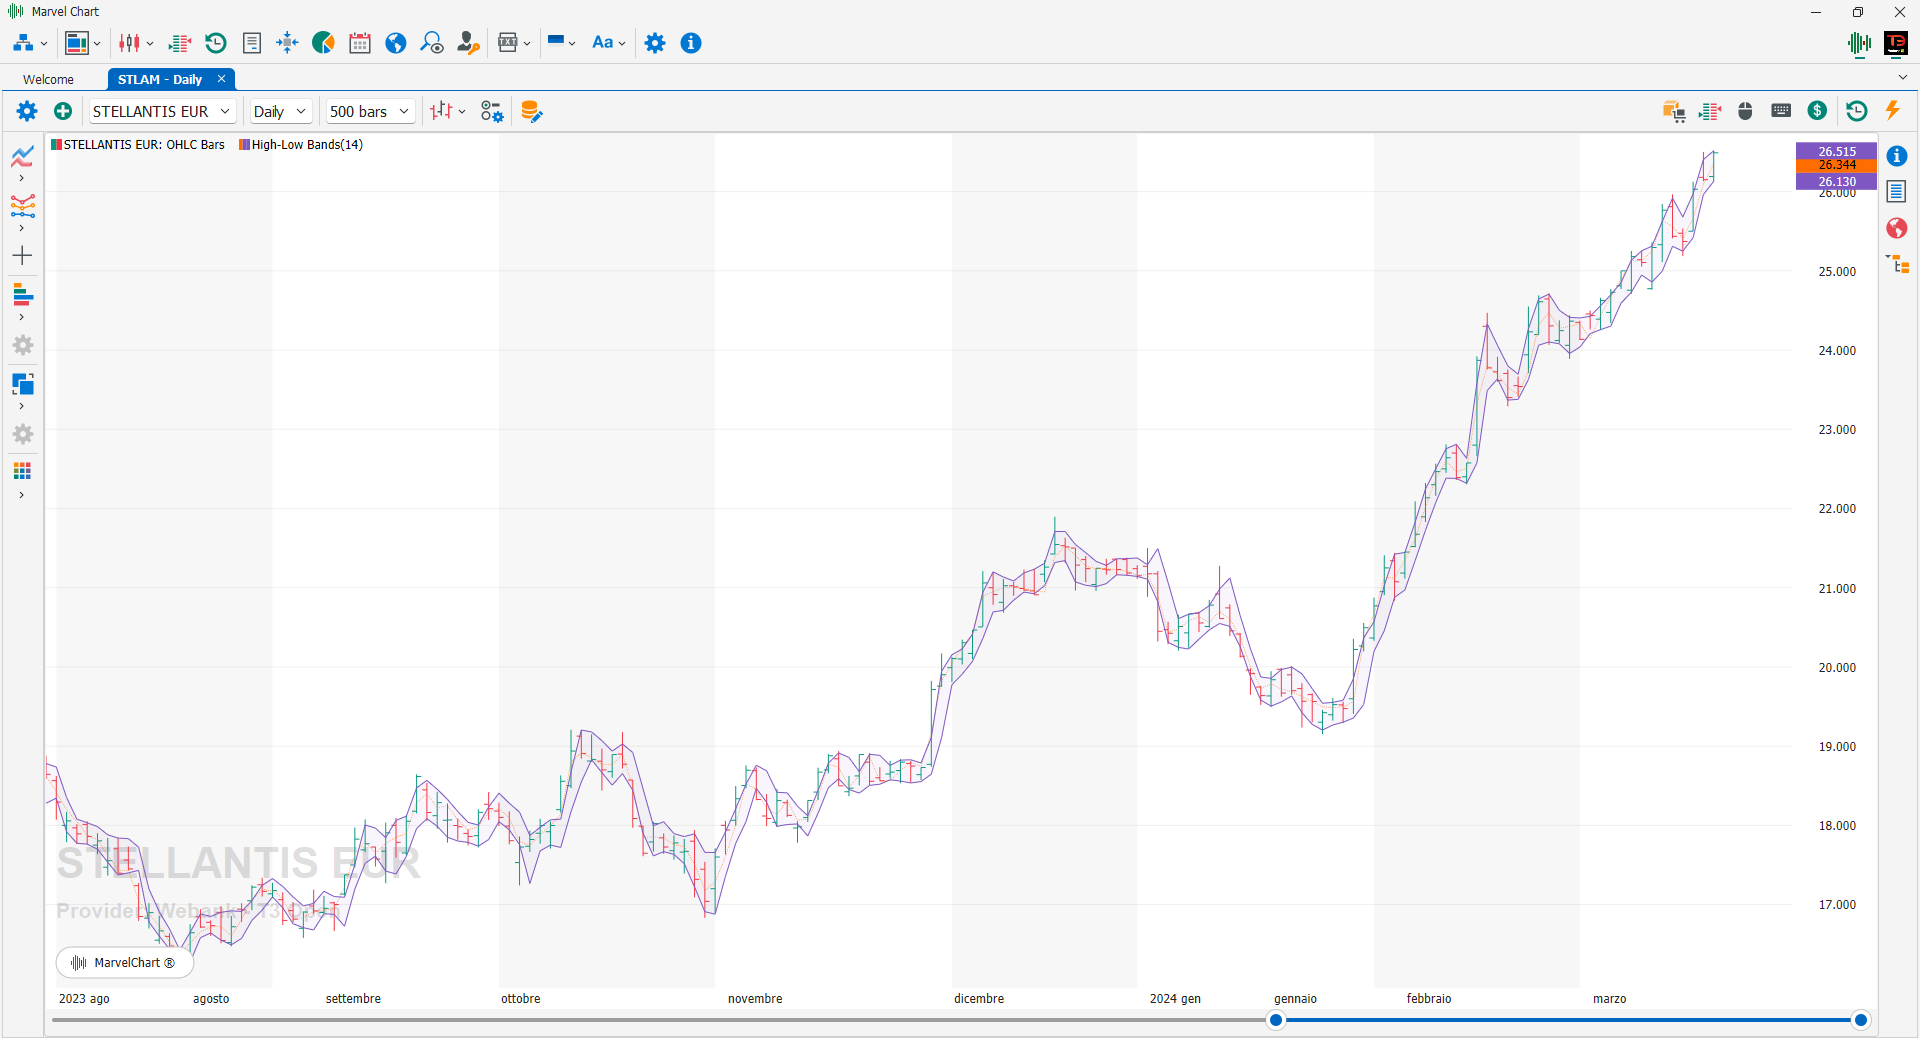
The High-Low Bands indicator is composed of the triangular moving average of a particular asset. To begin with, the triangular moving average is calculated for a specific period of time. Now, this triangular moving average is moved up and down by a specific percentage based on the trader's preference. The two bands, thus formed, are called Low and High respectively. Generally, trades take place within this range most of the time. When the asset breaks out of the band to the downside, a short signal is generated. If the underlying asset breaks out of the high band to the upside, a long signal is generated.
Ichimoku Cloud
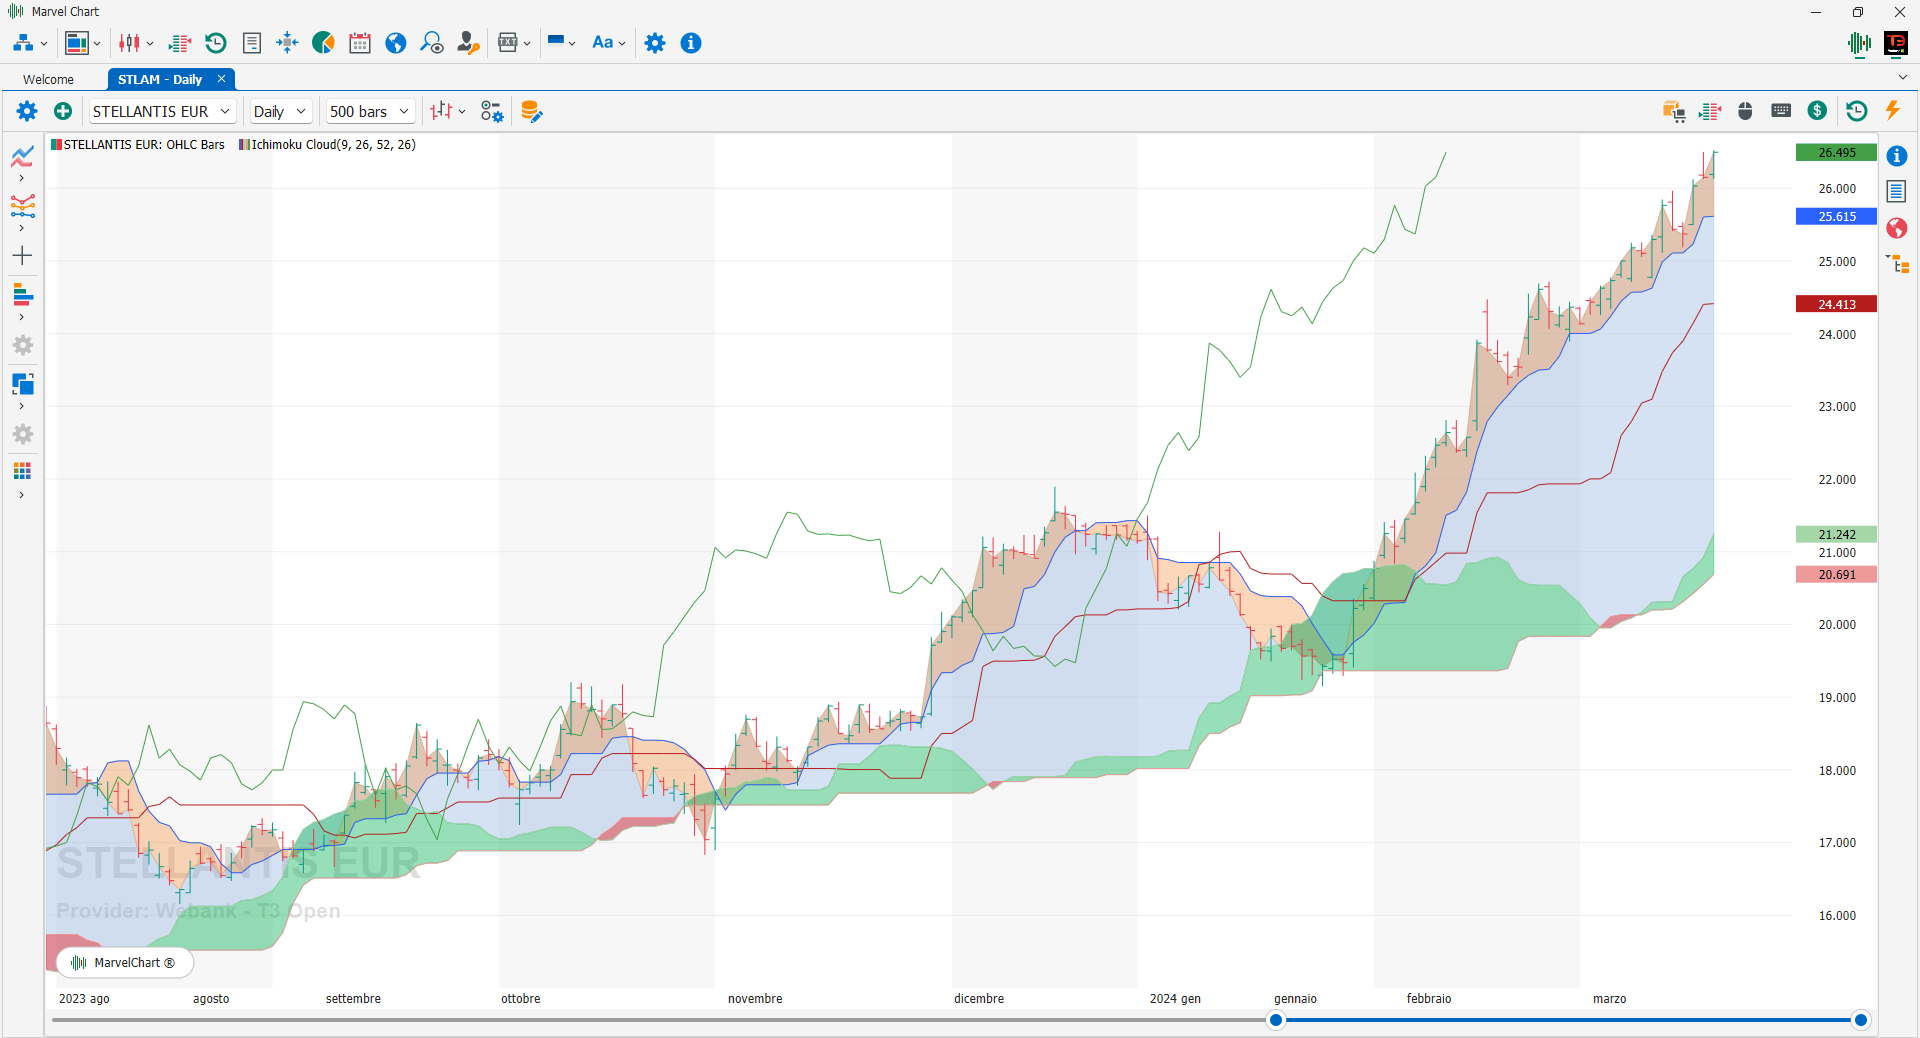
The Ichimoku Cloud, also called Ichimoku Kinko Hyo, is a popular and flexible indicator that shows support and resistance, momentum and trend direction for a security. It provides a clearer picture of price action at a glance. It can identify the direction of a trend, gauge momentum and signal trading opportunities based on line crossovers and where the price is relative to these lines. These signals help traders find the most optimal entry and exit points. The indicator consists of five lines (each representing a different time frame) and was developed by Goichi Hosoda, a journalist who spent a long time improving this technical analysis technique before sharing it publicly in the late 1960s.
Keltner Channel
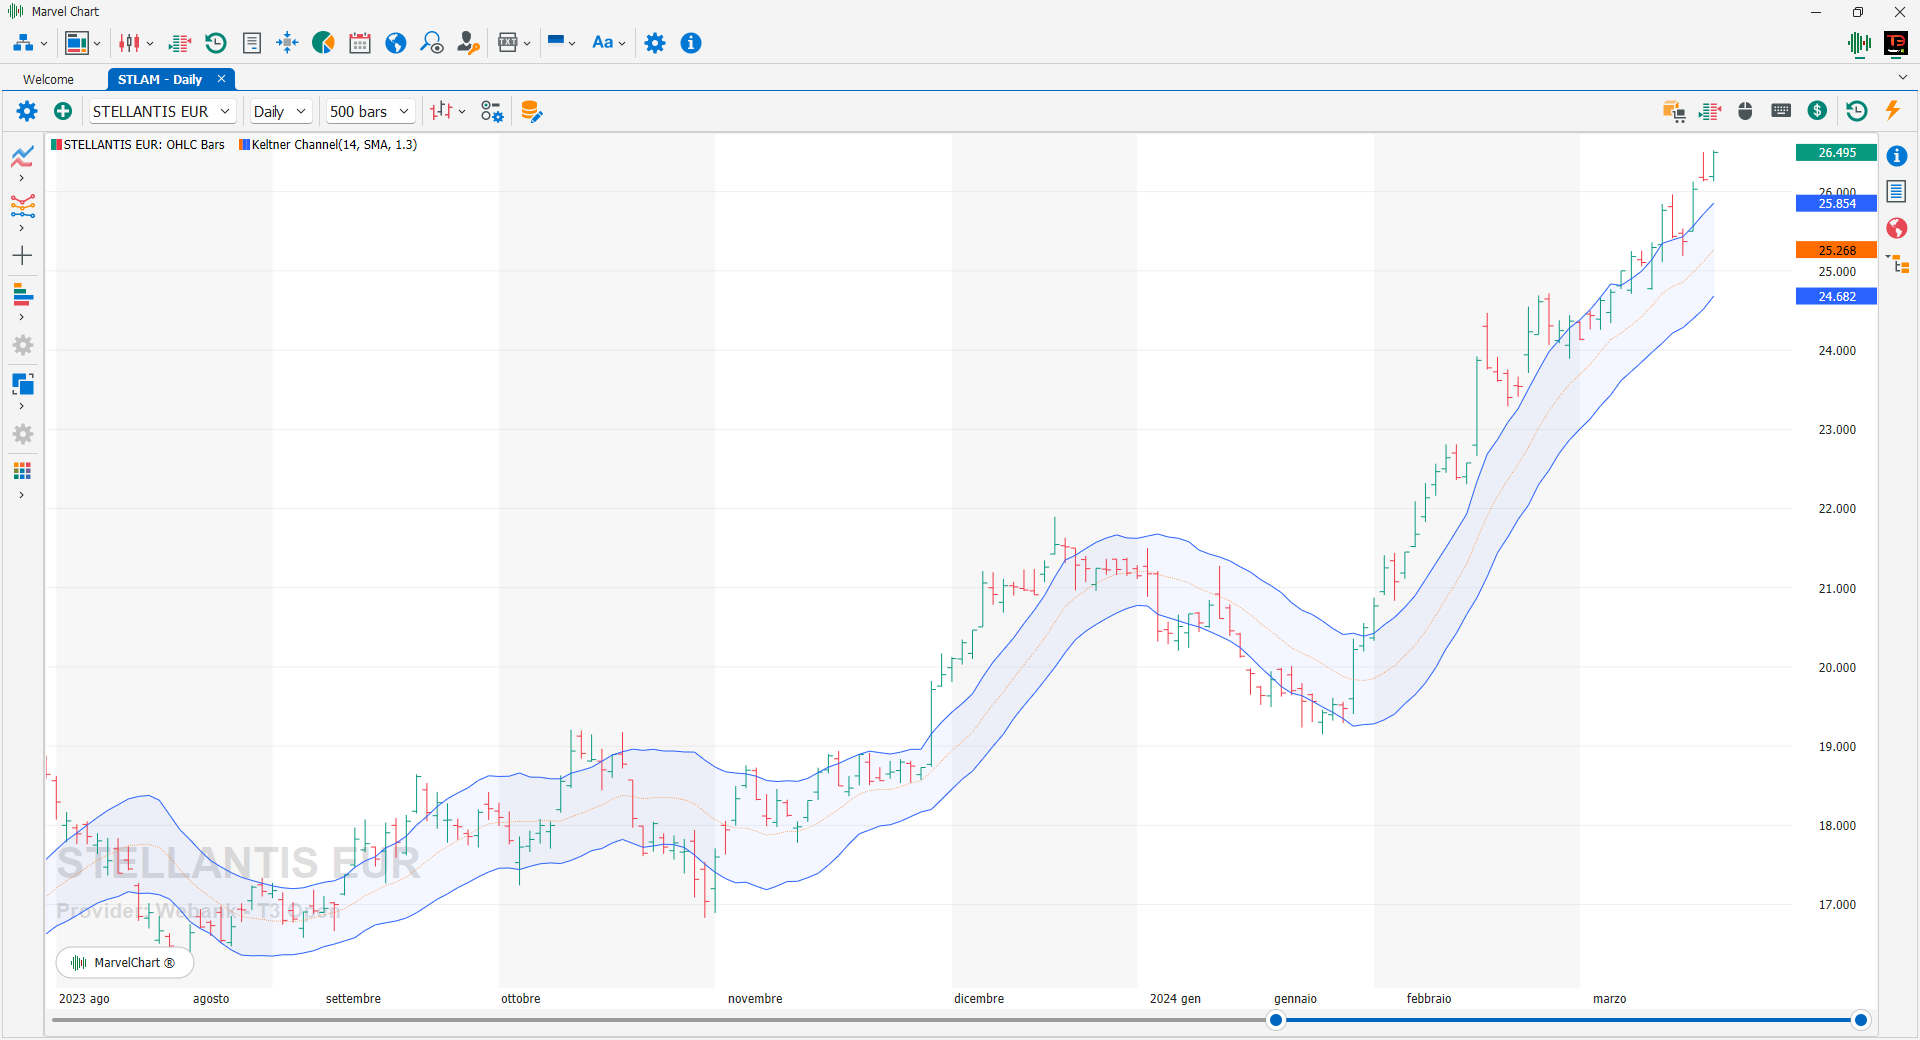
The Keltner Channel is an indicator that uses moving averages to create a range of values that the price should always remain in. These upper and lower bands adjust to changes in volatility using the Average True Range. The Keltner Channel is used to signal price breaks, to highlight a trend, and to provide overbought and oversold readings. There are many variations of calculating the Keltner Channel, but in general a 10 or 20 bar moving average is used and the channel is calculated using the typical price ((HIGH + LOW+ CLOSE) / 3). This data is used to construct the median line. From this value, a period of time is calculated, such as the 10 or 20 bars mentioned above, and multiplied by a multiple, such as 1.5. The number resulting from this calculation is then used to be added to the median line to form the upper band of the Keltner Channel, while it is subtracted from the value of the median line to form the lower band of the channel. The classic interpretation of the Keltner Channel is the price breaking outside the channel itself, that is, there is a BUY signal when the price closes above the upper band, while there is a SELL signal when the price closes below the lower band.
Prime Number Bands
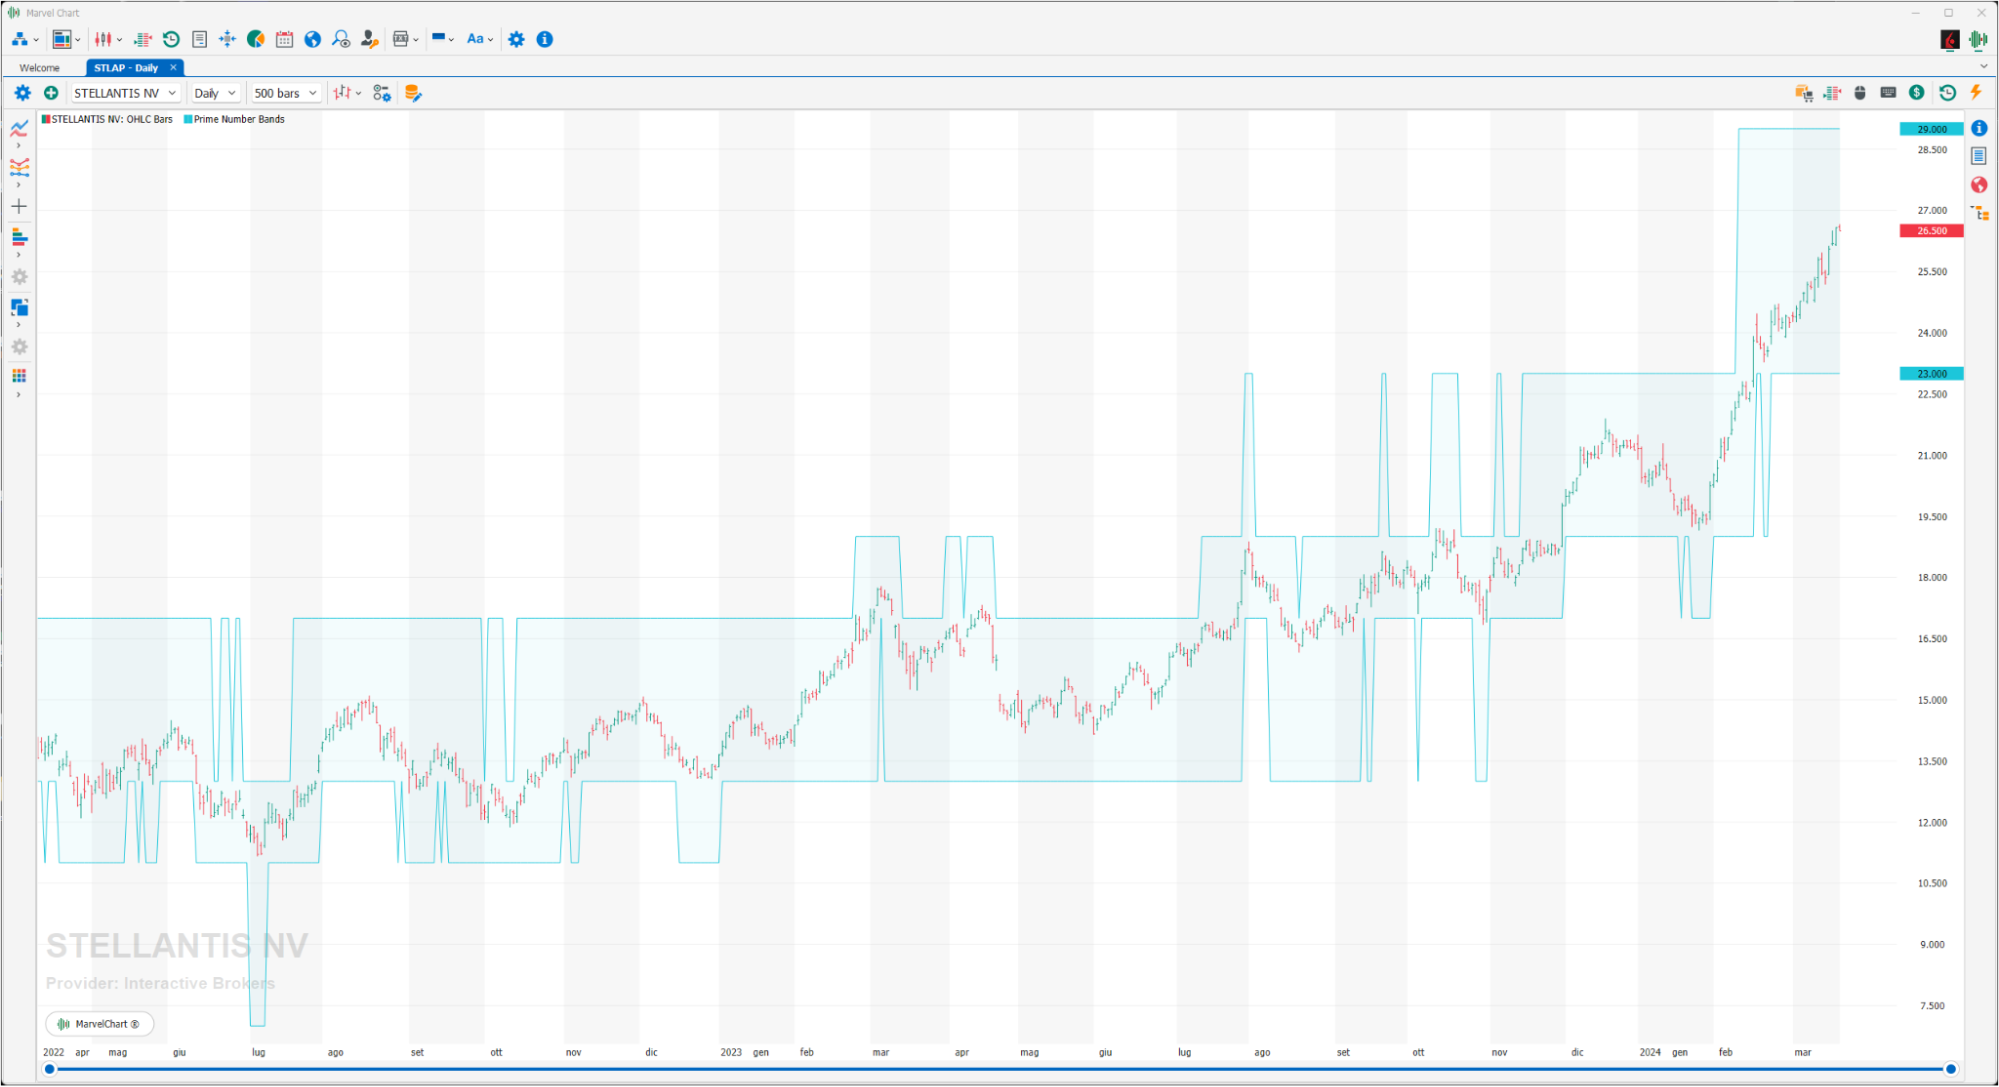
Prime Number Bands is an indicator that, taking the CLOSE value of each bar, draws two bands calculated using the closest prime numbers in the upper and lower part of the CLOSE price. In this way, an area comprising three bands is created that aims to encompass the maximum oscillation that the financial instrument can have.
Standard Error Bands
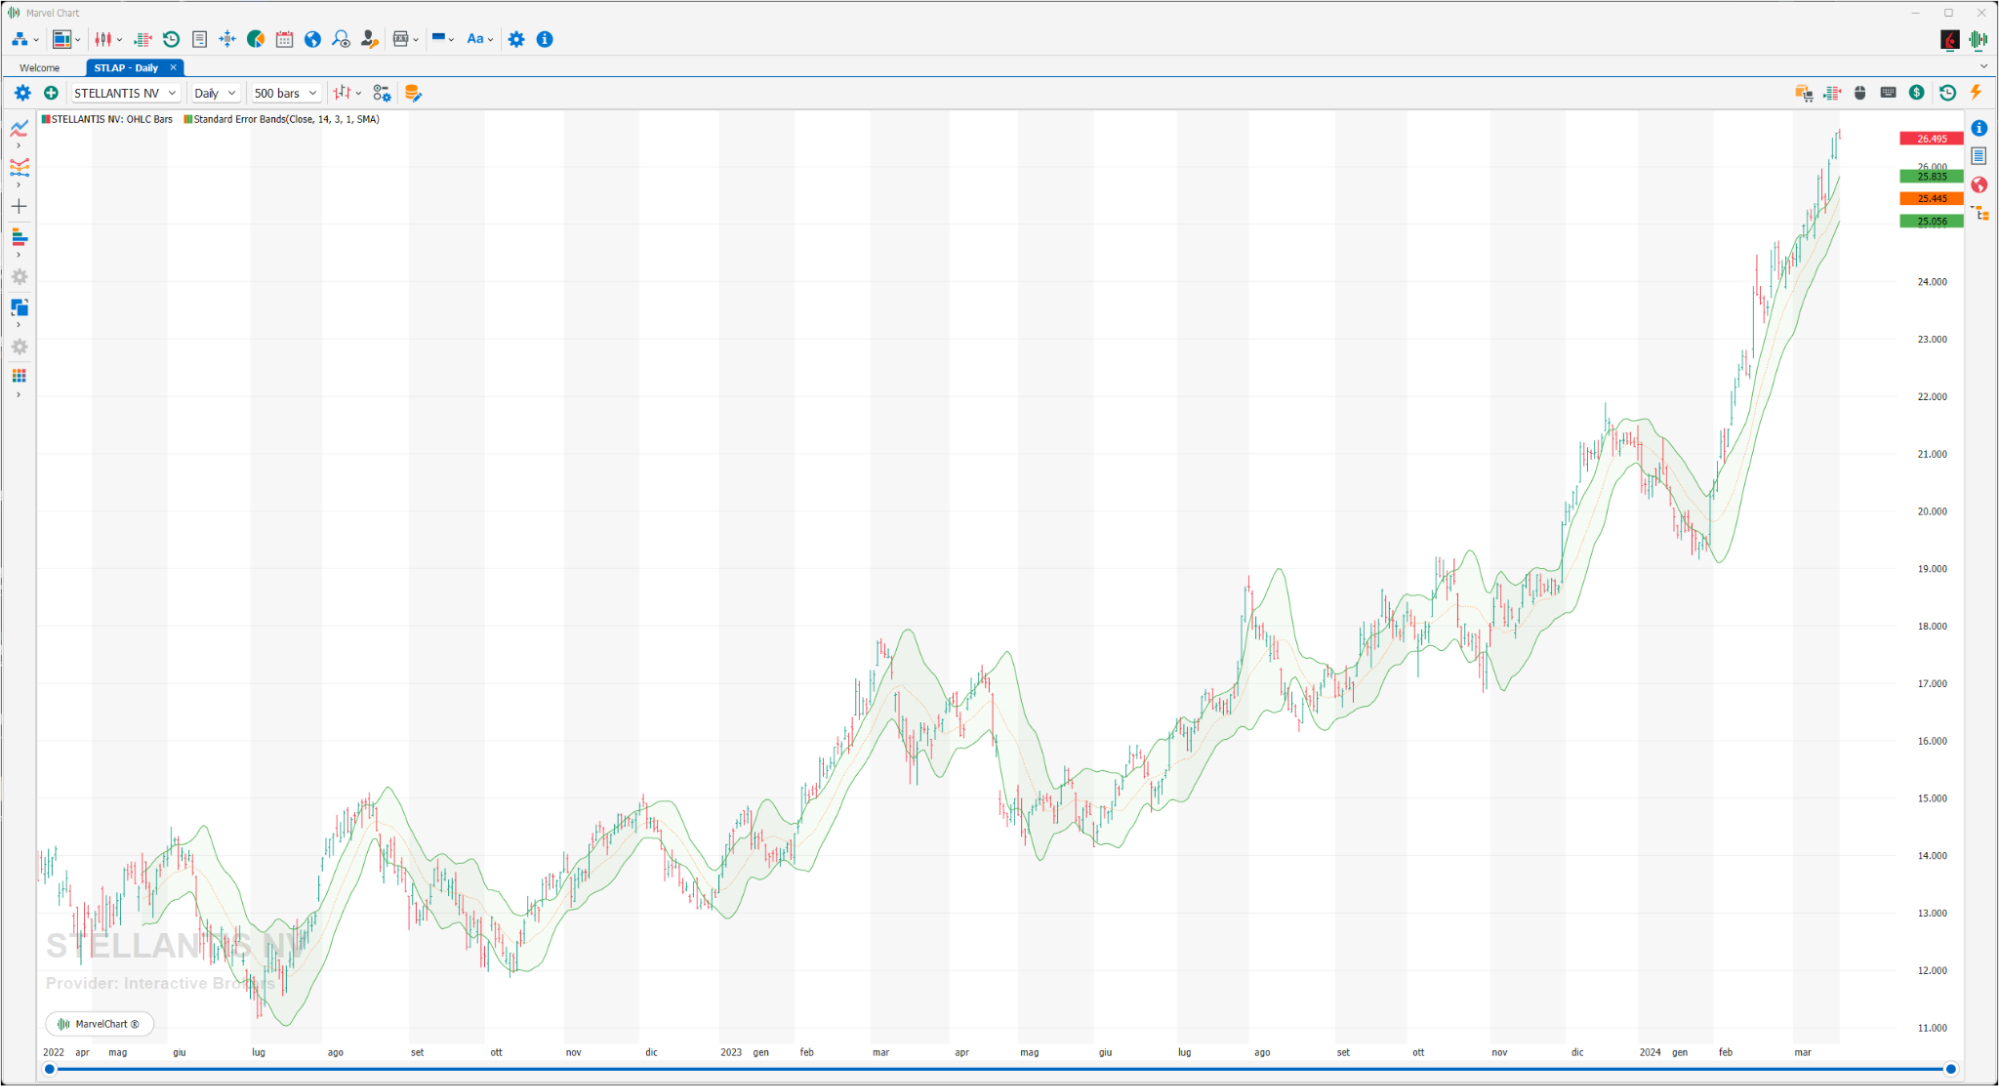
Indicator with many similarities to Bollinger Bands, but with a different interpretation. In fact, while Bollinger Bands are plotted according to certain Standard Deviation levels above and below a Moving Average, Standard Error Bands plot the standard error levels above and below the Linear Regression. The lower part of the standard error bands represents a support, while the upper part of the bands represents a resistance.
Starc
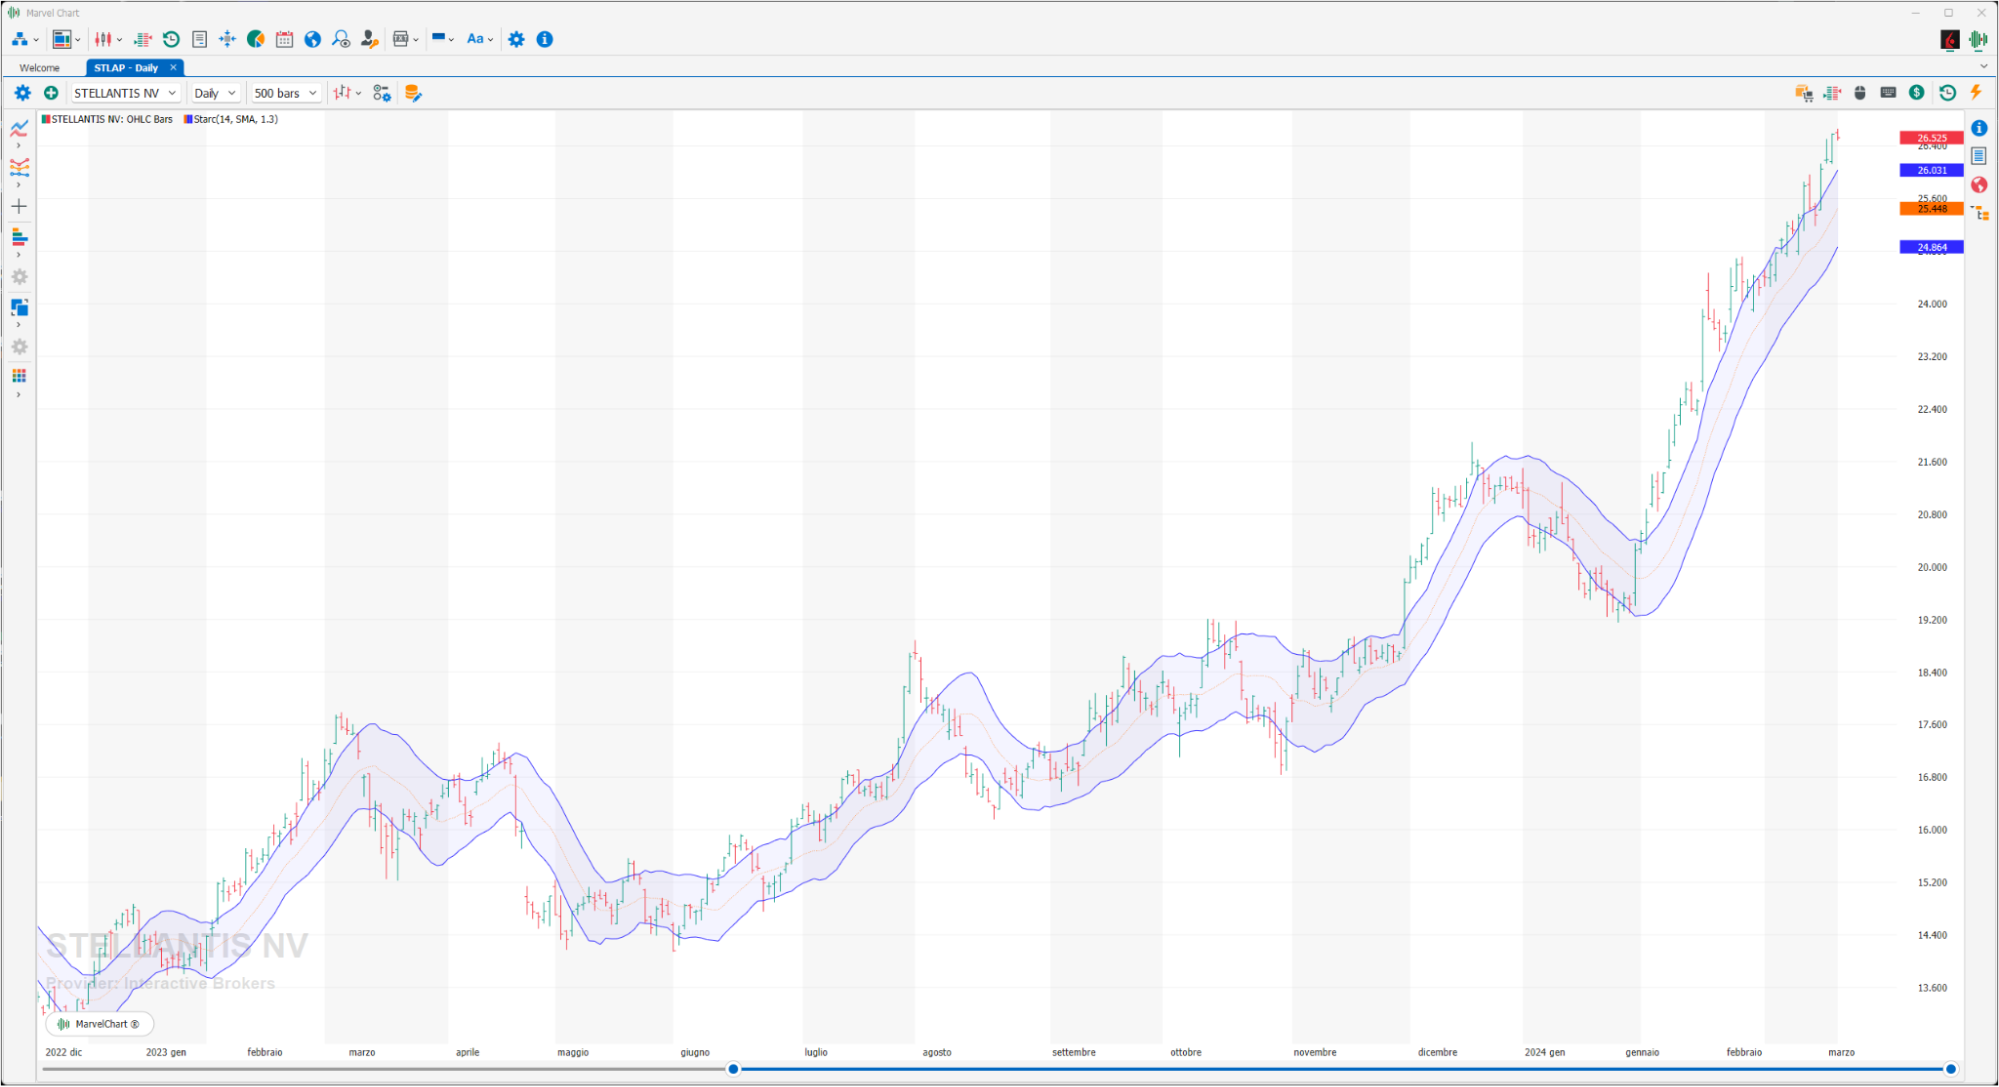
The STARC indicator is a trend indicator created in the early 1980s by analyst Manning Stoller. The STARC bands represent two lines that form the channel around simple moving averages. The indicator in question is similar to Bollinger Bands: STARC bands narrow in stable markets and expand in volatile markets. However, STARC bands are not based on the CLOSE and do not take into account standard deviations, unlike Bollinger Bands, but STARC Bands are calculated using the Average True Range (ATR), thus providing a more in-depth overview of market volatility. Using STARC, the optimal parameter is represented by the period 10. The STARC indicator generates BUY or SELL signals when the CLOSE price breaks out of the bands. In this case we expect an increase in the price above (BUY signal) or a decrease in the price below (SELL signal) of the STARC lines.