Momentum Oscillators
Awesome Oscillator
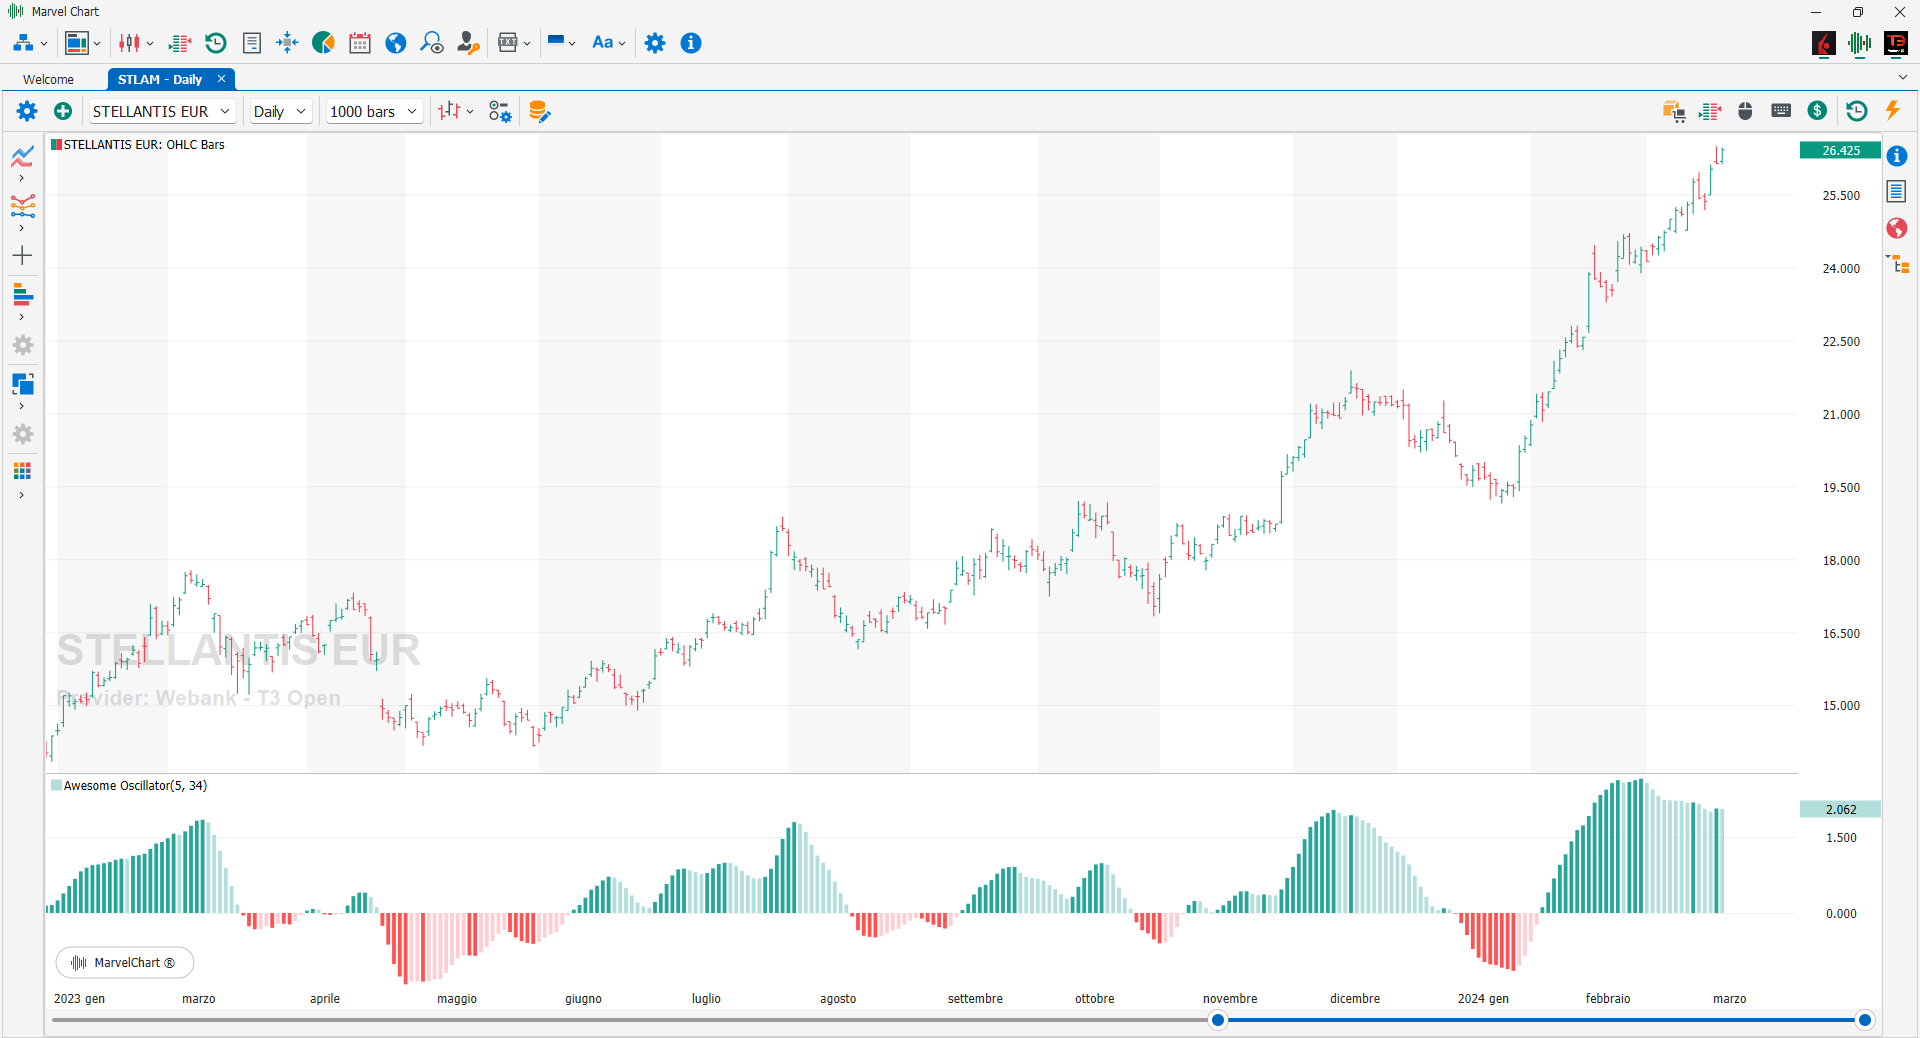
The Awesome Oscillator is an indicator used to measure market momentum. This oscillator calculates the difference between 34-period and 5-period simple moving averages. The Simple Moving Averages used are not calculated using the close price but rather the average value of each bar. The Awesome Oscillator is generally used to corroborate the trend or to anticipate possible reversals.
Chaikin Money Flow
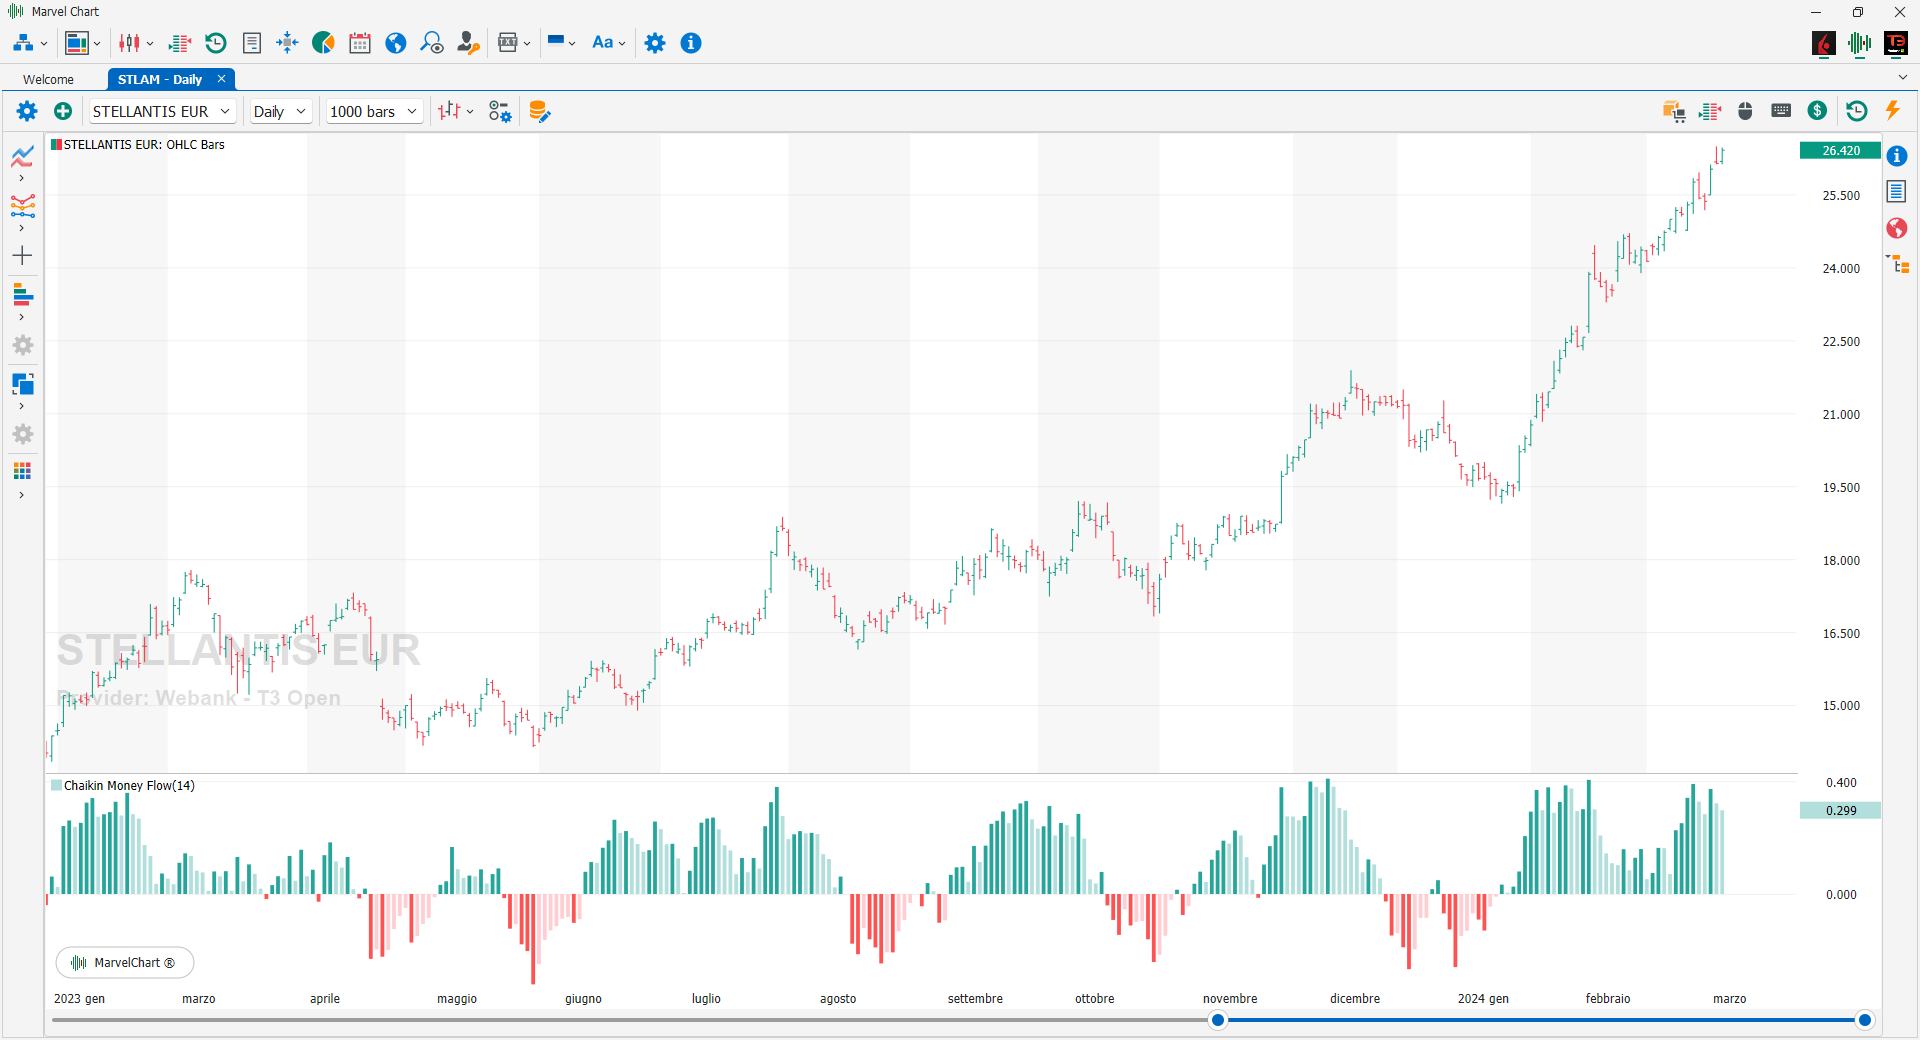
Developed by Marc Chaikin, the Chaikin Money Flow is an oscillator calculated based on the daily readings of the accumulation/distribution line. As with the A/D line, the pressure of buyers and sellers is also determined for the Chaikin oscillator based on the position of the close with respect to the maximum and minimum. In fact, there is positive pressure, or accumulation, if the close is in 50% of the positive range; instead, there is negative pressure, or distribution, if the close is in 50% of the negative range. In general, the Chaikin Money Flow is bullish when it is positive and bearish when it is negative. This indicator generates bullish signals that a financial instrument is accumulating based on three factors: The first and most obvious factor is whether the Chaikin Money Flow reading is greater than zero: it is a buy indication when the indicator is positive. The second factor is the duration of the reading, how long the oscillator has been positive: the longer the oscillator remains above zero, the more evidence there is that the financial instrument is in a sustained accumulation phase; long periods of accumulation or buying pressure are bullish indications and indicate that sentiment remains positive. The third factor is the strength of the oscillator: not only should the oscillator remain above zero, but it should also be able to increase and reach a certain level; the more positive the reading, the more evidence there is of buying and accumulation pressure.
Chande Momentum Oscillator
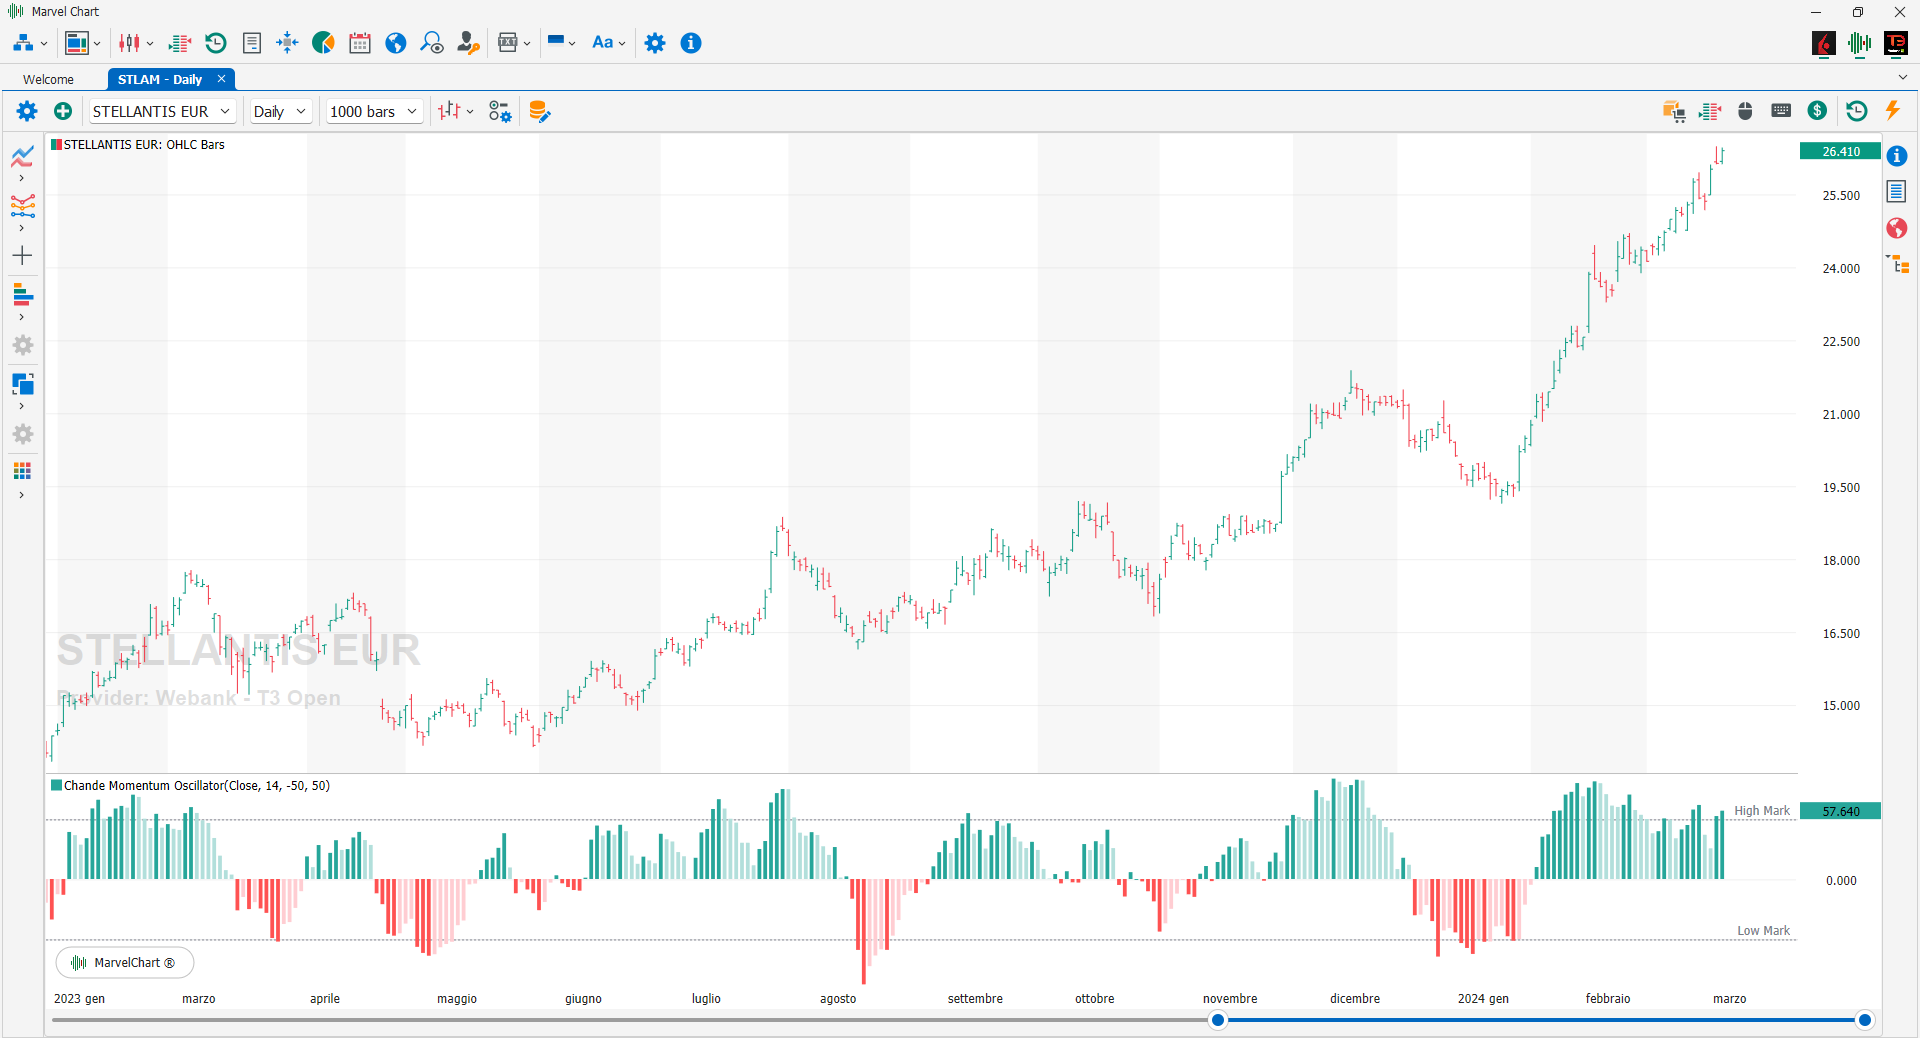
The Chande Momentum Oscillator is a pure momentum oscillator that identifies short-term excesses of market momentum. It is a variant of the RSI, from which it differs in that the Chande Momentum Oscillator measures momentum directly (in the numerator of the formula it includes the momentum of positive and negative days, while the RSI uses only the momentum of positive days in the numerator). The Chande Momentum Oscillator does not use damping mechanisms within its formula, so it does not smooth out short-term excesses of momentum, while the RSI performs its calculations on damped data. The scale of the Chande Momentum Oscillator ranges from -100 to +100, so you can see the momentum at a glance (above or below zero), while with RSI, which has a scale of 0 to 100, the value 50 should be used as the limit of the momentum.
Coppock Curve
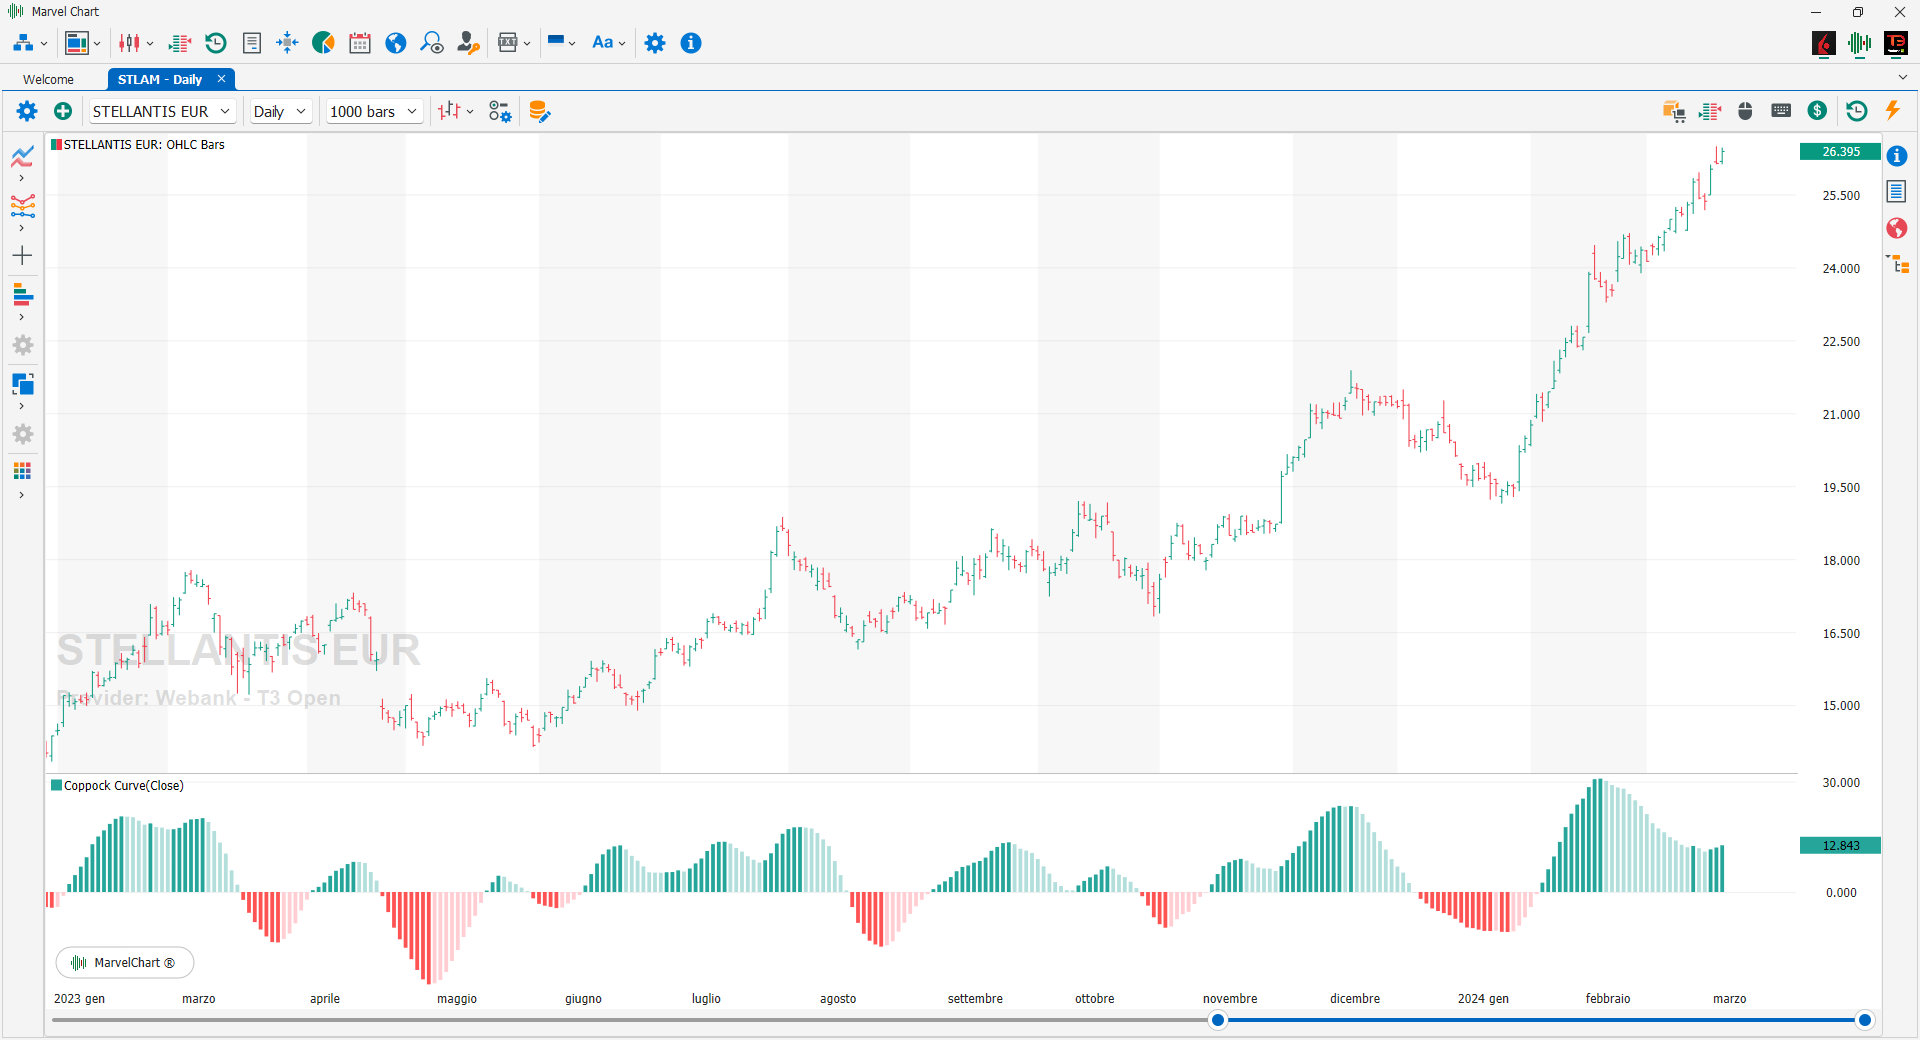
The Coppock Curve is a momentum indicator designed for long timeframes created by Edwin Sedgwick Coppock way back in 1962. It is an indicator that follows the trend and generates buy signals when it becomes negative, breaking the zero line downwards. Due to its construction, it is an indicator that does not show a new trend in a reactive way but rather when it is well consolidated. Coppock created this indicator for the SP 500 and Dow Jones Industrial indices, so it is advisable to use it on indices rather than on stocks or commodities. In fact, in the case of raw materials, Coppock advises against using them because the lows of these instruments generally have a rounded shape, while on other instruments the lows have a pointed shape.
De-Trended Price Oscillator
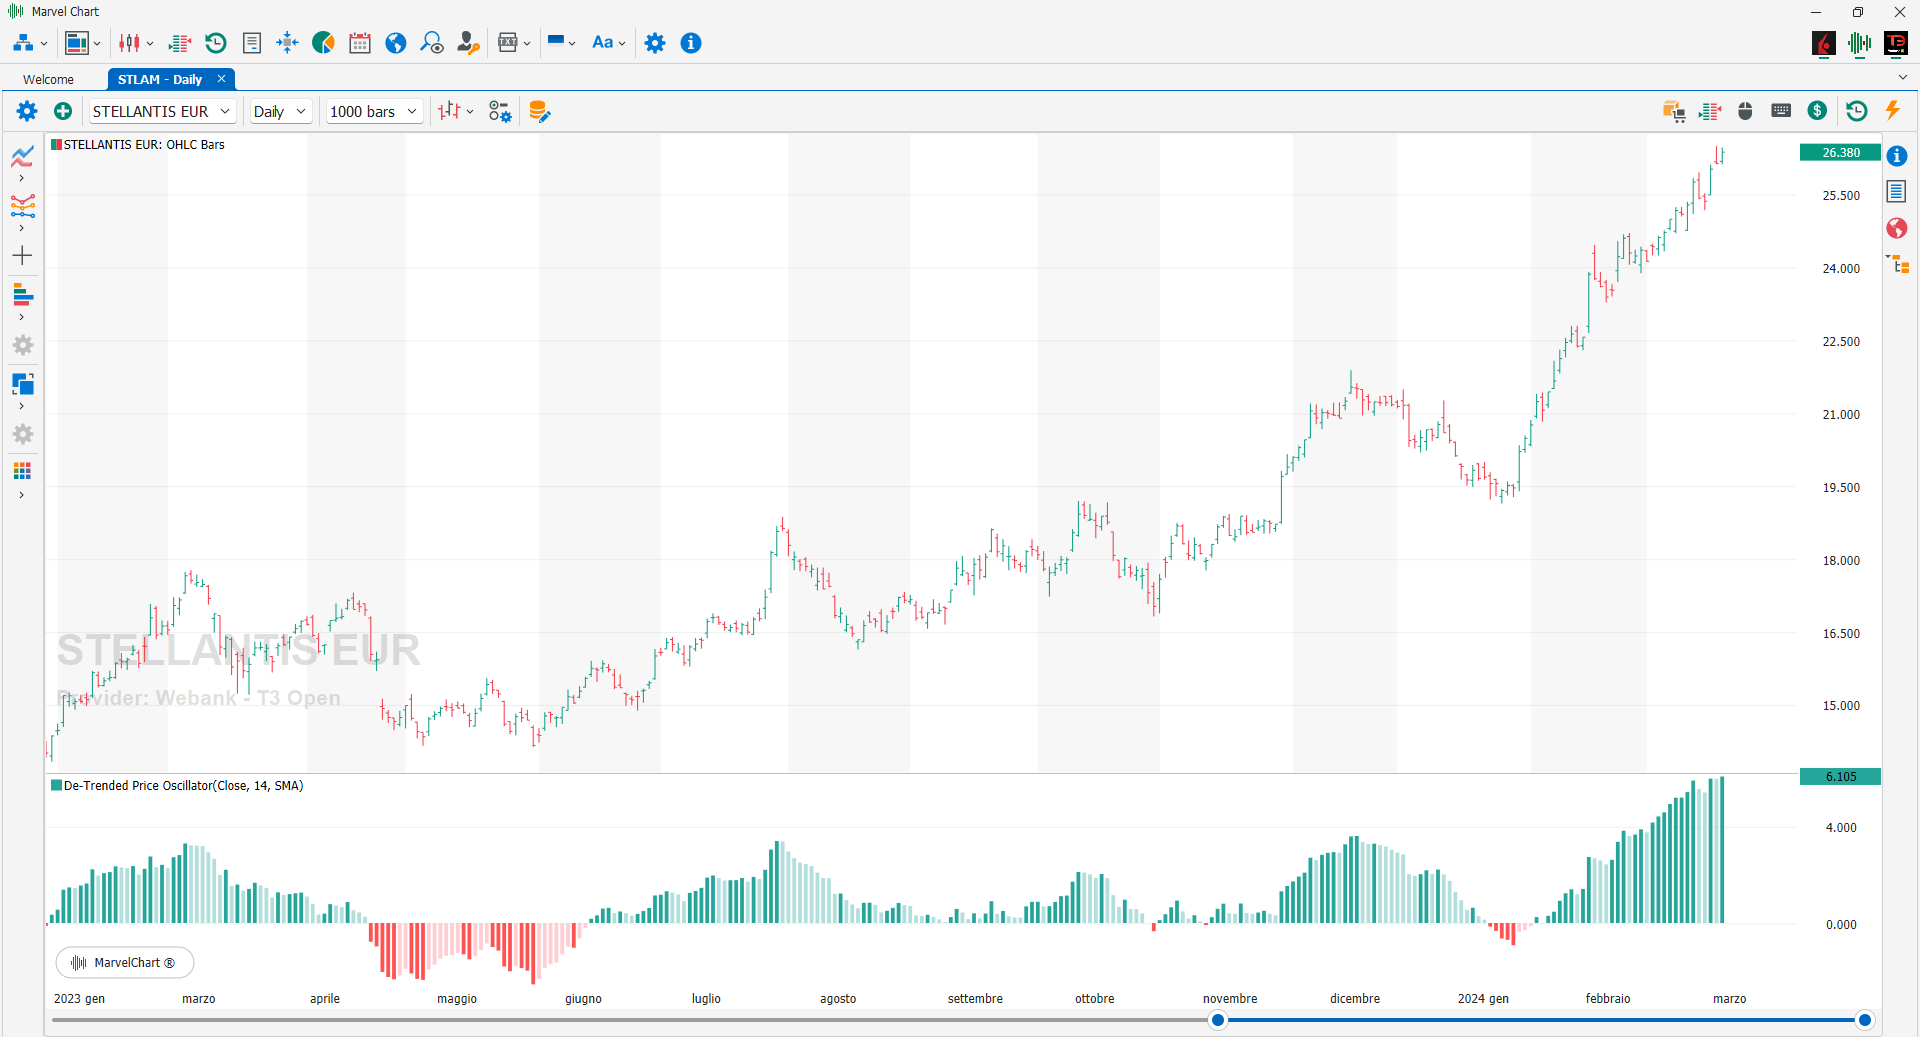
The Detrended Price Oscillator is an indicator that allows you to identify long-term cycles starting from the analysis of short-term cyclical components. The indicator calculates the difference between the daily price and the respective moving average shifted back in time ((Periods * 0.5) +1). The standard interpretation is very simple: a BUY signal is generated when the Detrended Price Oscillator goes from negative to positive, on the contrary a SELL signal is generated when the Detrended Price Oscillator goes from positive to negative.
Fractal Chaos Oscillator
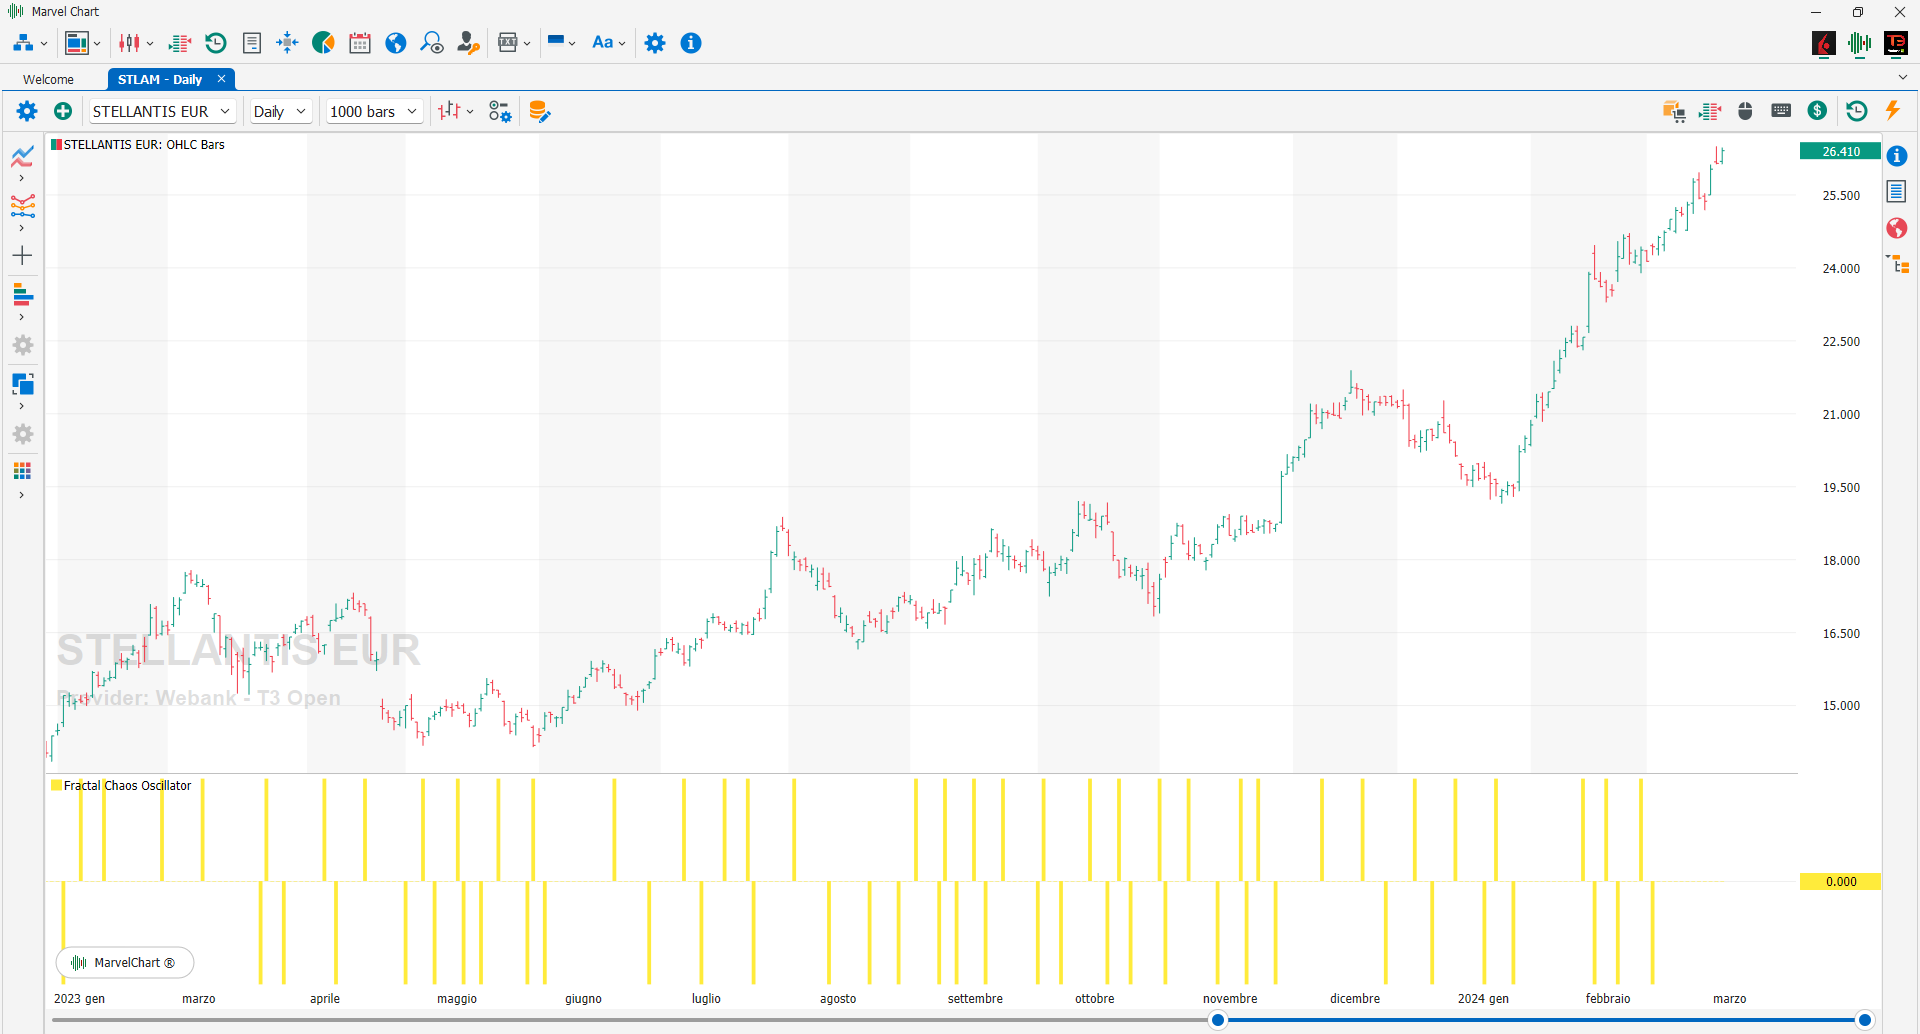
Widely used in mathematics, fractals are related to chaos theory and abstract mathematics and can also be useful applied to the financial market, since the market itself is dynamic and non-linear. In trading, fractals are defined in their literal meaning, that is, used to divide larger trends into simple and predictable patterns, to predict market reversals and to determine repetitive samples. The value of the Fractal Chaos Oscillator is calculated as the difference between the most subtle movements of the market. In general, its value is between -1,000 and 1,000. The higher the value of the Fractal Chaos Oscillator, the more we can say we are following a certain trend. Fractal Chaos Bands and Fractal Chaos Oscillator have similar names and in fact the two indicators are relatively similar in their interpretation. Both reflect the market trend, but in different ways. On a chart, Fractal Chaos Bands look like a band, composed of two lines that pass through the highest and lowest market values in that period of time. The flatter the band, the more unstable the market, while the more chaotic the band appears, the more the market is trending.
Internal Bar Strength
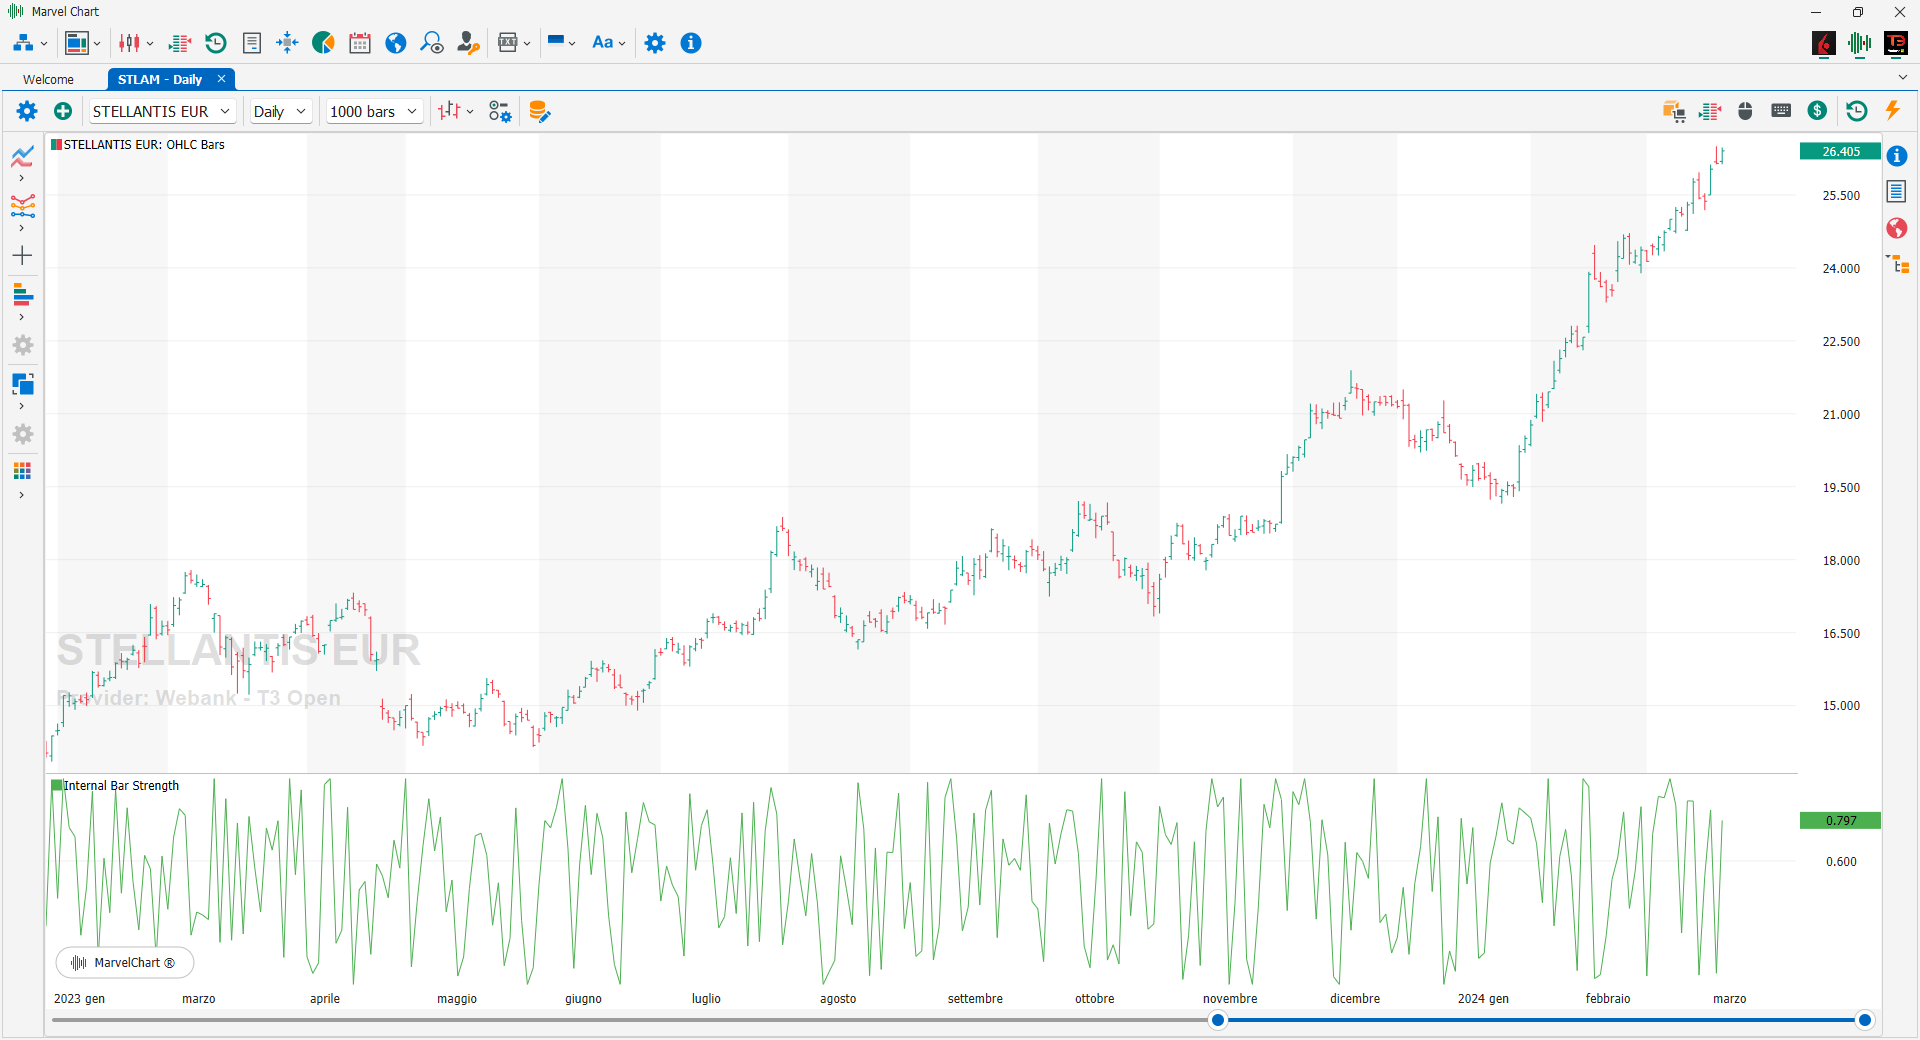
Internal Bar Strength is an idea that has been around for some time and is based on the position of the day's Close in relation to the day's range: it takes a value of 0 if the close price is the lowest price of the day, and 1 if the close price is the highest price of the day. The essence of the idea is that stocks that close at the lower end of the daily range, with an IBS lower than, say, 0.2, will tend to recover the following day, while stocks that close in the top quintile will often lose value the following session.
Know Sure Thing
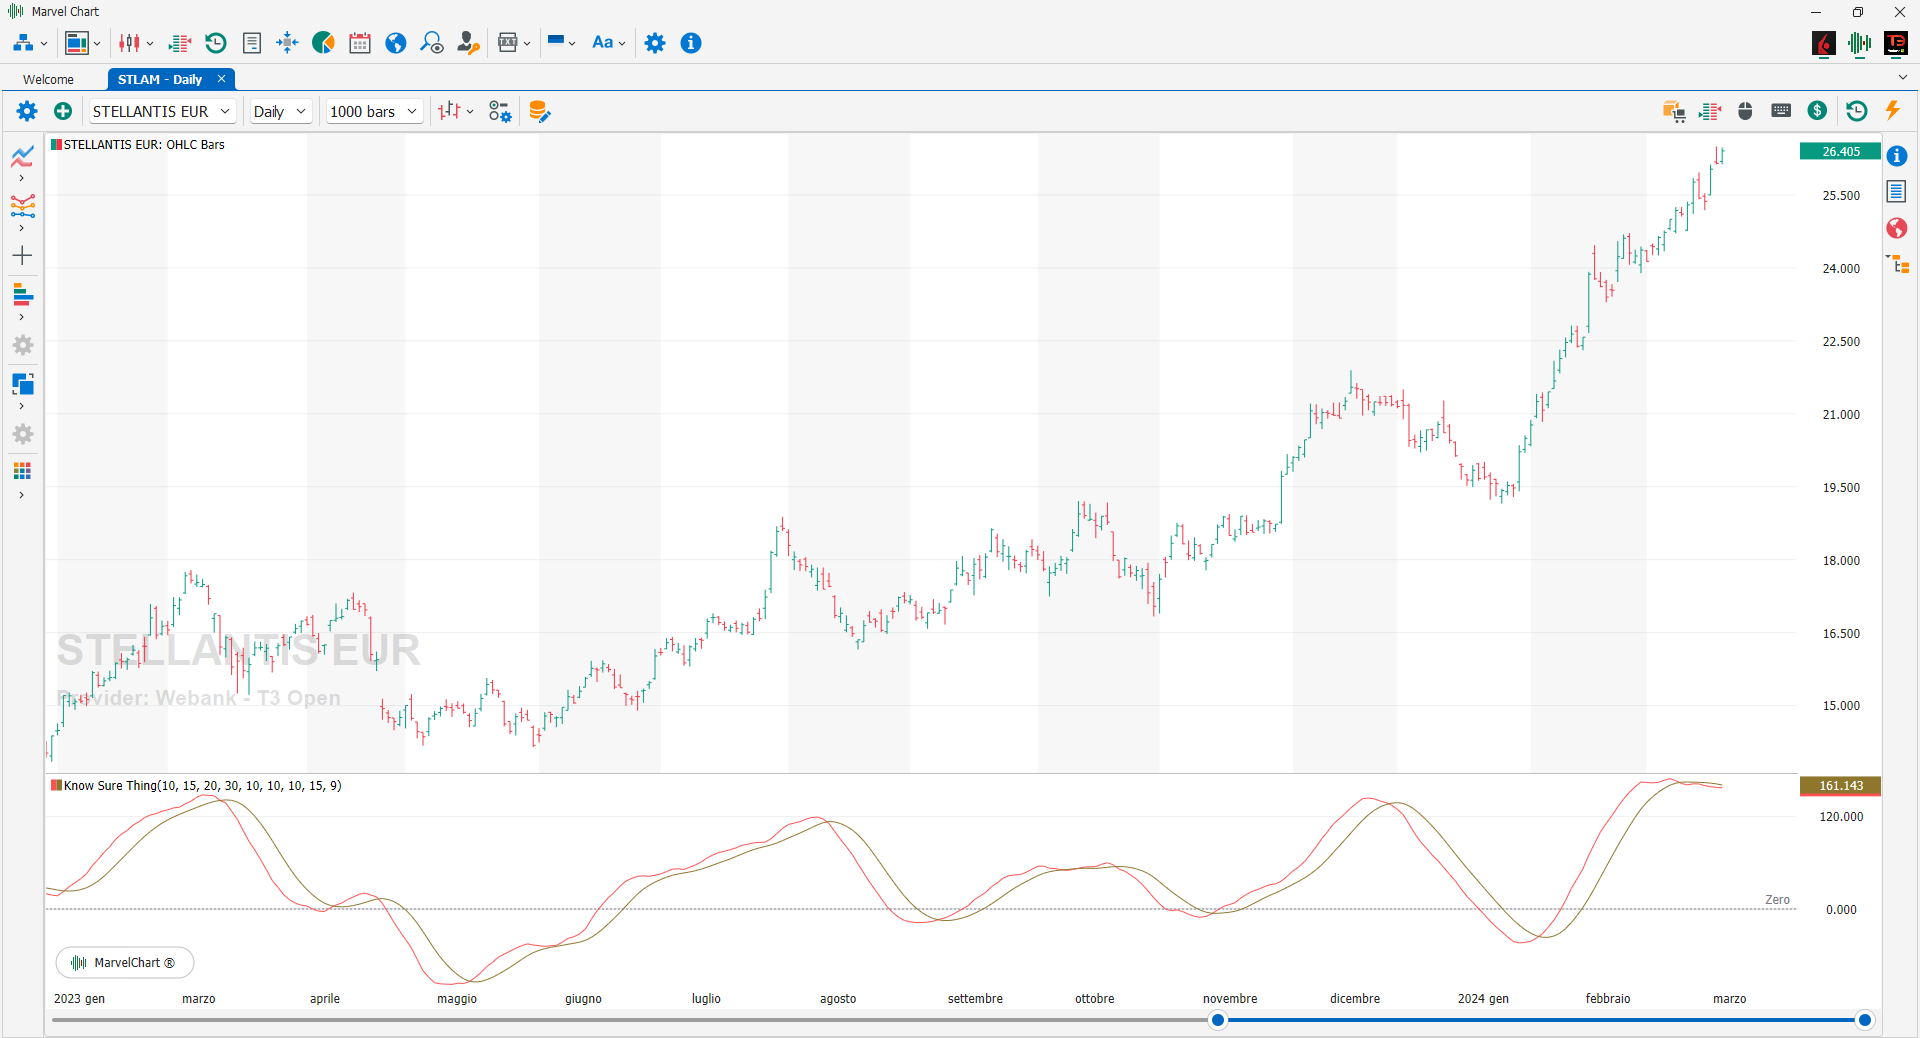
The Know Sure Thing indicator is a momentum-based oscillator and is based on the Rate of Change (ROC). The Know Sure Thing takes four different ROC time frames and smooths them out using simple moving averages, the Know Sure Thing then calculates a final value that oscillates between positive and negative values above and below a zero line. There is also a signal line that is an SMA of the KST line itself. In essence, the Know Sure Thing indicator measures the momentum of four separate price cycles. Technical analysts use this information to spot divergences, overbought and oversold conditions, and crossovers.
Momentum Oscillator
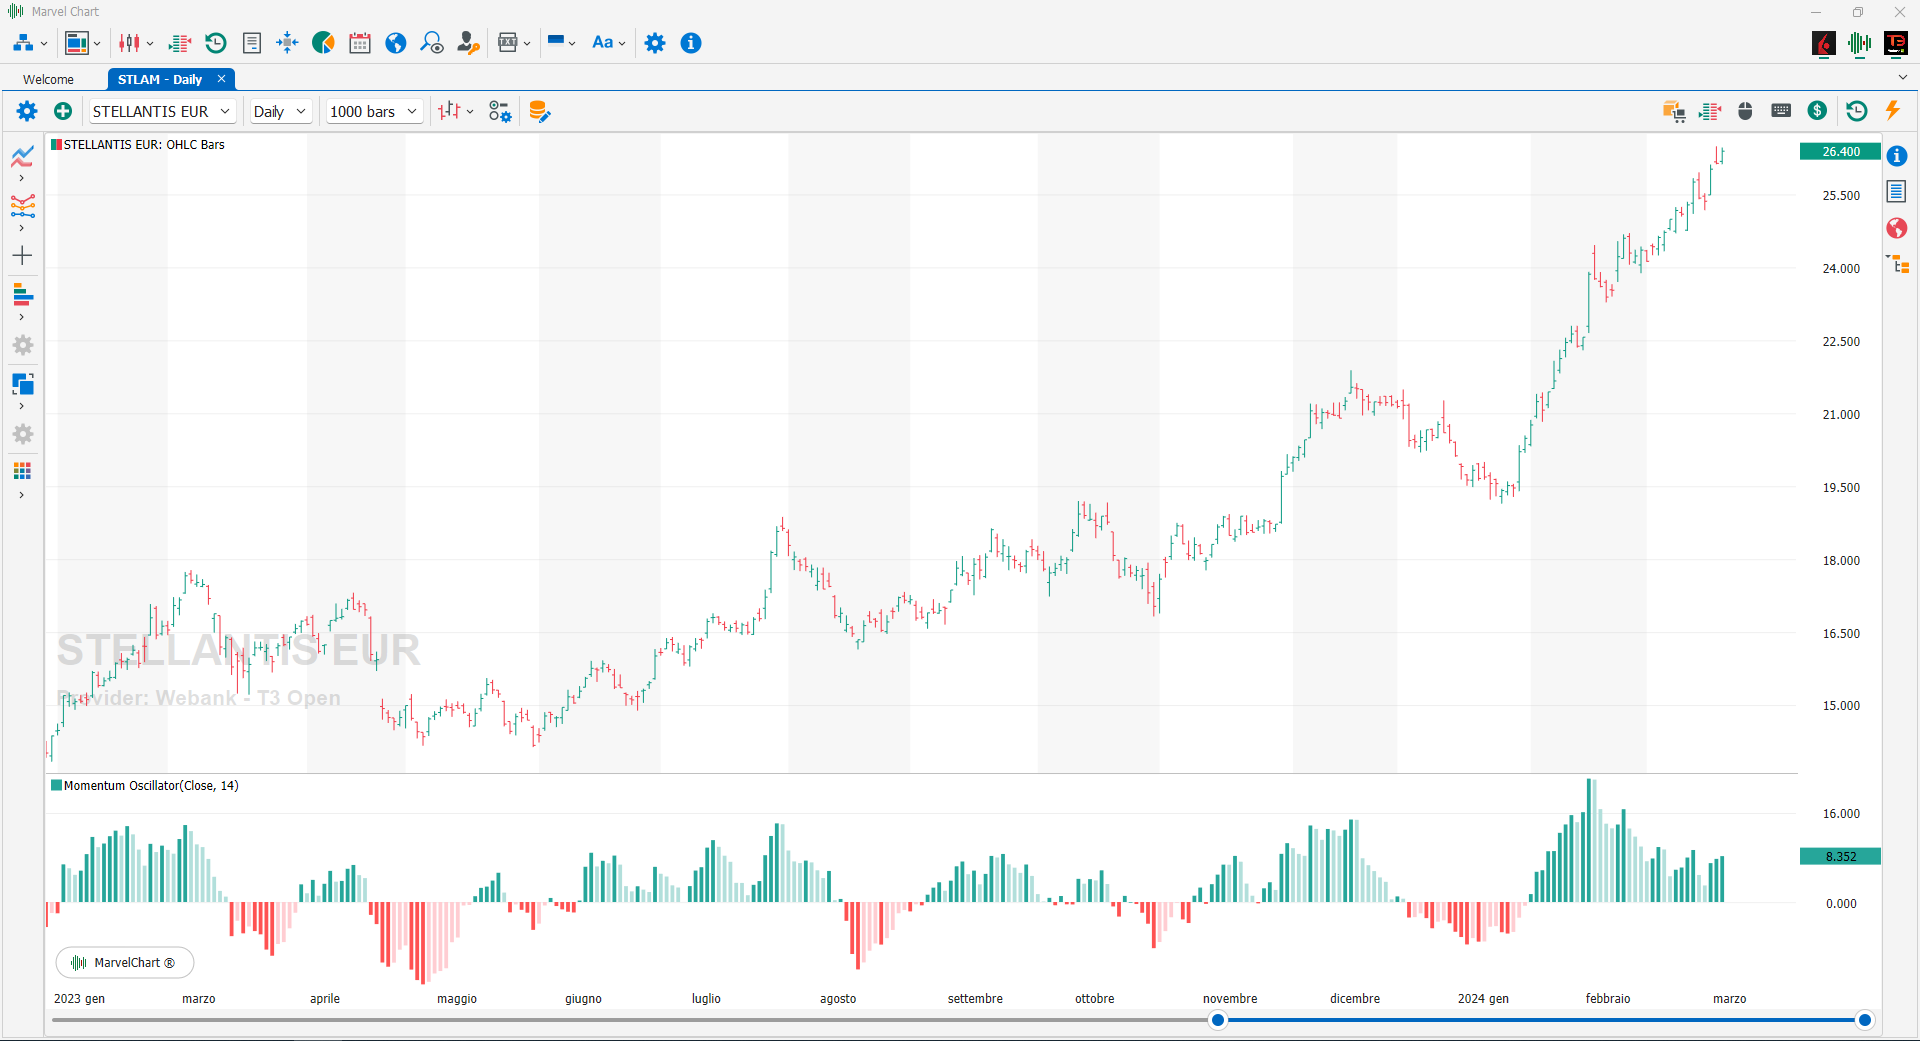
The Momentum Oscillator measures the strength of an asset by measuring the rate of change of prices compared to their actual levels. The calculation is performed on past data, as for all oscillators, recording the continuous variations of prices over pre-established time intervals. To construct the momentum lines of the X period it is necessary to subtract from the last CLOSE recorded, the CLOSE of X periods ago. A positive momentum value indicates that the current CLOSE is greater than the CLOSE of X previous periods, vice versa a CLOSE lower than that of X previous periods will consequently have a negative momentum value.
Pretty Good Oscillator

The Pretty Good Oscillator measures the distance of the current CLOSE from a moving average, divided by the Average True Range. The creator of the Pretty Good Oscillator, Mark Johnson, attributes the LONG signal if the indicator is above 2.5 and the SHORT signal on the indicator is below -2.5.
Price Oscillator
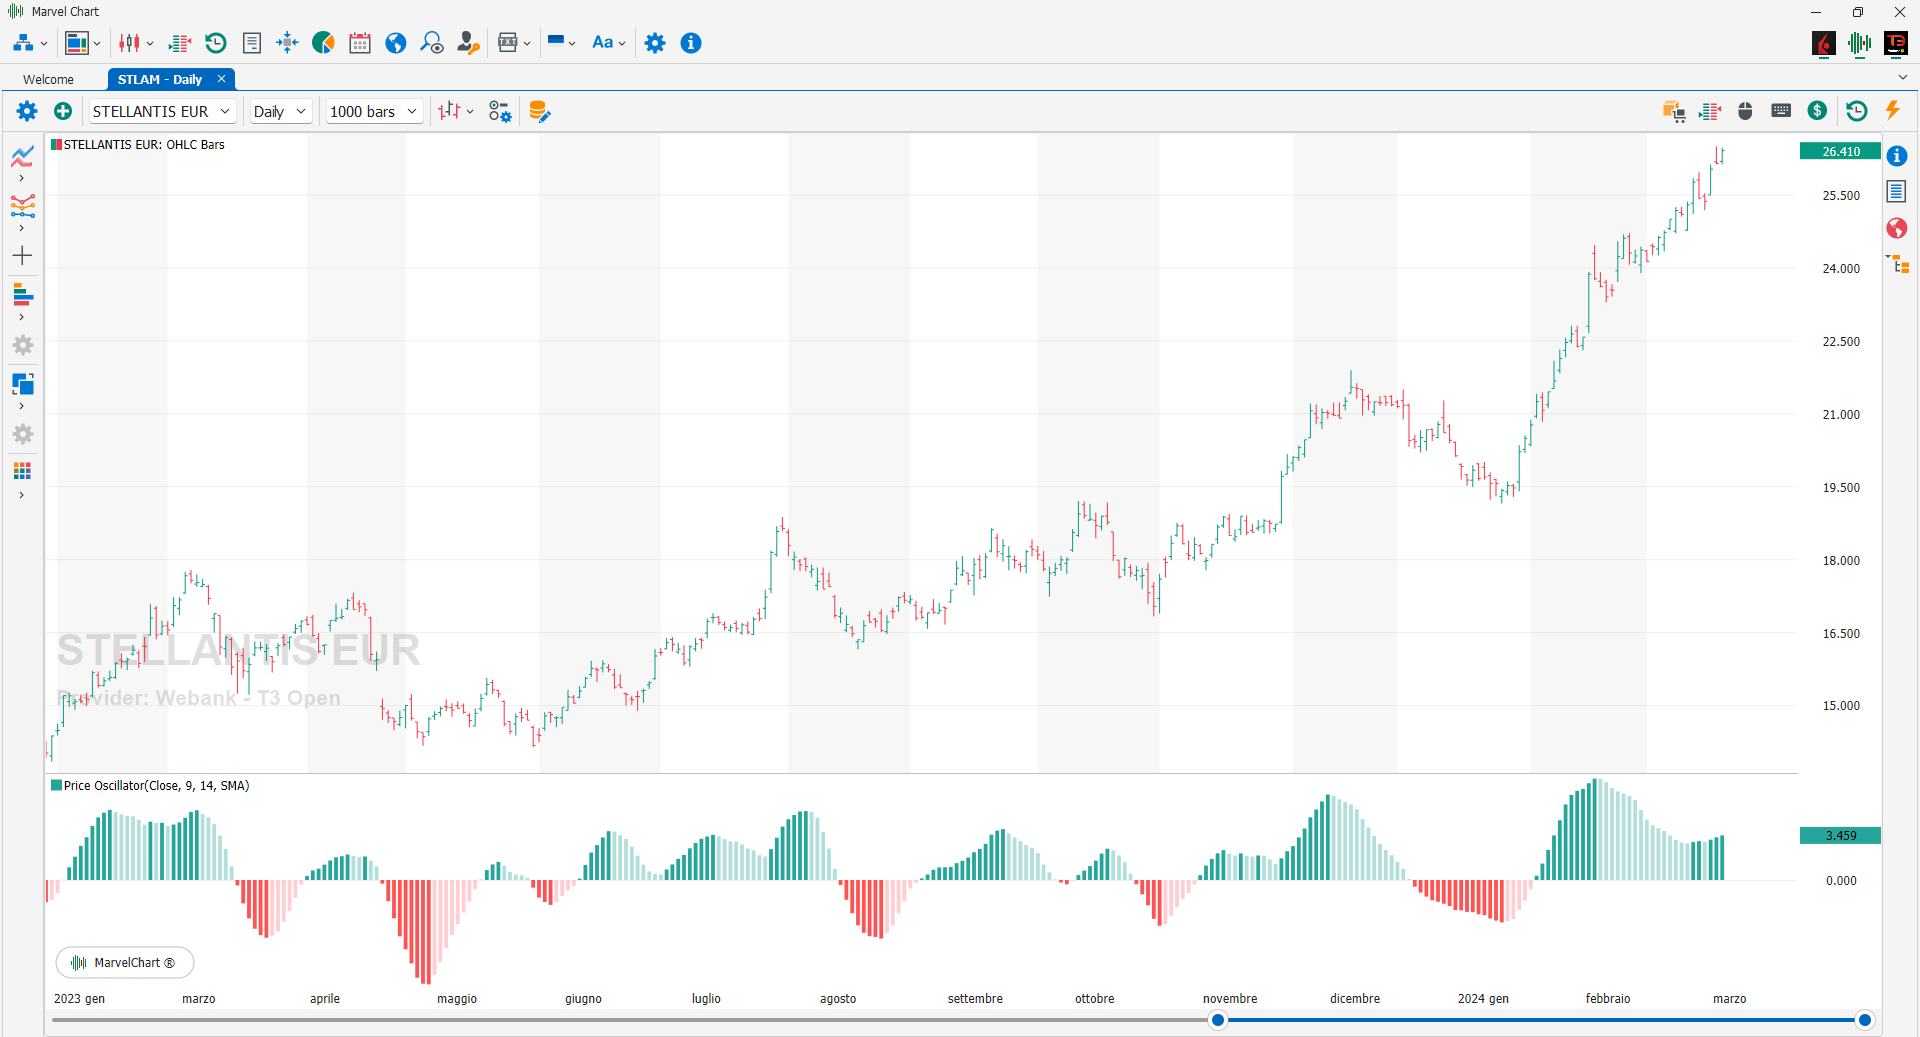
The Price Oscillator is a momentum indicator sometimes also identified as the “Moving Average Oscillator”, since it was built using two Moving Averages with different periods (Long Cycle and Short Cycle). The Price Oscillator measures the distance between the two moving averages; the Short Cycle is used to replace the price, the Long Cycle defines the trend. The greater the distance between the Short Cycle and the Long Cycle, the greater the value of the Price Oscillator and the greater the movement of the market.
Relative Strength Index Oscillator
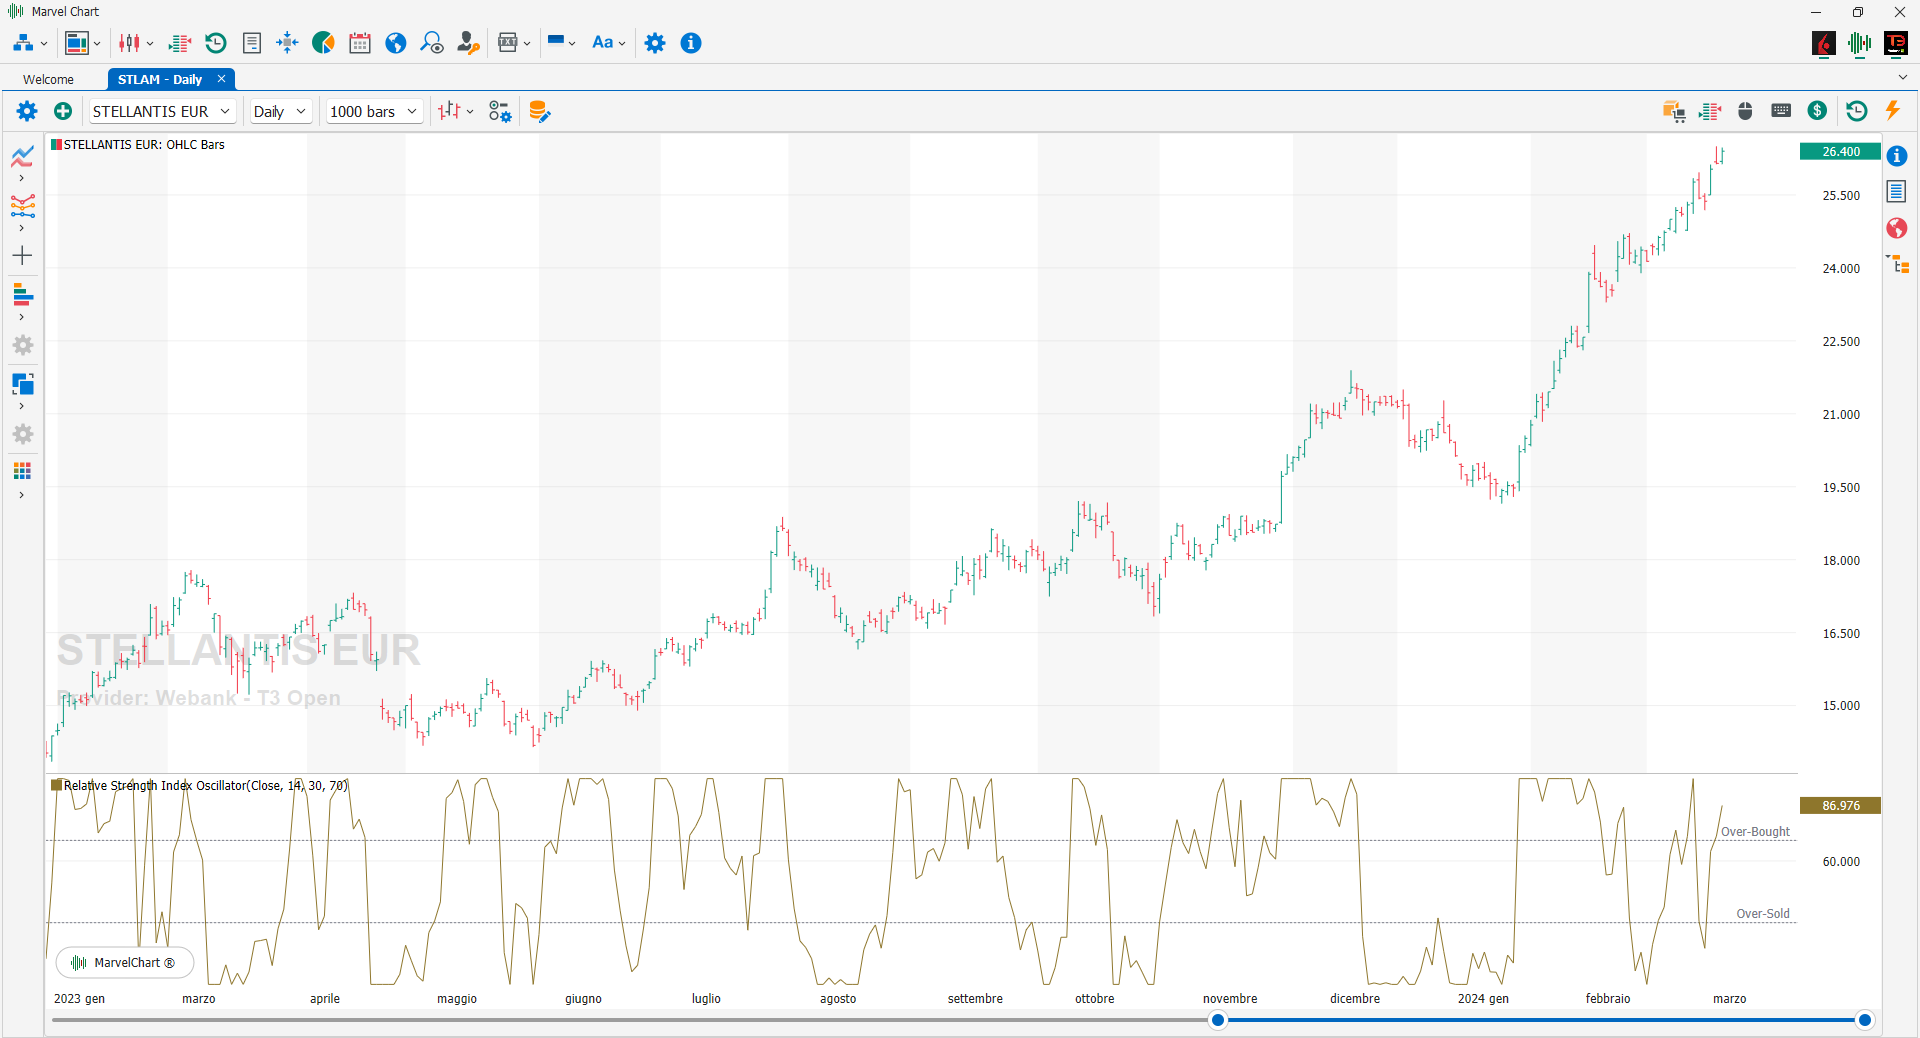
The Relative Strength Index Oscillator indicator converts the results of a regular Relative Strength Index indicator into an oscillator, effectively expressing RSI values as a percentage.
Stochastic Momentum Index Ergodic Oscillator

The Stochastic Momentum Index Ergodic Oscillator plots the difference between the Stochastic Momentum Index Erdogic and the signal line.
Stochastic Oscillator
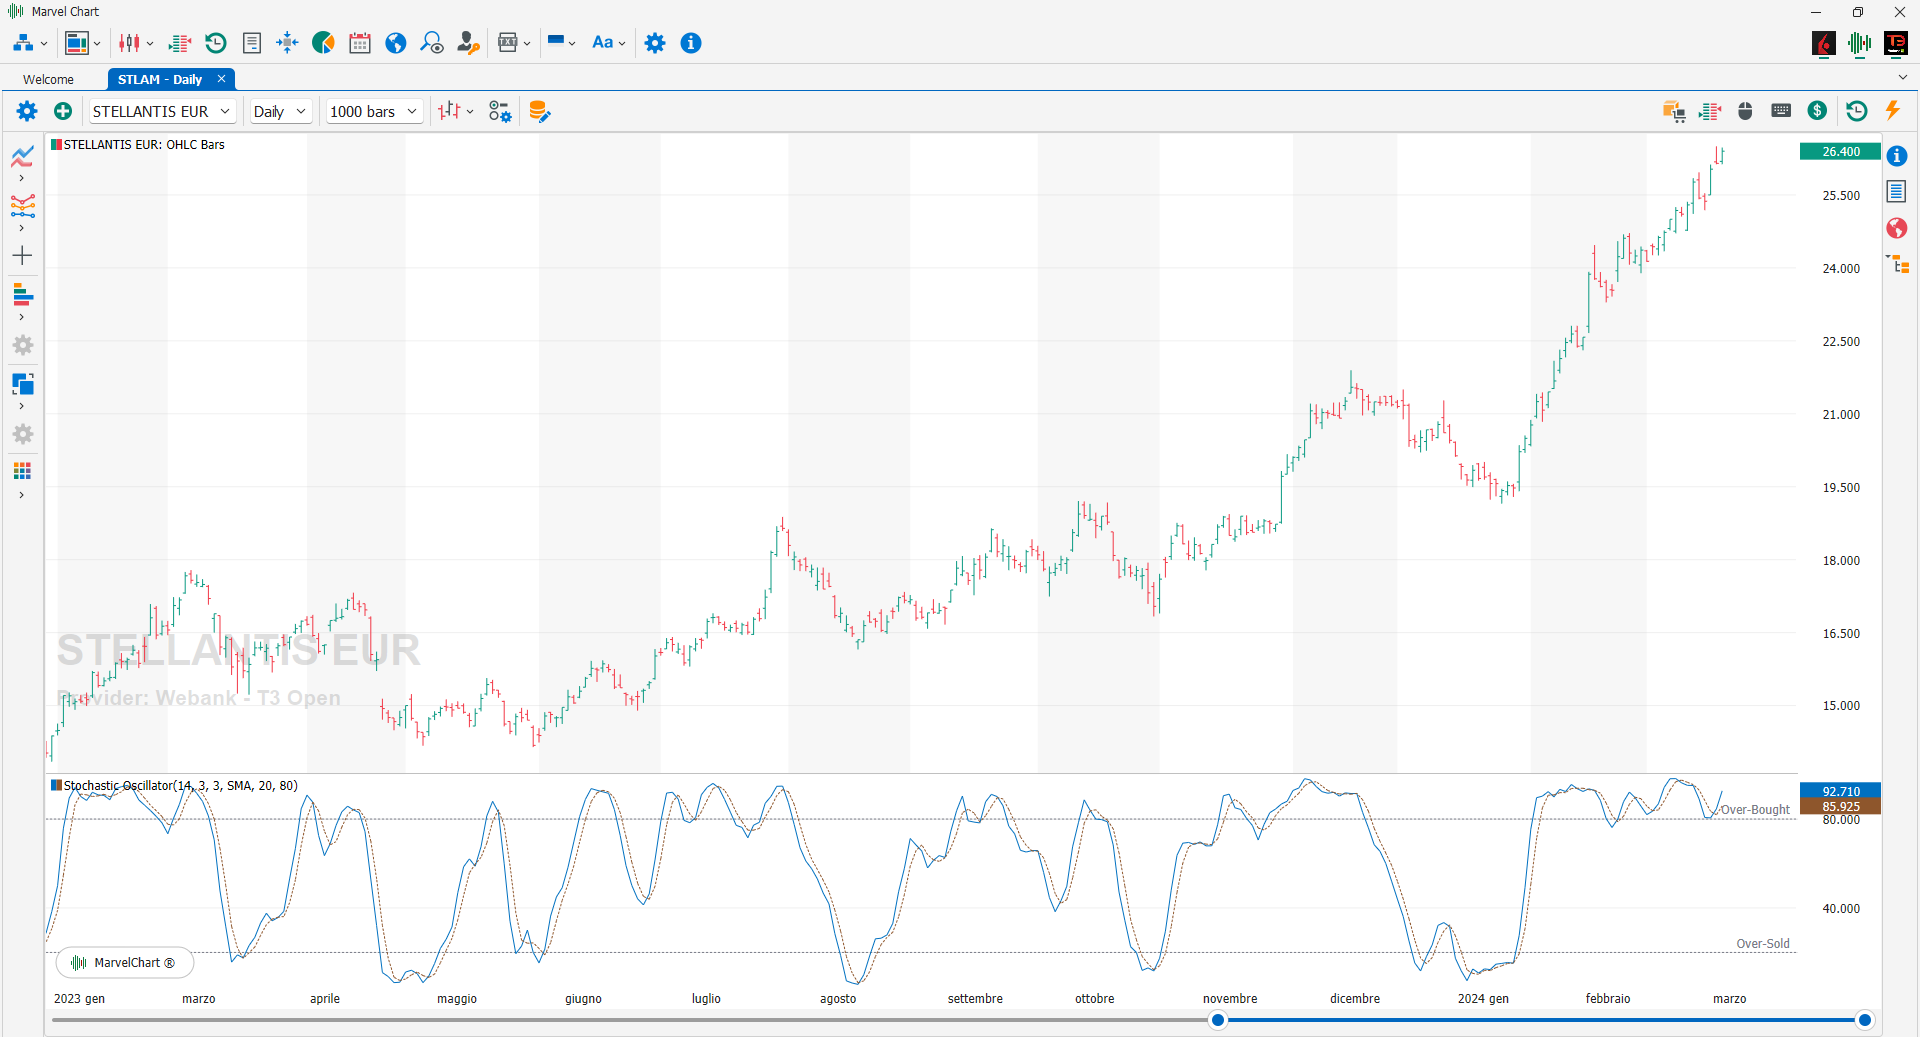
The Stochastic Oscillator, developed by George Lane in 1950, is a momentum indicator, an oscillator that relates the current CLOSE to the HIGH-LOW interval of a given period of time. This oscillator varies from 0 to 100, measuring the relative position of the current CLOSE, compared to the CLOSE of a given previous period. A value close to 0 indicates that we are close to the lows of the period considered (oversold area), on the contrary when the indicator is close to 100 it indicates that we are close to the highs of the period considered (overbought area). Therefore, if we are in an uptrend, the Stochastic Oscillator should be positioned at the maximum levels of the range, around 100, near 0 if we are in a bearish phase.
If the Stochastic Oscillator is between 0 and 20, it could indicate the continuation of the downtrend, on the contrary, when we see an overcoming of the horizontal line positioned at 20, we can expect a trend reversal, if it is between 20 and 80, we generally evaluate the continuation of the trend until it approaches the 80 threshold, if it is between 80 and 100, it indicates an uptrend with prices approaching new highs, a reversal could be a cut of the horizontal line at the 80 level downwards.
Twiggs Money Flow
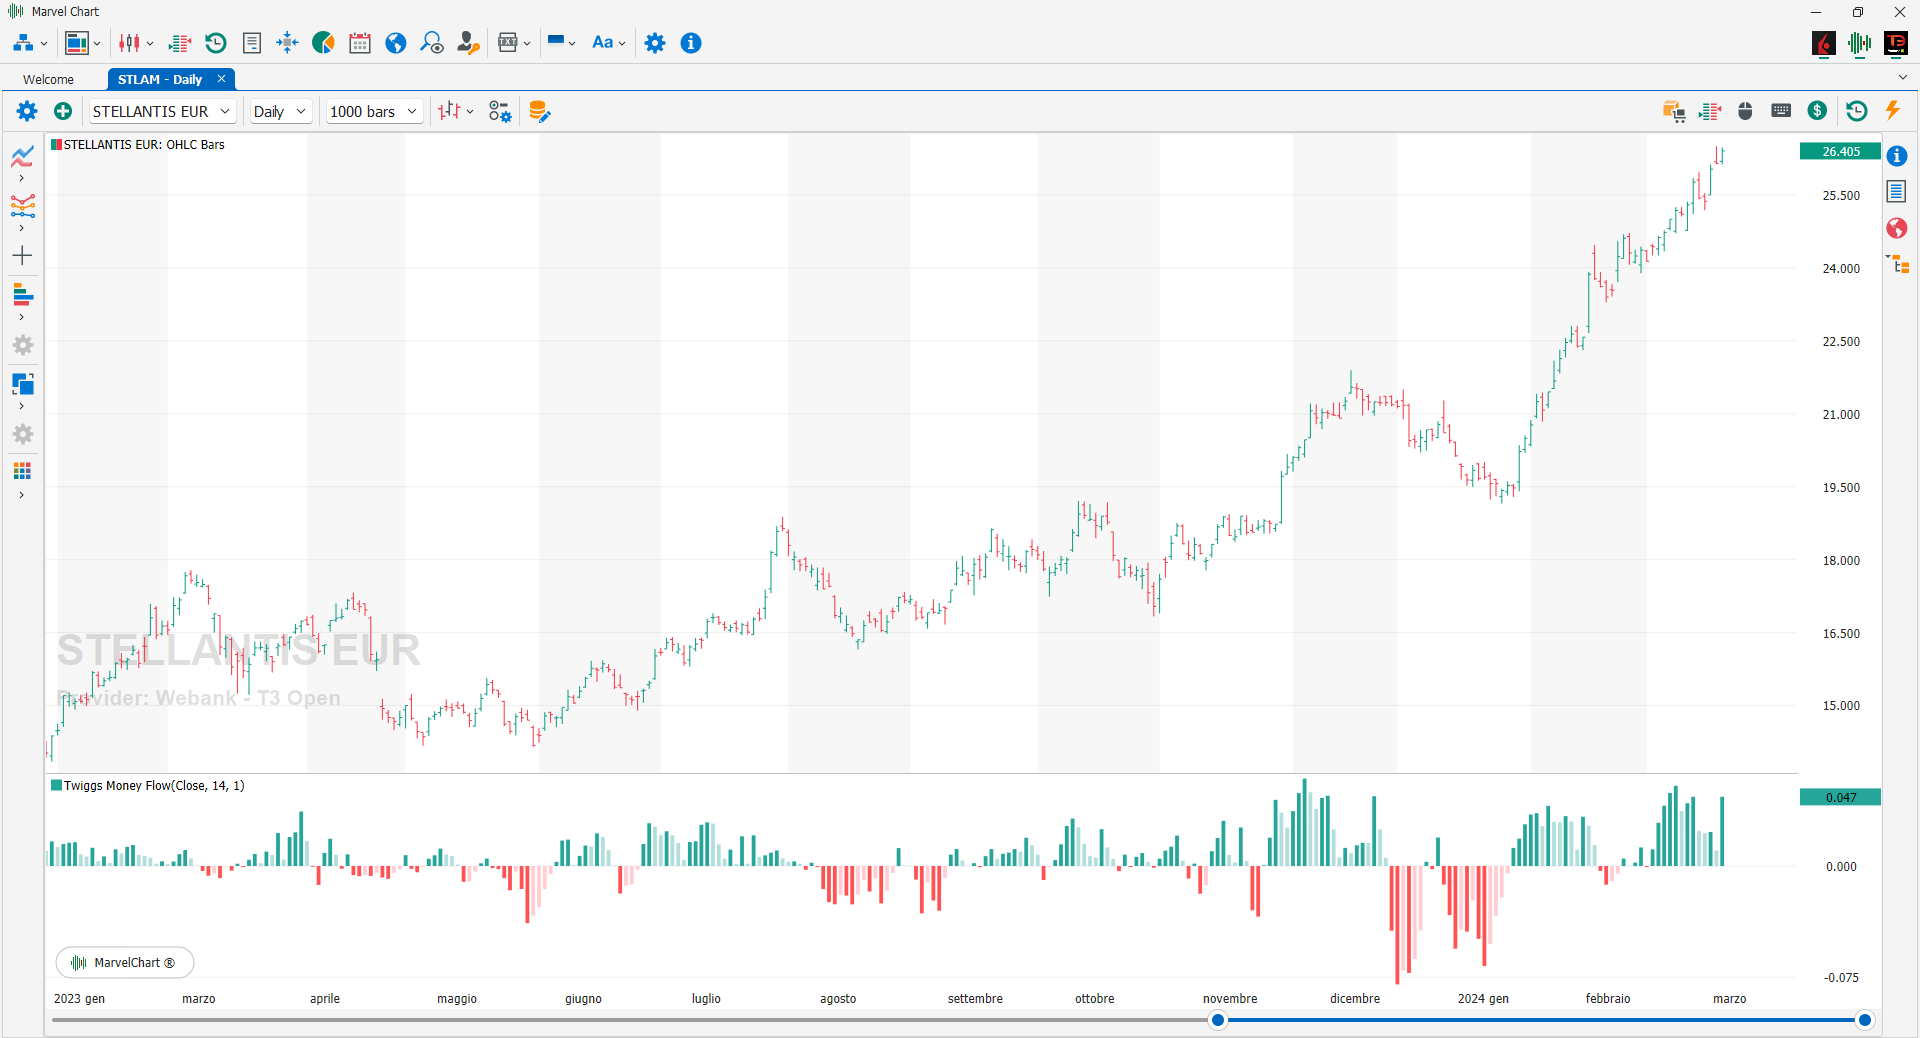
The Twiggs Money Flow is a variant of the Chaikin Money Flow, created by Colin Twiggs. Compared to Chaikin Money Flow, it uses the True Range instead of the HIGH-LOW range, thus limiting the peaks due to gaps in financial instruments. A Welles Wilder Smoothing is also used on volumes to prevent VOLUME peaks from influencing the result. When the Twiggs Money Flow is higher than 0, we are in an accumulation phase, and therefore prices will tend to rise. When Twiggs Money Flow is lower than 0, we are in a distribution phase and prices will tend to move downwards.
Ultimate Oscillator
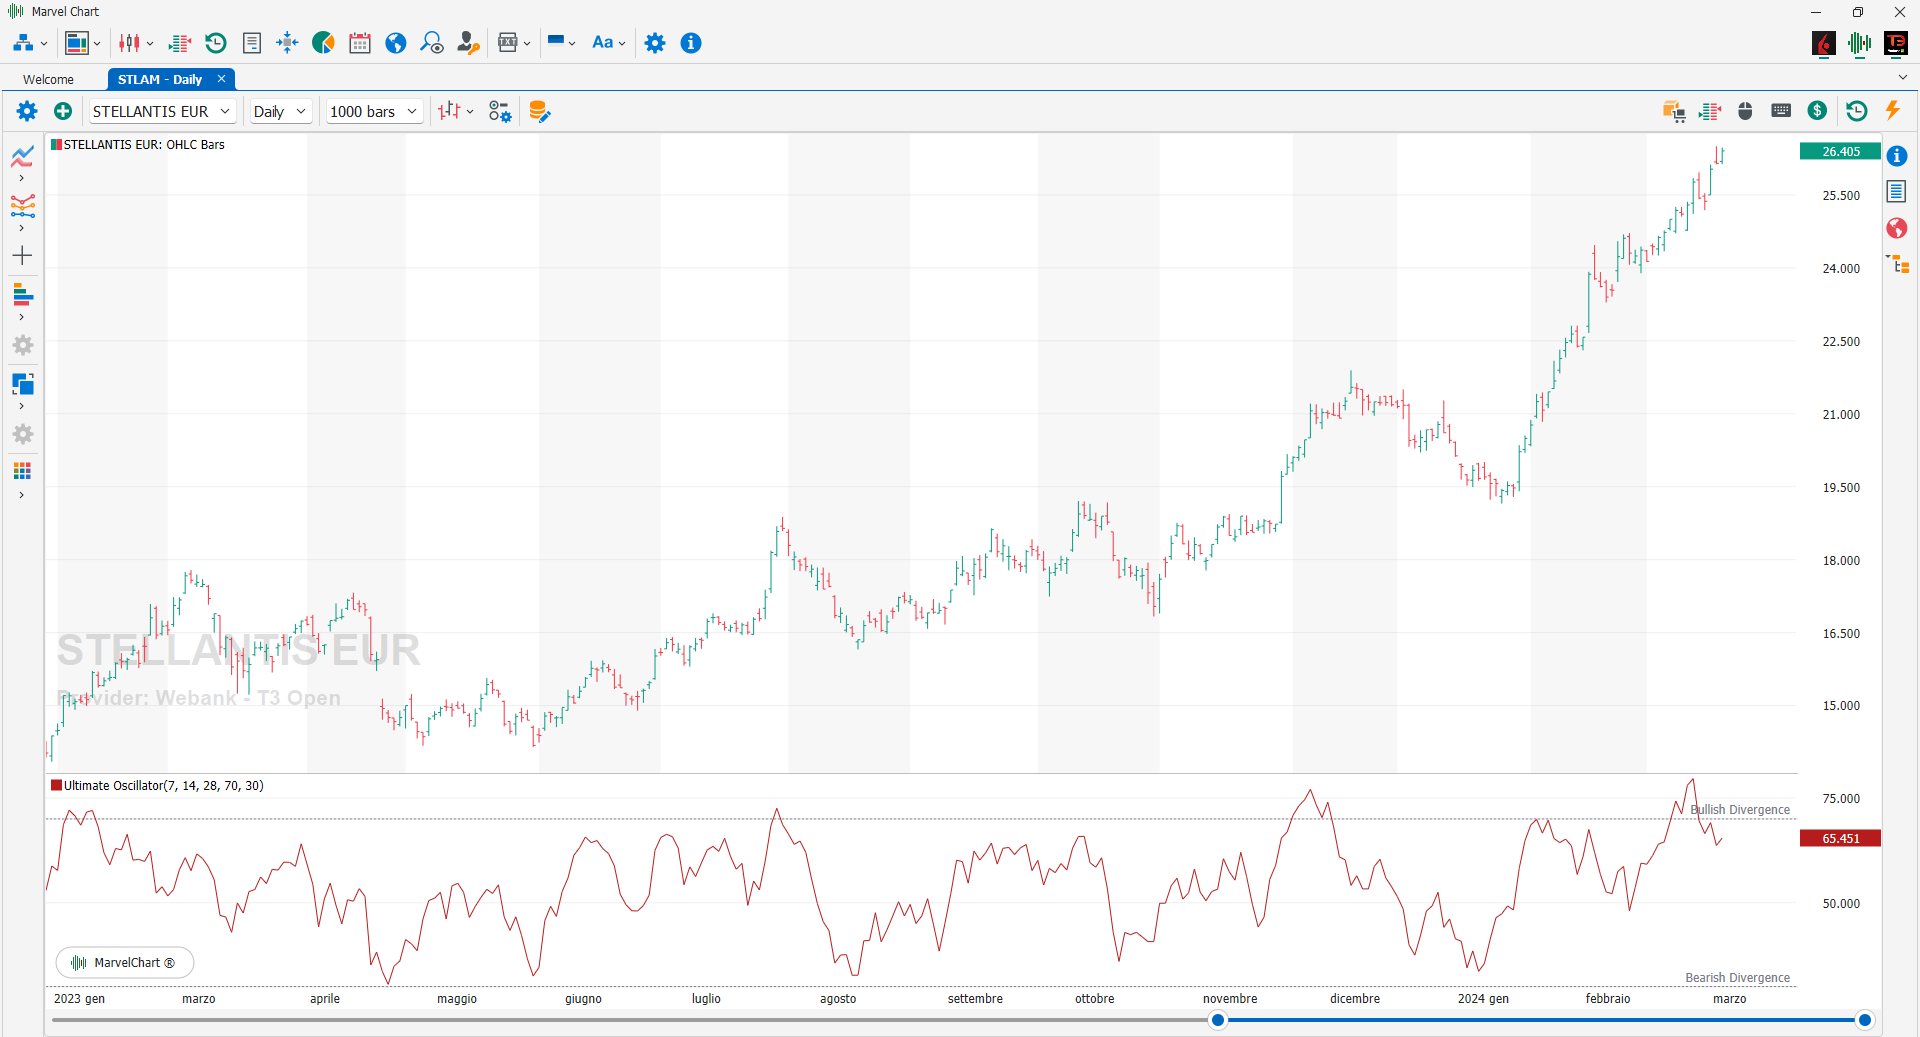
The Ultimate Oscillator combines price action in 3 different types of periods, and aims to define with greater force the possibility of trend reversal. The calculation with which it was defined is based on the current LOW and the CLOSE of the previous day. From here a pressure quotient is developed that intersects with the daily True Range. Then the pressure quotients of the 3 timeframes are added, the True Range of the 3 timeframes and finally the index comes out. The time periods used are representative of the short, medium and long-range phases, for a more in-depth calculation and estimate of a simple oscillator. Usually the periods used are 7-14-28. Another peculiarity is related to the overlap: all 3 periods are included in the calculation, so the 28-time frame also includes the 14th and the 7th.
Williams %R
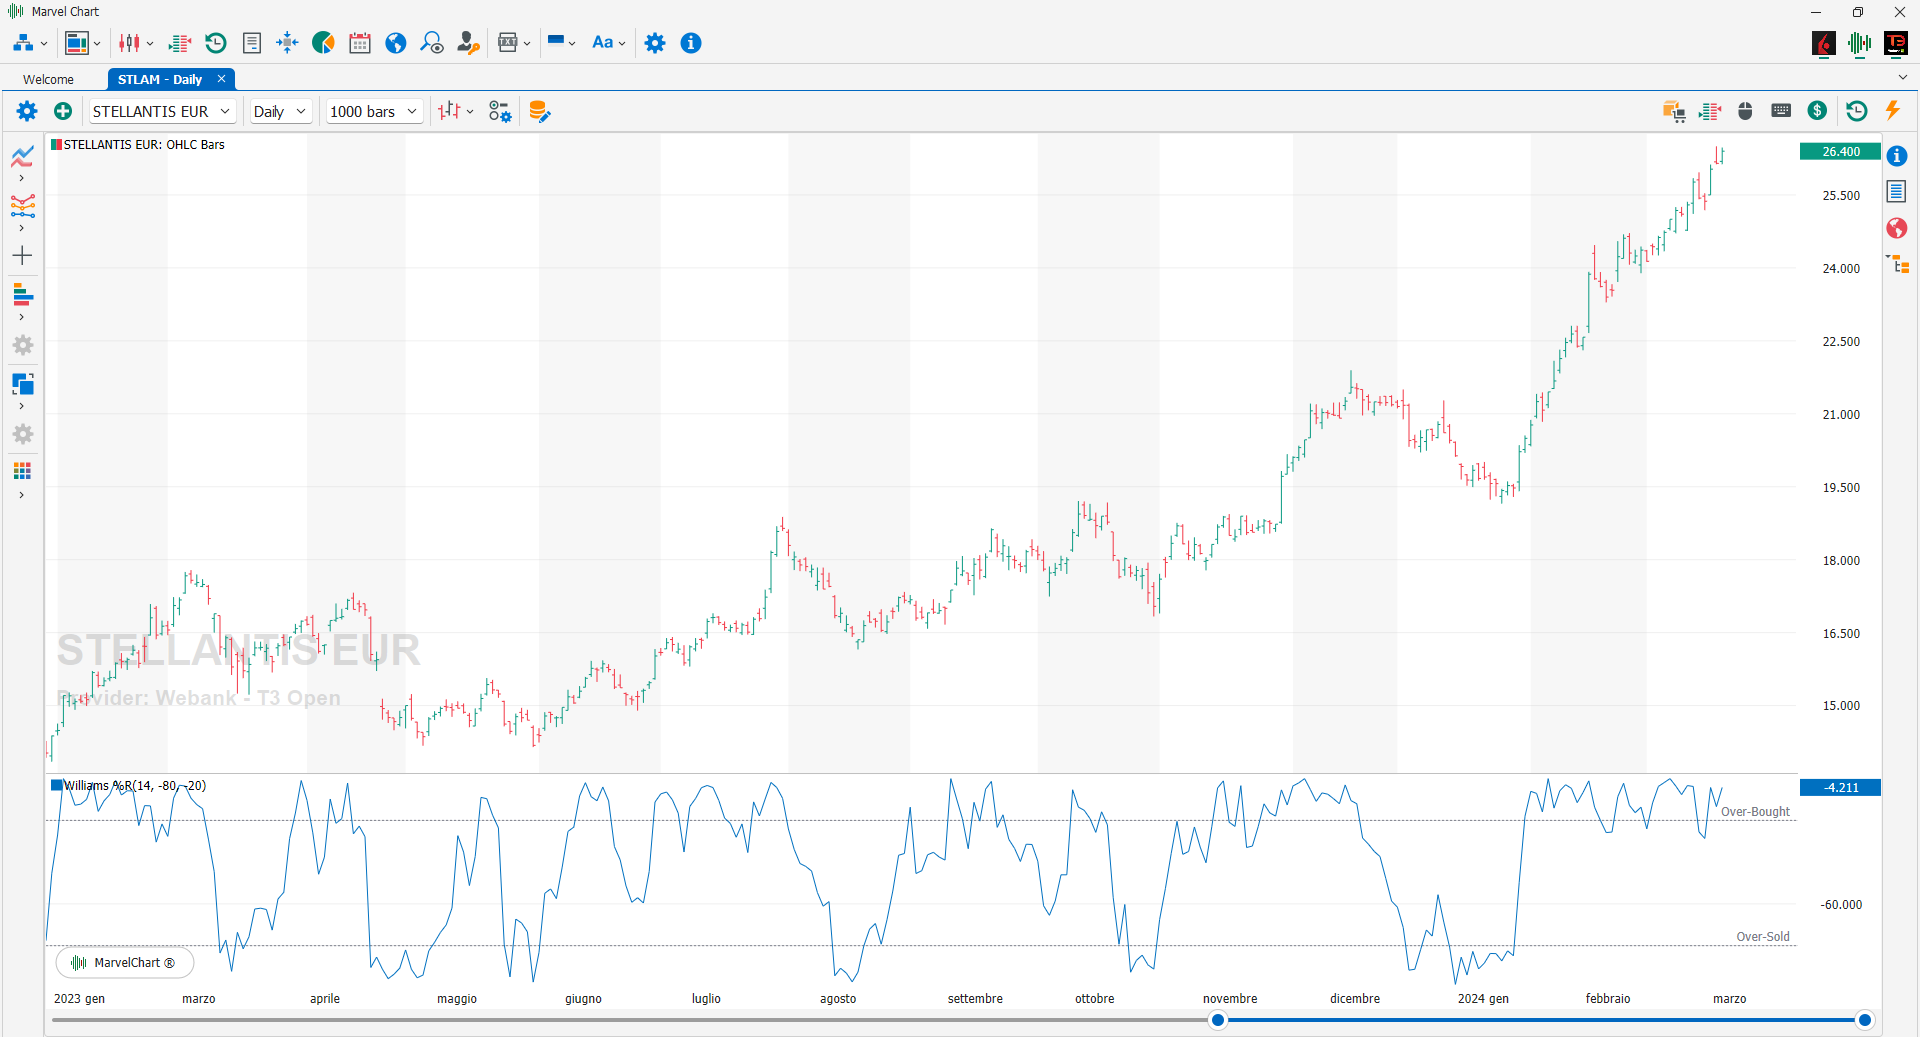
Williams %R is an indicator developed by the famous American trader Larry Williams, which oscillates between 0 and -100, practically on an inverted scale. Two extreme zones of the index are identified, but their reading occurs in a mirror manner to that of the stochastic itself. According to the author, the zones to monitor are -20 and -80. Values above -20 represent the overbought area, while values below -80 represent the oversold area. The buy signal is activated when the indicator, after falling into oversold (below -80), falls above this threshold. On the contrary, the sell signal will start when the indicator in the overbought zone (above -20) falls and violates this threshold.