Volatility
Average Daily Range

The Average Daily Range (ADR) indicator measures the average price movement of a financial asset over a specific period, typically expressed in price points or currency. It helps traders gauge market volatility and can be used to set take-profit and stop-loss levels. The ADR is calculated by averaging the daily price range (high minus low) over a chosen number of periods.
Calculation
Calculate the daily range: For each day, subtract the low price from the high price.
Sum the daily ranges: Add up the daily ranges over the chosen period (e.g., 14 days).
Divide by the number of periods: Divide the sum by the number of days in the period to get the average daily range (ADR).
Usage
Volatility Measurement
The ADR provides a quantitative measure of the average price movement, allowing traders to assess the volatility of an asset.
Position Sizing
By understanding the average daily range, traders can adjust their position sizes to align with the expected price movement.
Setting Stop-Loss and Take-Profit Levels
The ADR can be used to define appropriate stop-loss and take-profit orders, aiming for a multiple of the average daily range.
Identifying Potential Support and Resistance
Traders can use the ADR to identify potential support and resistance levels based on price extensions from previous days.
Analyzing Market Conditions
The ADR can help traders assess whether current price action is within the expected range or if there are unusual movements.
Example
If a stock's 14-day ADR is $1.50, it means the stock typically moves $1.50 up or down on average each day. Traders might use this information to set stop-loss orders at $0.75 (half the ADR) below their entry price and take-profit orders at $1.50 above their entry price.
Average True Range
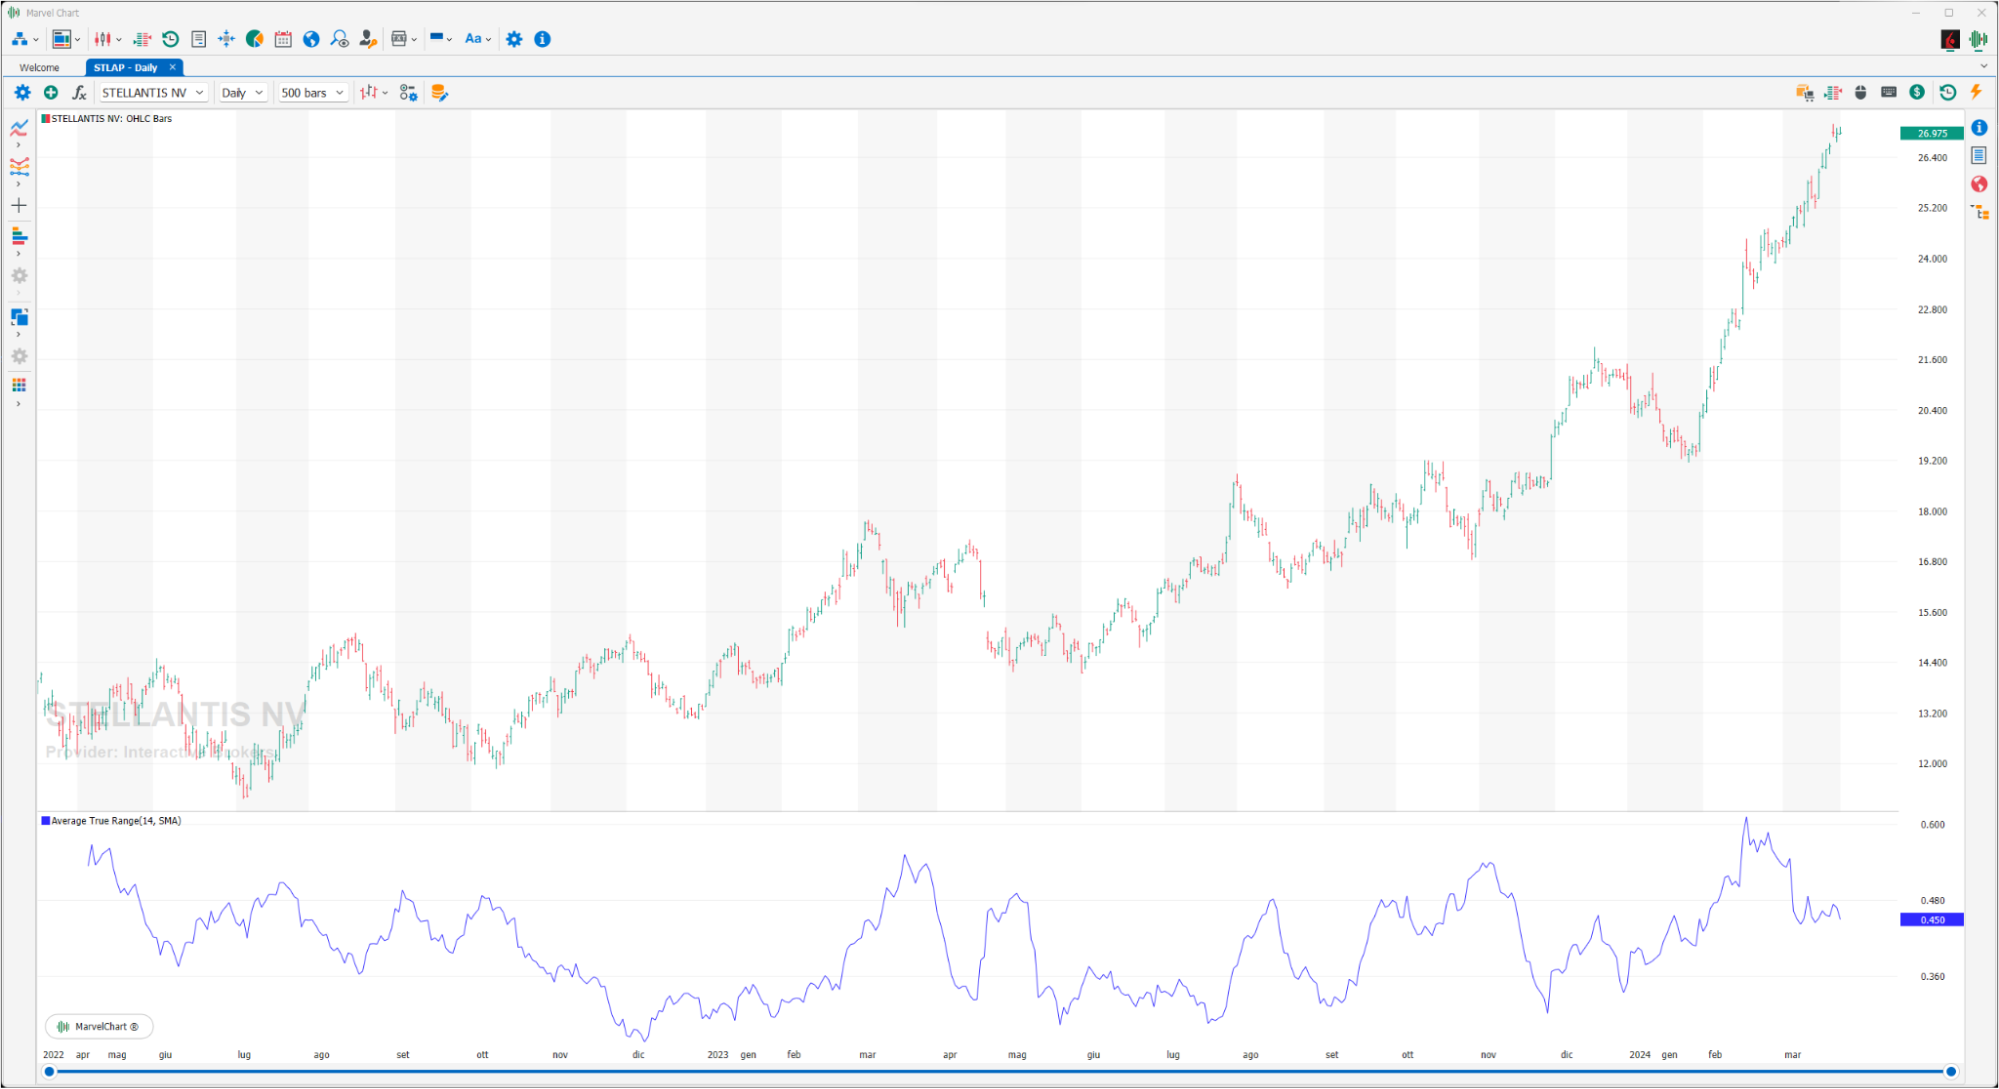
The Average True Range (ATR) is a volatility indicator, developed by John Welles Wilder. It therefore measures the volatility of prices, i.e. their oscillations with the aim of signaling a possible reversal of the current trend starting from the assumption that in the presence of a trend reversal the volatility assumes extreme values, positive or negative. The Average True Range is calculated by applying a “Moving Average” on the “True Range” indicator, over a period that Welles Wilder recommends equal to 14. Welles Wilder recommends 14 because it is half of 28, i.e. a lunar cycle, which Welles Wilder considers the prevalent cycle in the short-term market.
Balance of Power
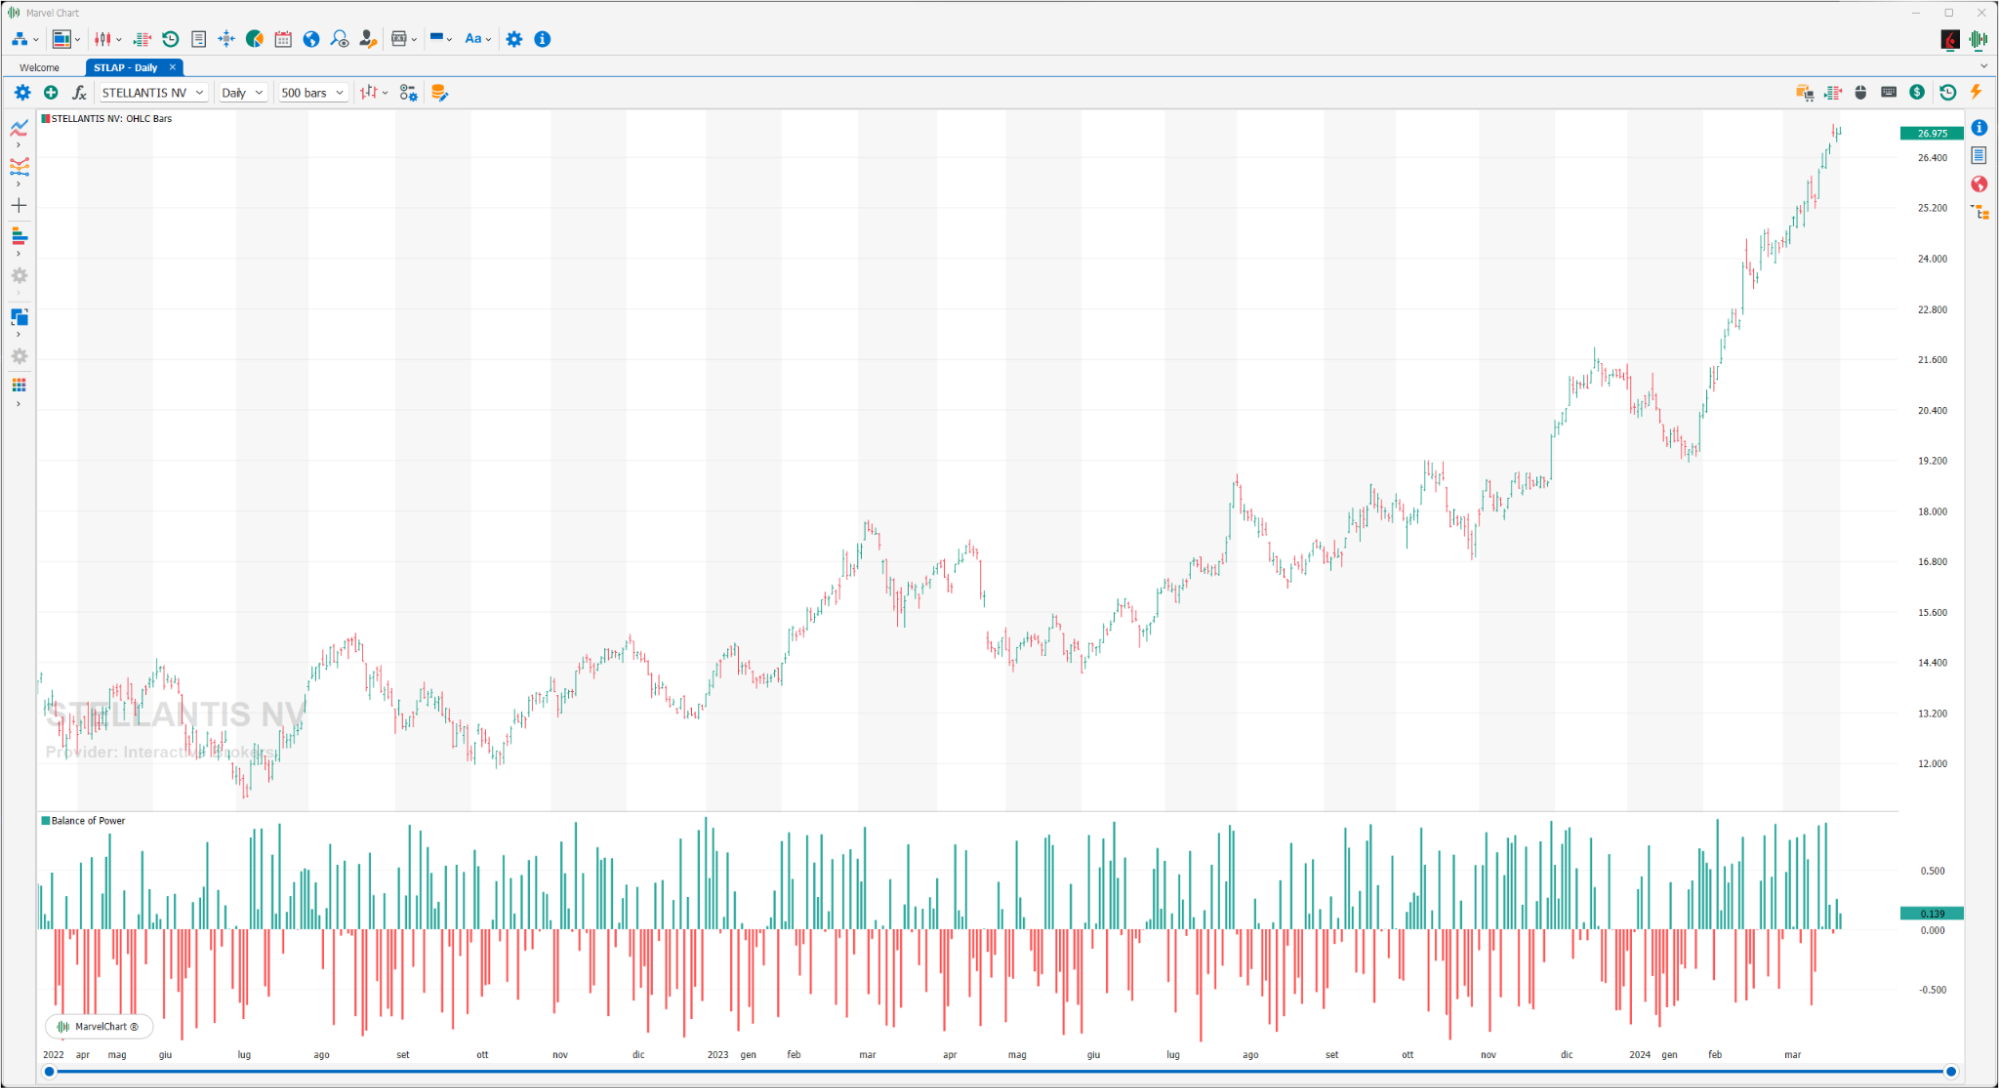
Balance of Power (BOP) is a price-based indicator used by analysts to gauge the overall strength of buyers and sellers in the market. The BOP oscillates around the zero line, where positive values indicate bullish market dominance and negative values indicate bearish market dominance. By itself, the BOP is not a particularly smooth indicator, and is therefore best paired with an indicator that can counteract it by providing essential smoothness. Pairing the BOP with the simple moving average (SMA), for example, results in a smooth and visually correct analysis.
Blast Off
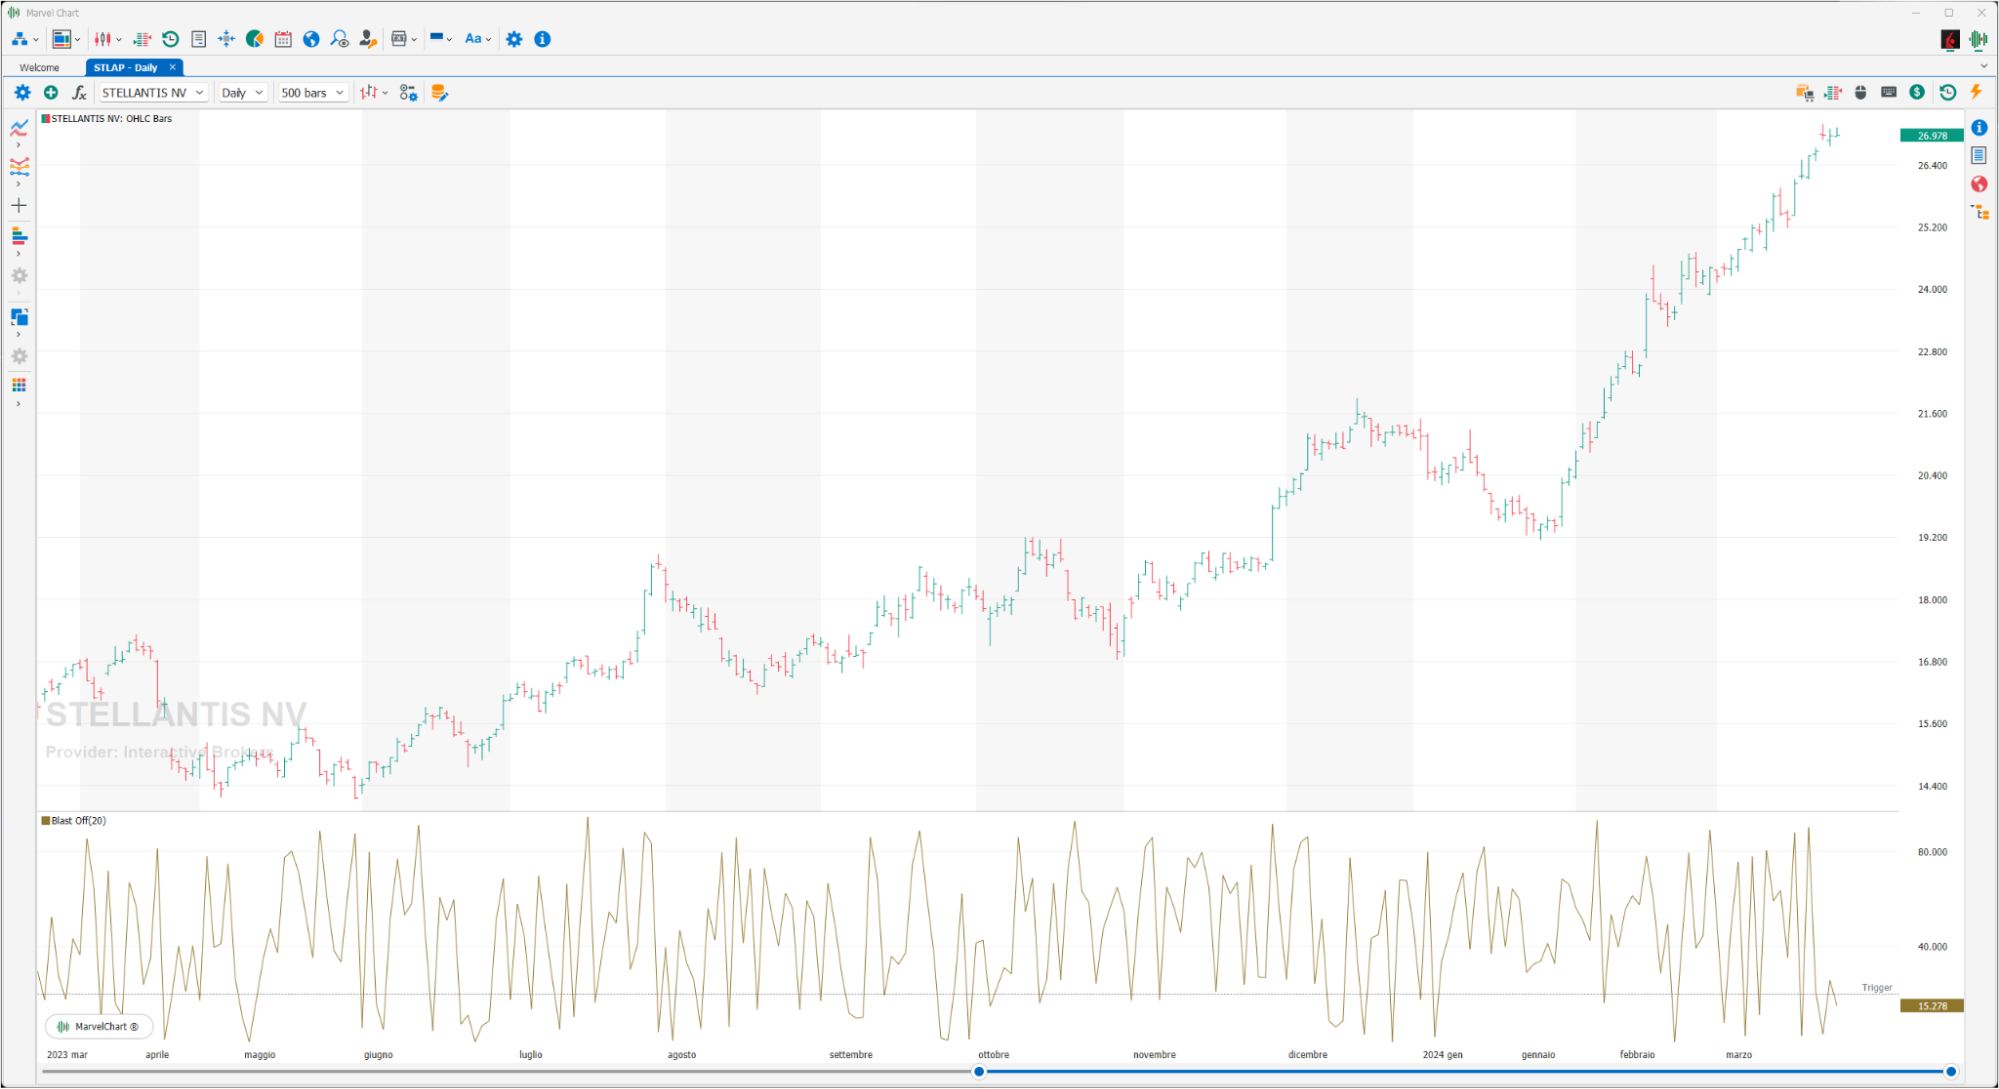
Indicator created by Larry Williams, who in 2002 called this indicator Blast Off, which translated means to jump off. The indicator aims to identify price explosions, both positive and negative. To achieve this, the OPEN and CLOSE values are compared with the HIGH and LOW and if the difference between the OPEN and CLOSE of the day is less than 20% of the range (HIGH-LOW), a price explosion is likely to occur, or if the absolute value of (OPEN-CLOSE) / HIGH-LOW is less than 20% a Blast Off is expected.
Bollinger Bands Width
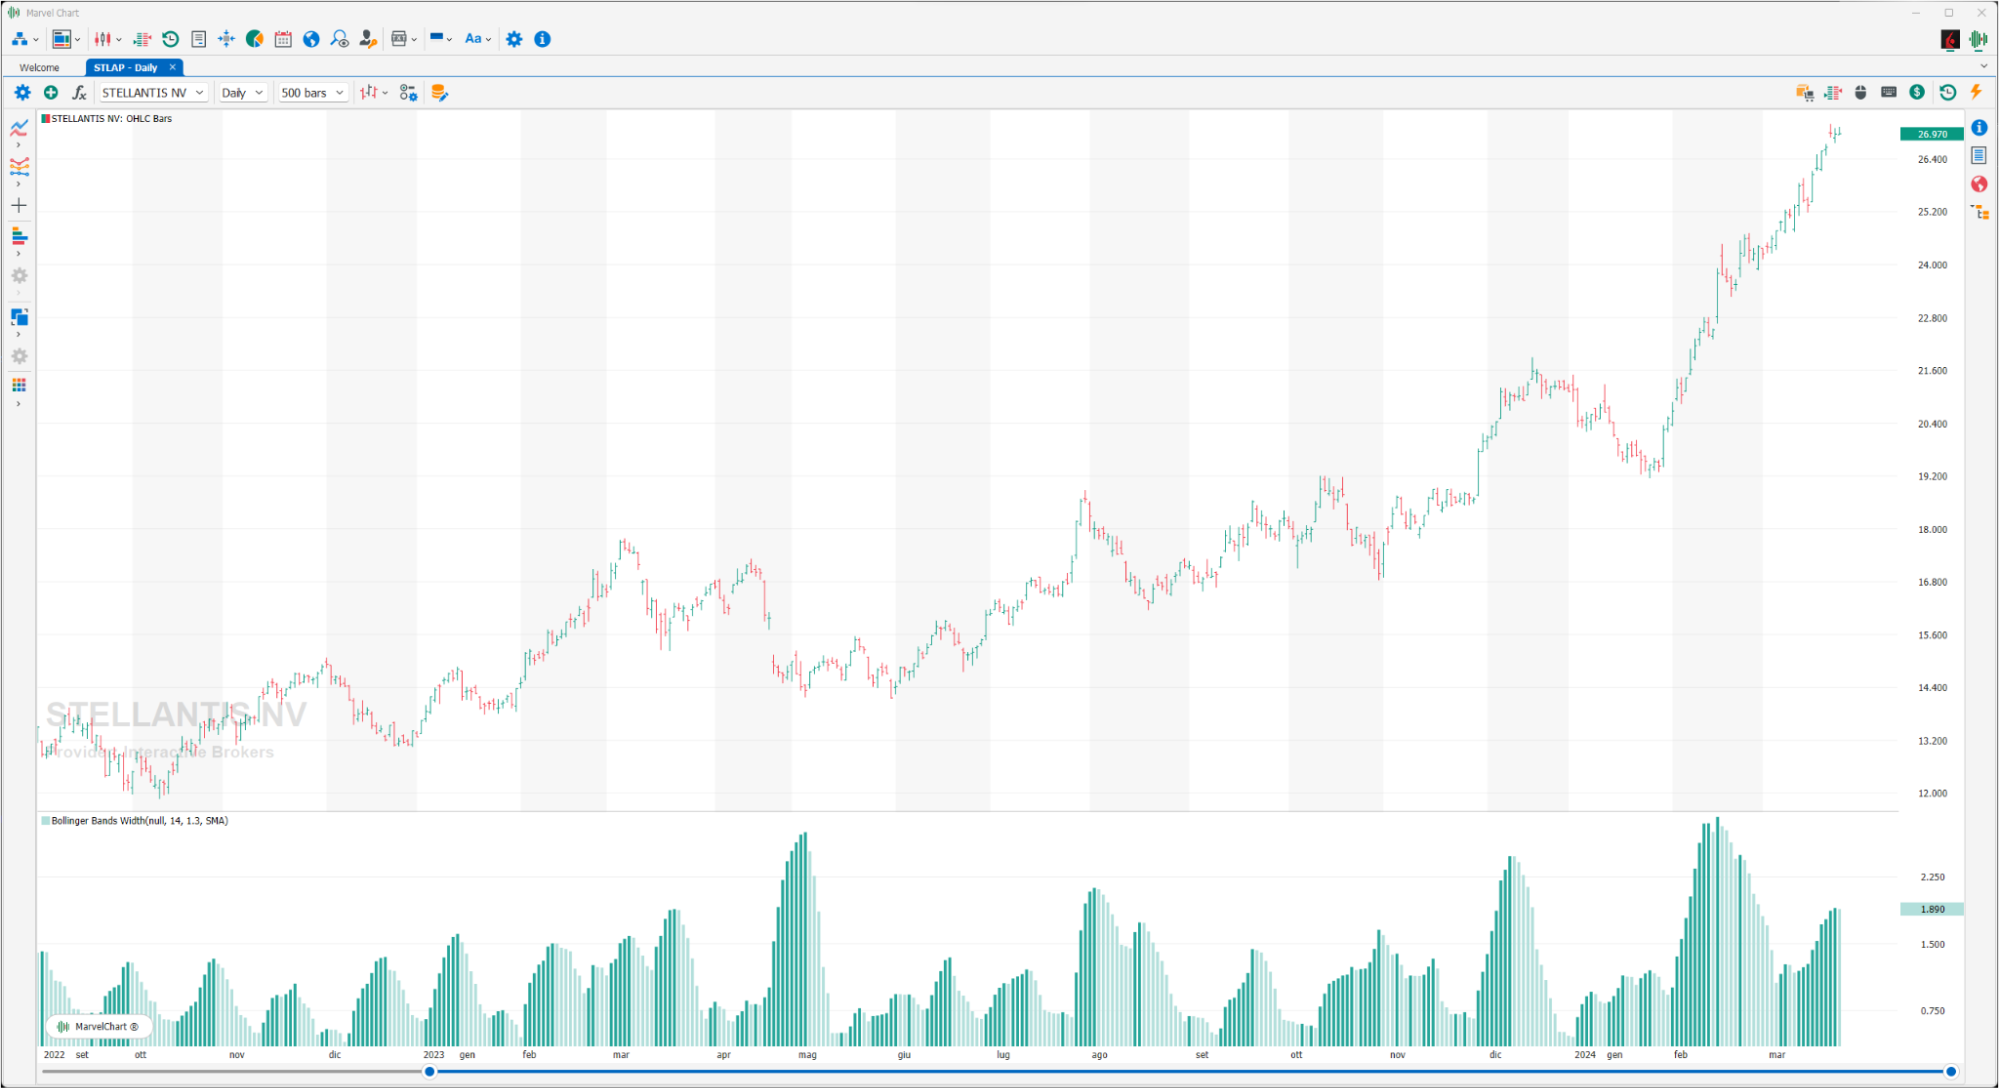
The Bollinger Bands Width is the difference between the upper and lower Bollinger Bands divided by the middle band. This indicator provides an easy way to visualize consolidation before price moves (low bandwidth values) or periods of increased volatility (high bandwidth values). The width of the Bollinger Bands uses the same two parameters as the Bollinger Bands: a simple moving average period (for the middle band) and the number of standard deviations by which the upper and lower bands should be offset from the middle band. During a period of increasing price volatility, the distance between the two bands will widen and the width of the Bollinger Band will increase. Conversely, during a period of low market volatility, the distance between the two bands will contract and the width of the Bollinger Band will decrease. There is a tendency for the bands to alternate between expanding and contracting. When the bands are relatively far apart, it is often a sign that the current trend may be ending. When the distance between the two bands is relatively narrow, it is often a sign that a market or security may be about to begin a sharp move in either direction. The graphical representation is by histogram as a function of the aforementioned width.
Chaikin Volatility
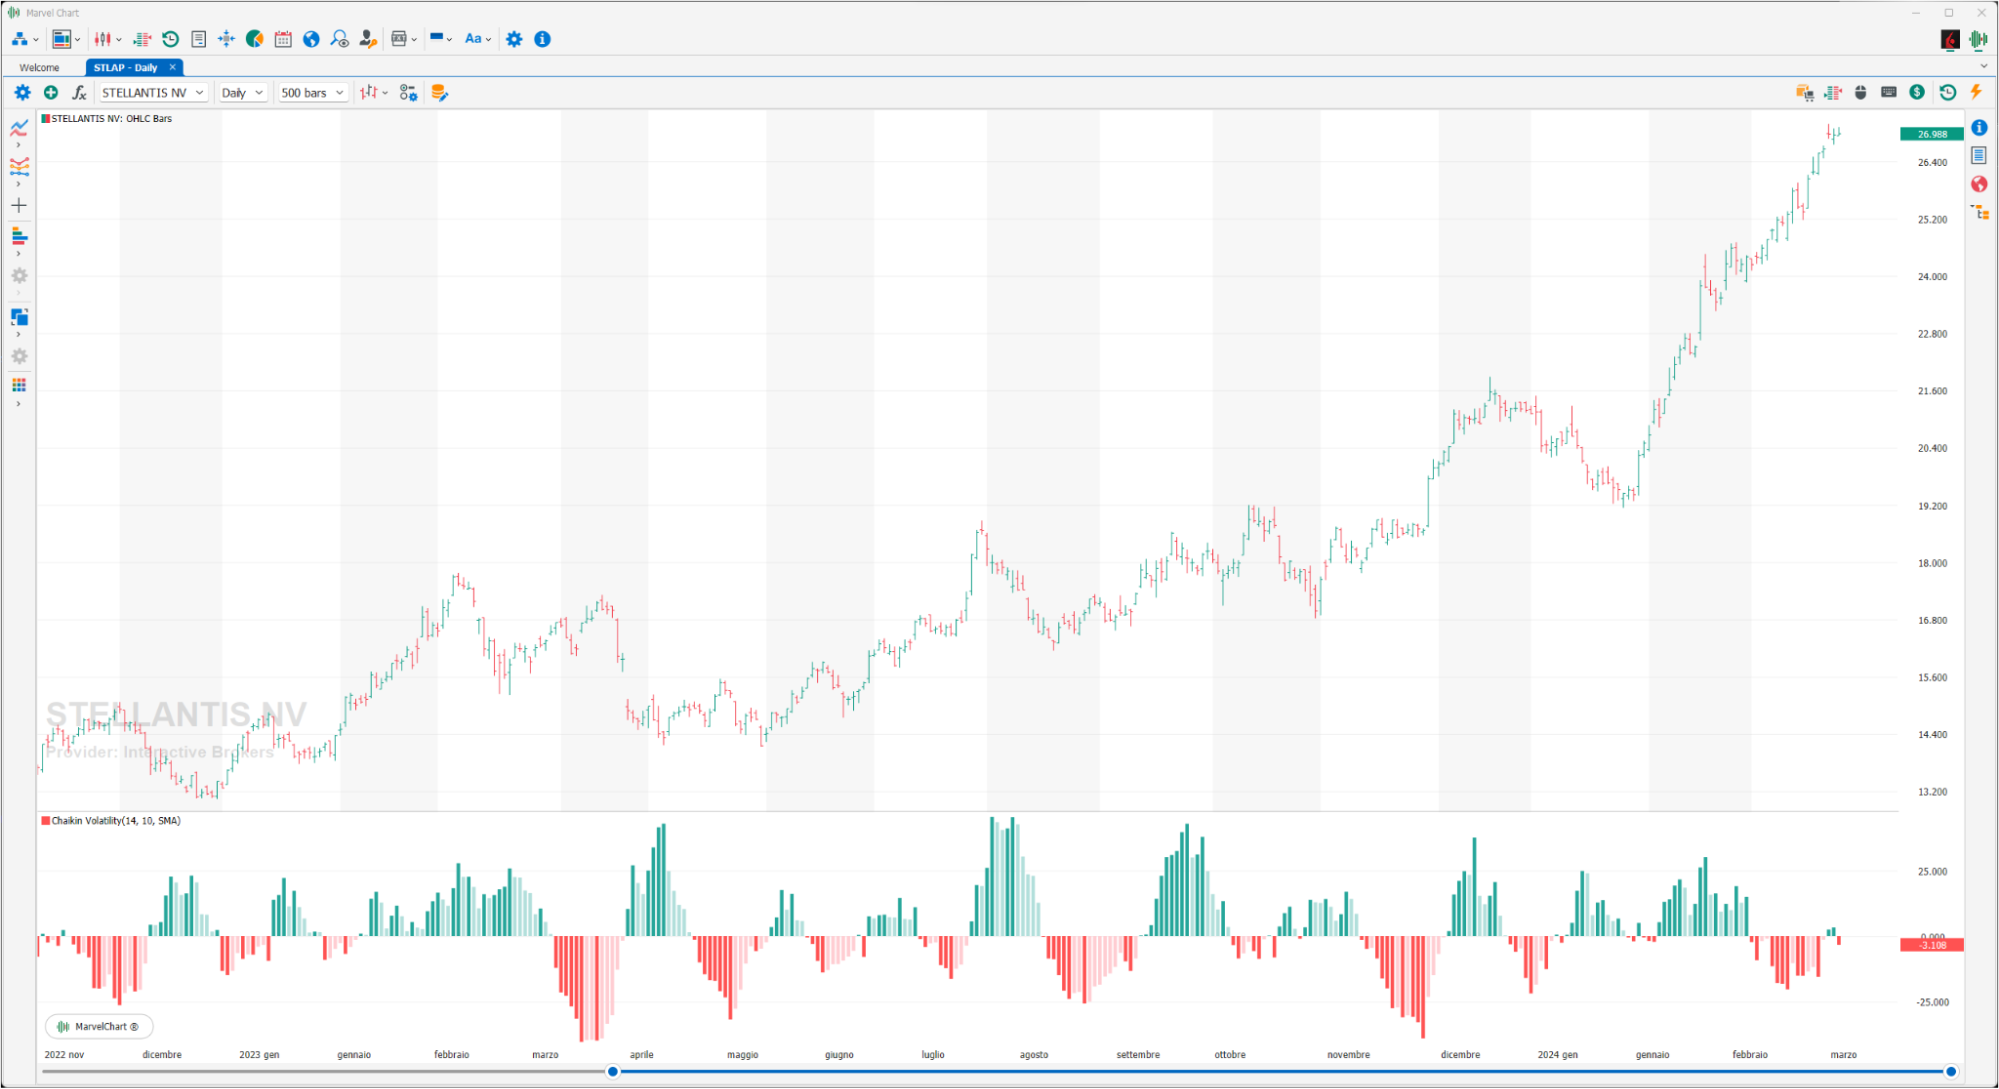
The Chaikin Volatility indicator calculates the difference (spread) between HIGH and LOW prices, therefore it evaluates the volatility of a series of historical data. To do this, it basically calculates a moving average of the difference between the maximum and minimum and then calculates the ROC on this average. The Chaikin Volatility does not take into account gaps that occur when the minimum traded price is higher than the maximum of the previous day or the maximum traded price is lower than the minimum of the previous day. Obviously, since the indicator measures the volatility of a stock, high values indicate that prices change a lot during the day, while low values indicate that prices remain relatively constant. According to the Chaikin interpretation, an increase in a volume indicator over a relatively short period of time – and therefore an increase in volatility as measured by the Chaikin – means that prices are approaching their low (such as when stocks are sold in a panic), while a decrease in volatility over a longer period of time indicates that prices are at their high (for example, in a mature bull market). A completely opposite method of interpreting the Chaikin is to assume that market highs are usually accompanied by increased volatility and the late stages of lows by decreased volatility.
Choppiness Index
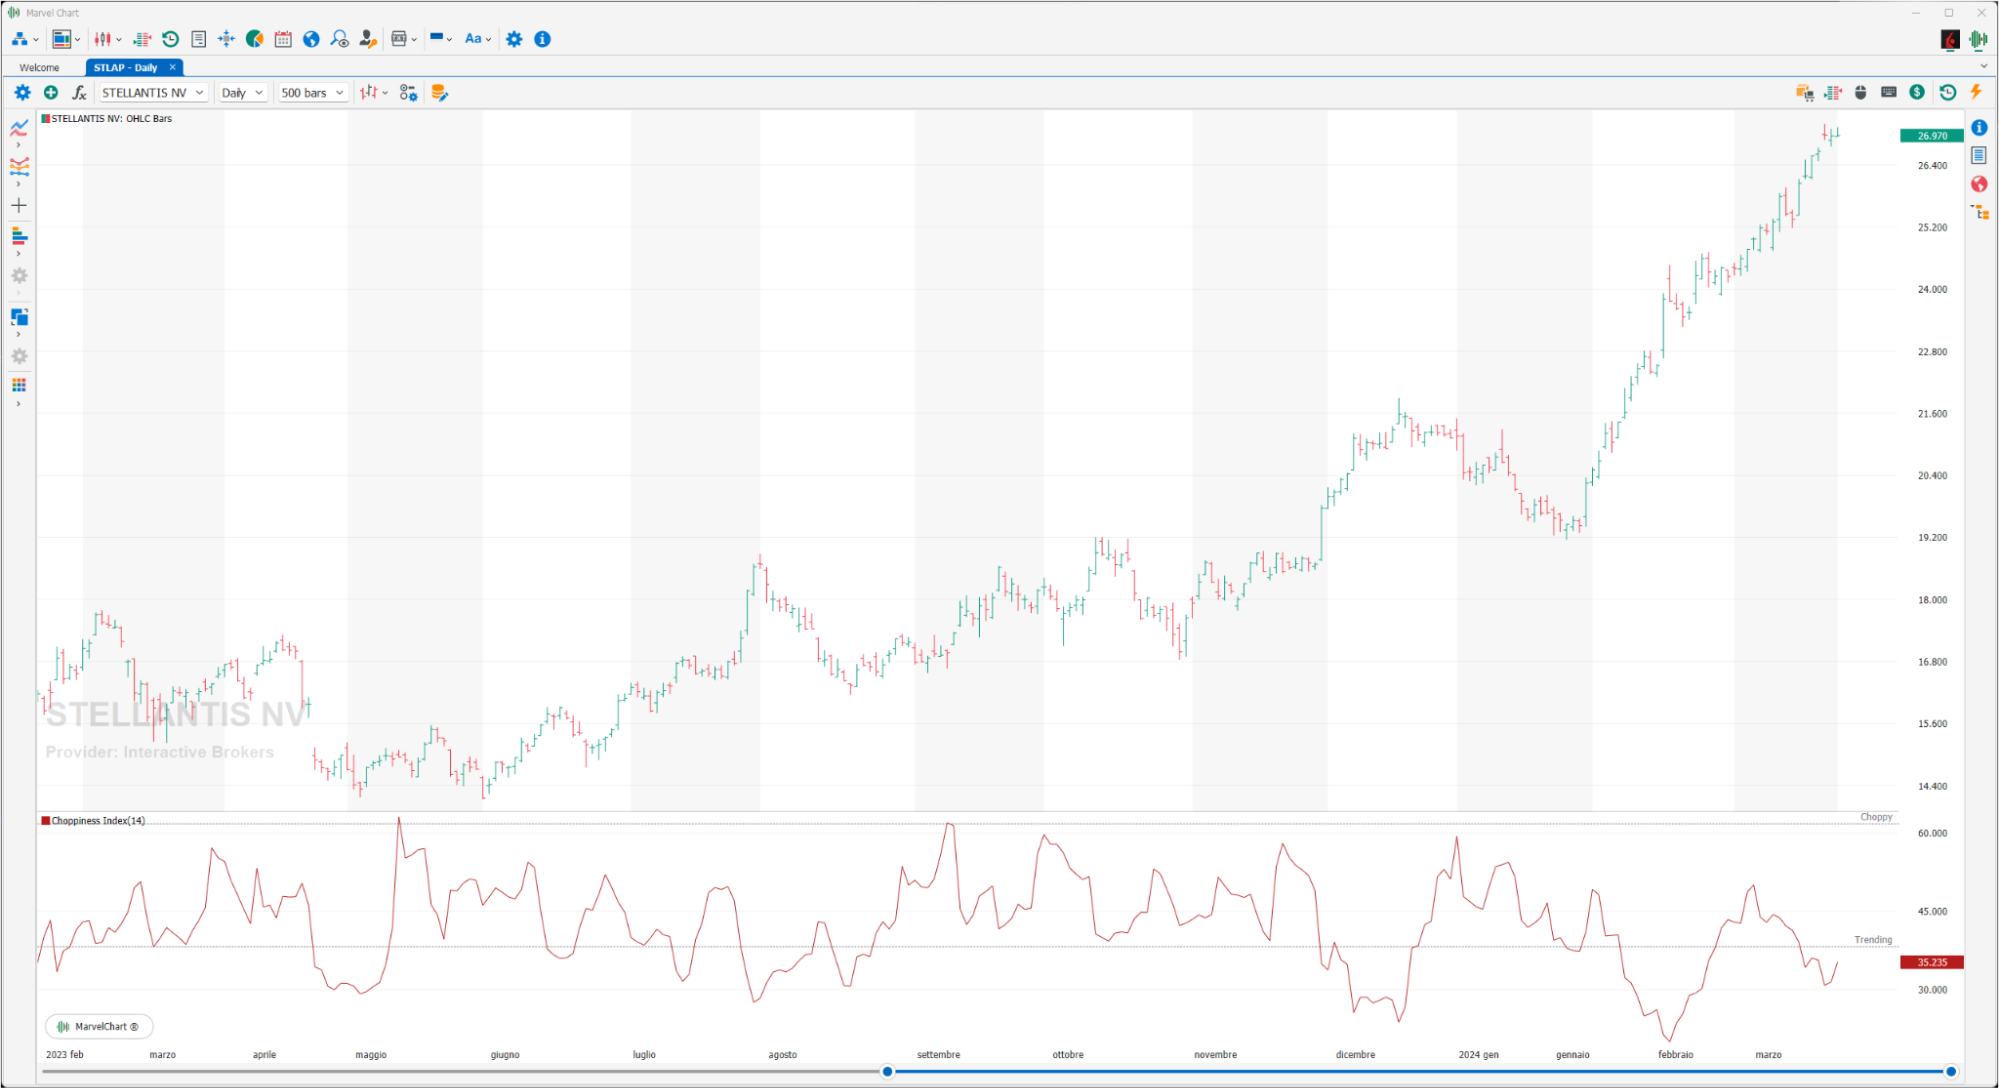
The Choppiness Index (CHOP) is an indicator designed to determine whether the market is choppy (trading sideways) or not choppy (trading in a trend in either direction). The Choppiness Index is an example of an indicator that is not directional at all. The CHOP is not intended to predict the future direction of the market, it is a metric to be used only to define the trend of the market. A basic understanding of the indicator would be: higher values equate to greater volatility, while lower values indicate a directional trend.
Efficiency Ratio
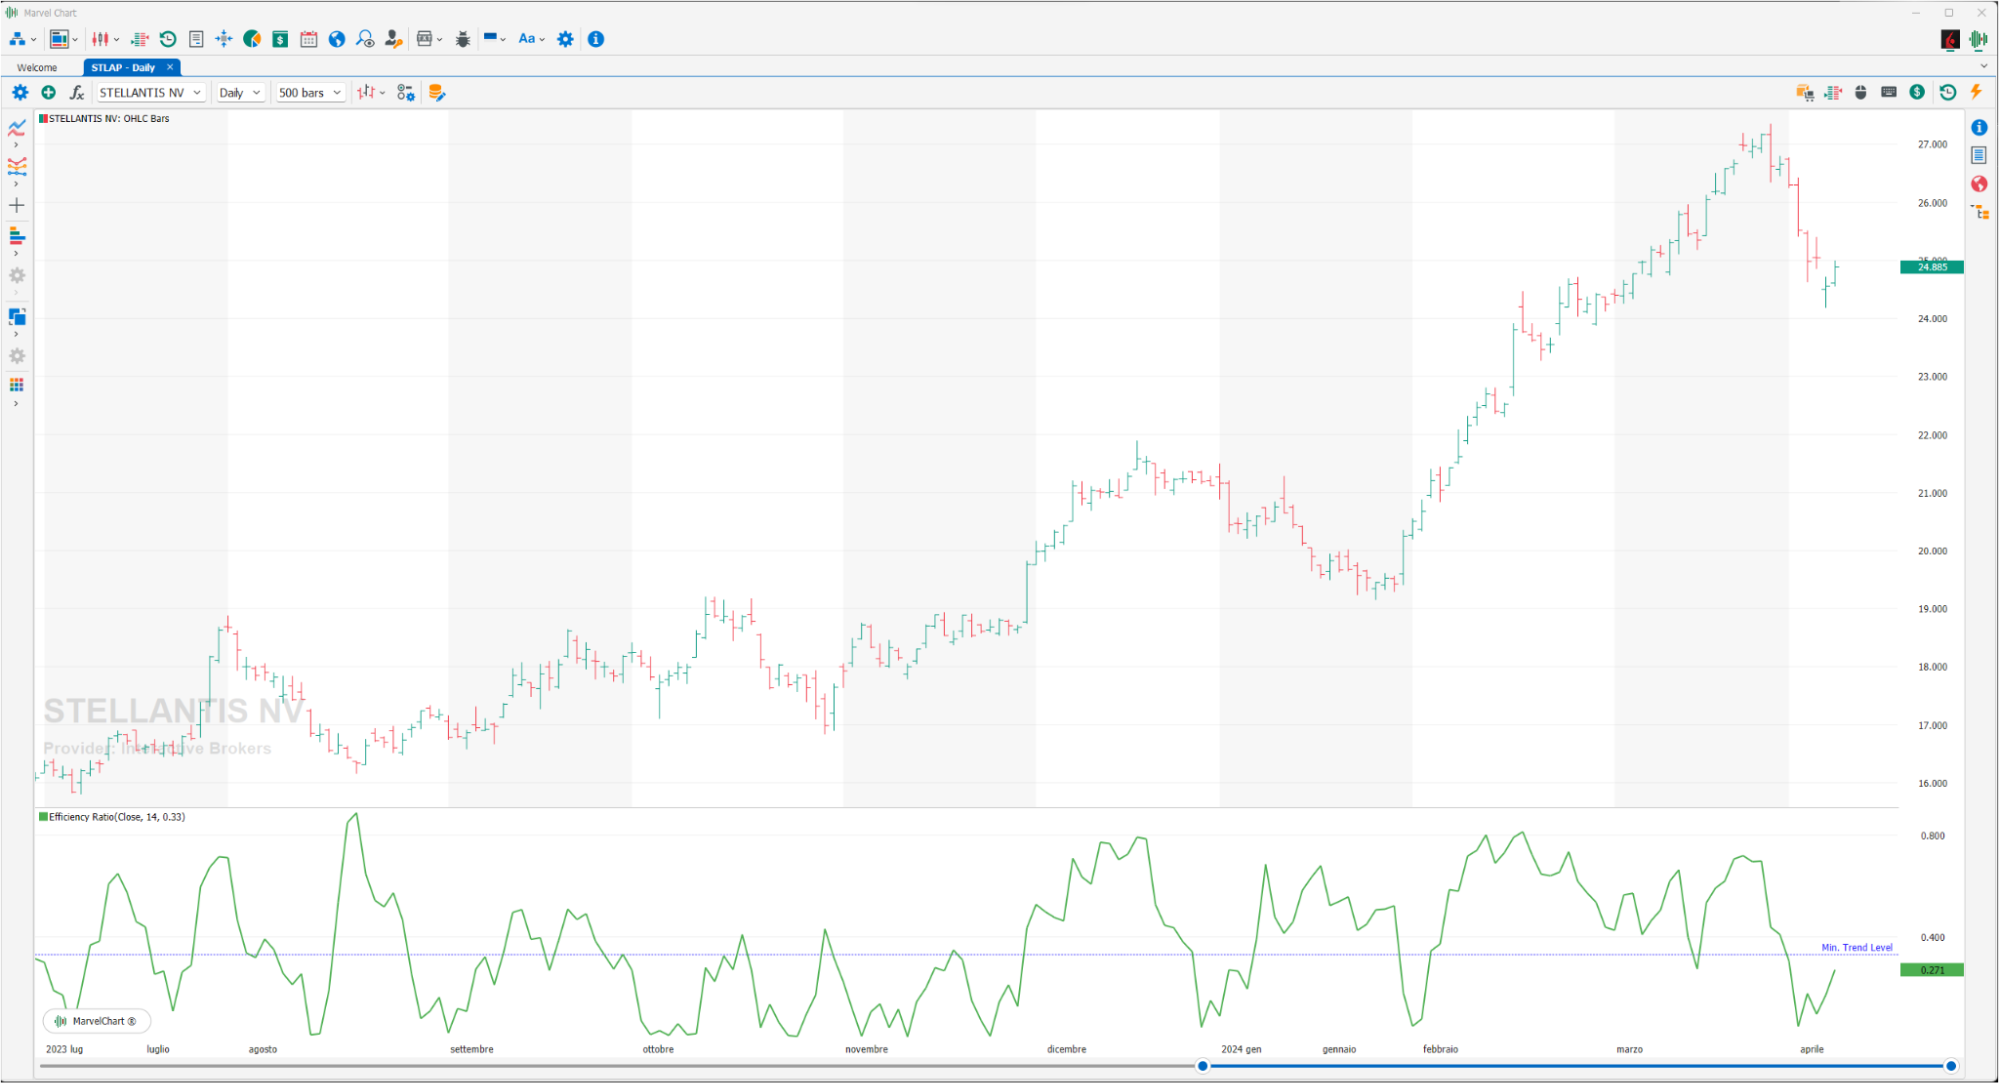
The Efficiency Ratio (ER) was first introduced by Perry Kaufman in his 1995 book “Smarter Trading”. It is calculated by dividing the price change over a period by the absolute sum of the price movements that occurred to obtain that change. The resulting ratio ranges between 0 and 1 with higher values representing a more efficient or trending market. The value of ER varies between 0 and 1. It has a value of 1 when prices move in the same direction for the entire time over which the indicator is calculated, it has a value of 0 when prices remain unchanged in the n periods. When prices move with large oscillations within the interval, the sum of the denominator becomes very large compared to the numerator and ER approaches zero. A trend is considered “persistent” only when RE is higher than a certain value, e.g. 0.3 or 0.4.
Elder Thermometer Index
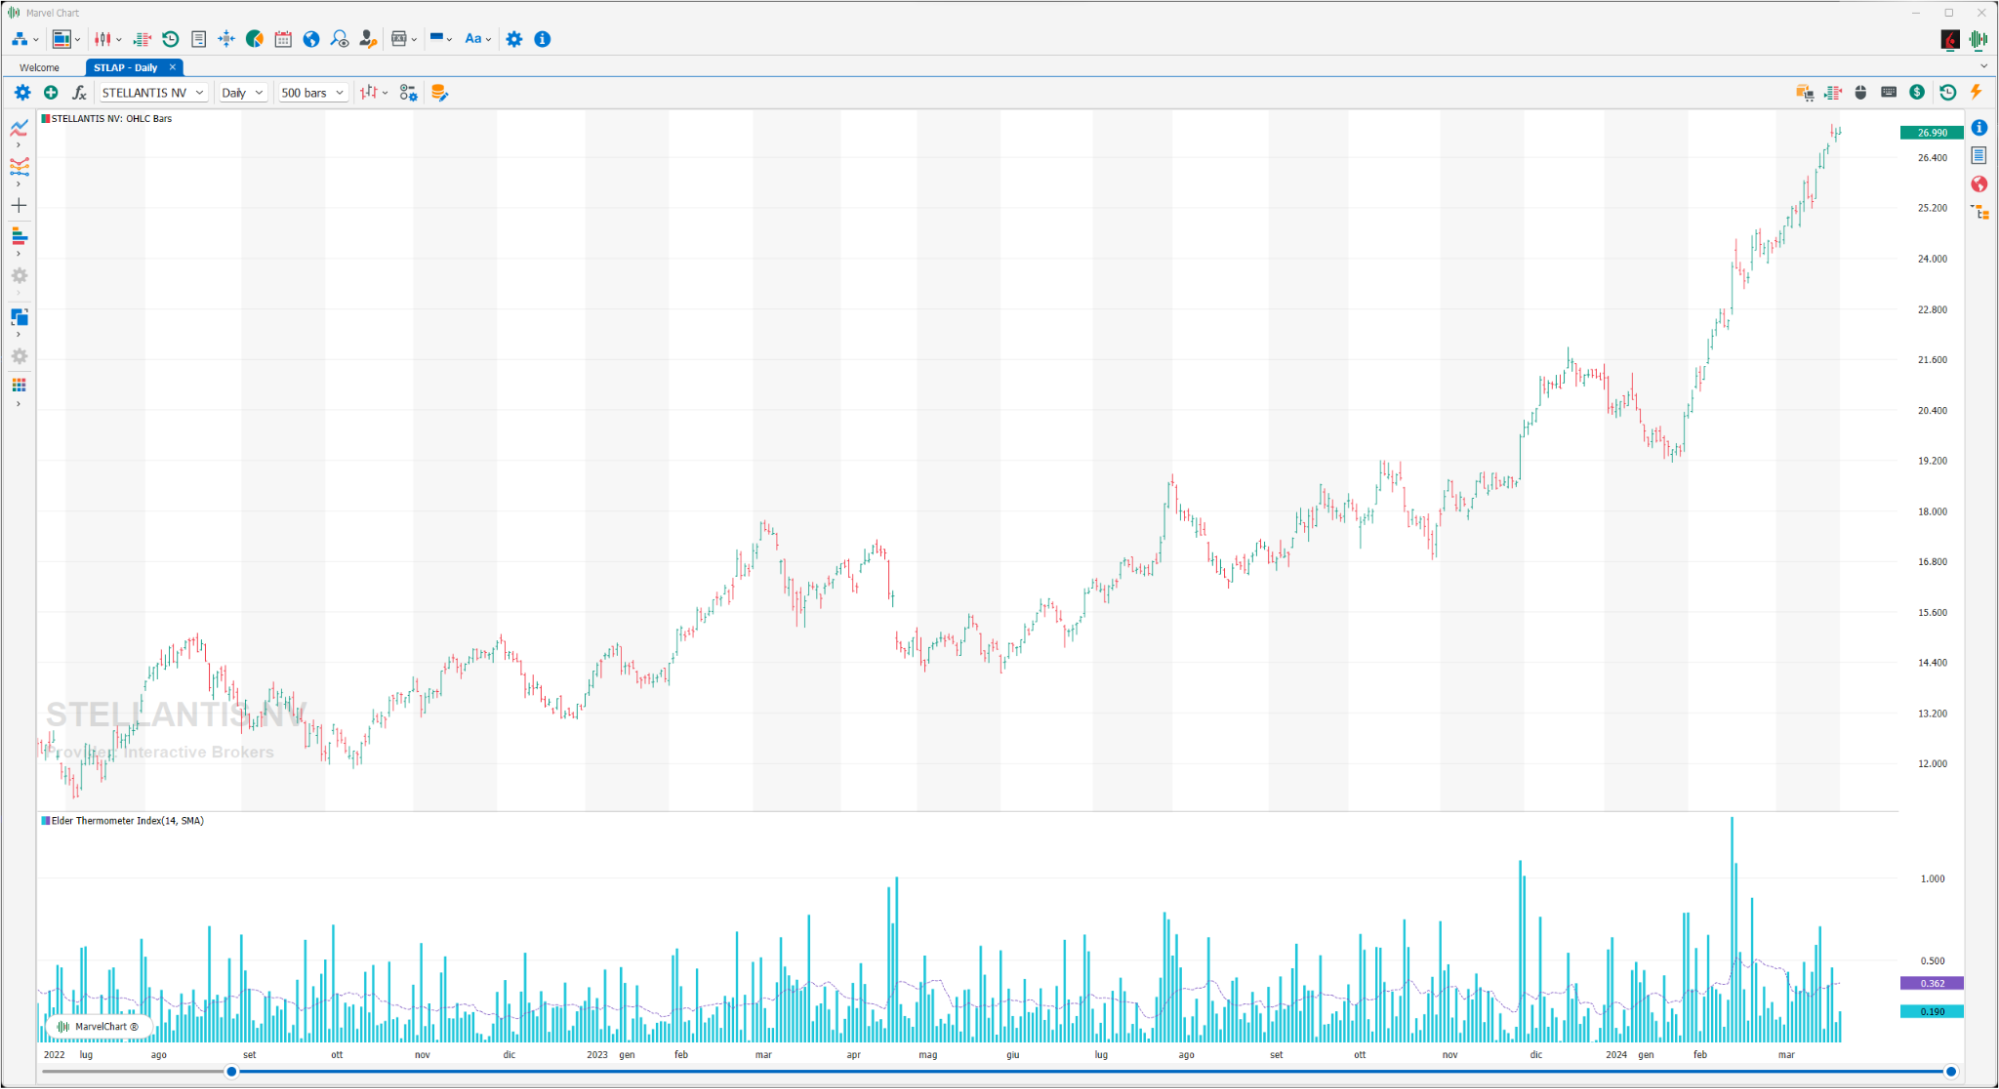
The Elder Thermometer Index indicator was developed by Alexander Elder. It is composed of two components, Elder Thermometer and Elder Thermometer Average. For correct visualization it is advisable to display the first as a histogram and the second as a line to better see the intersections. The author assigns a BUY signal when the Elder Thermometer is lower than the Elder Thermometer Average, and vice versa a SELL signal when the Elder Thermometer is higher than the Elder Thermometer Average.
High Minus Low
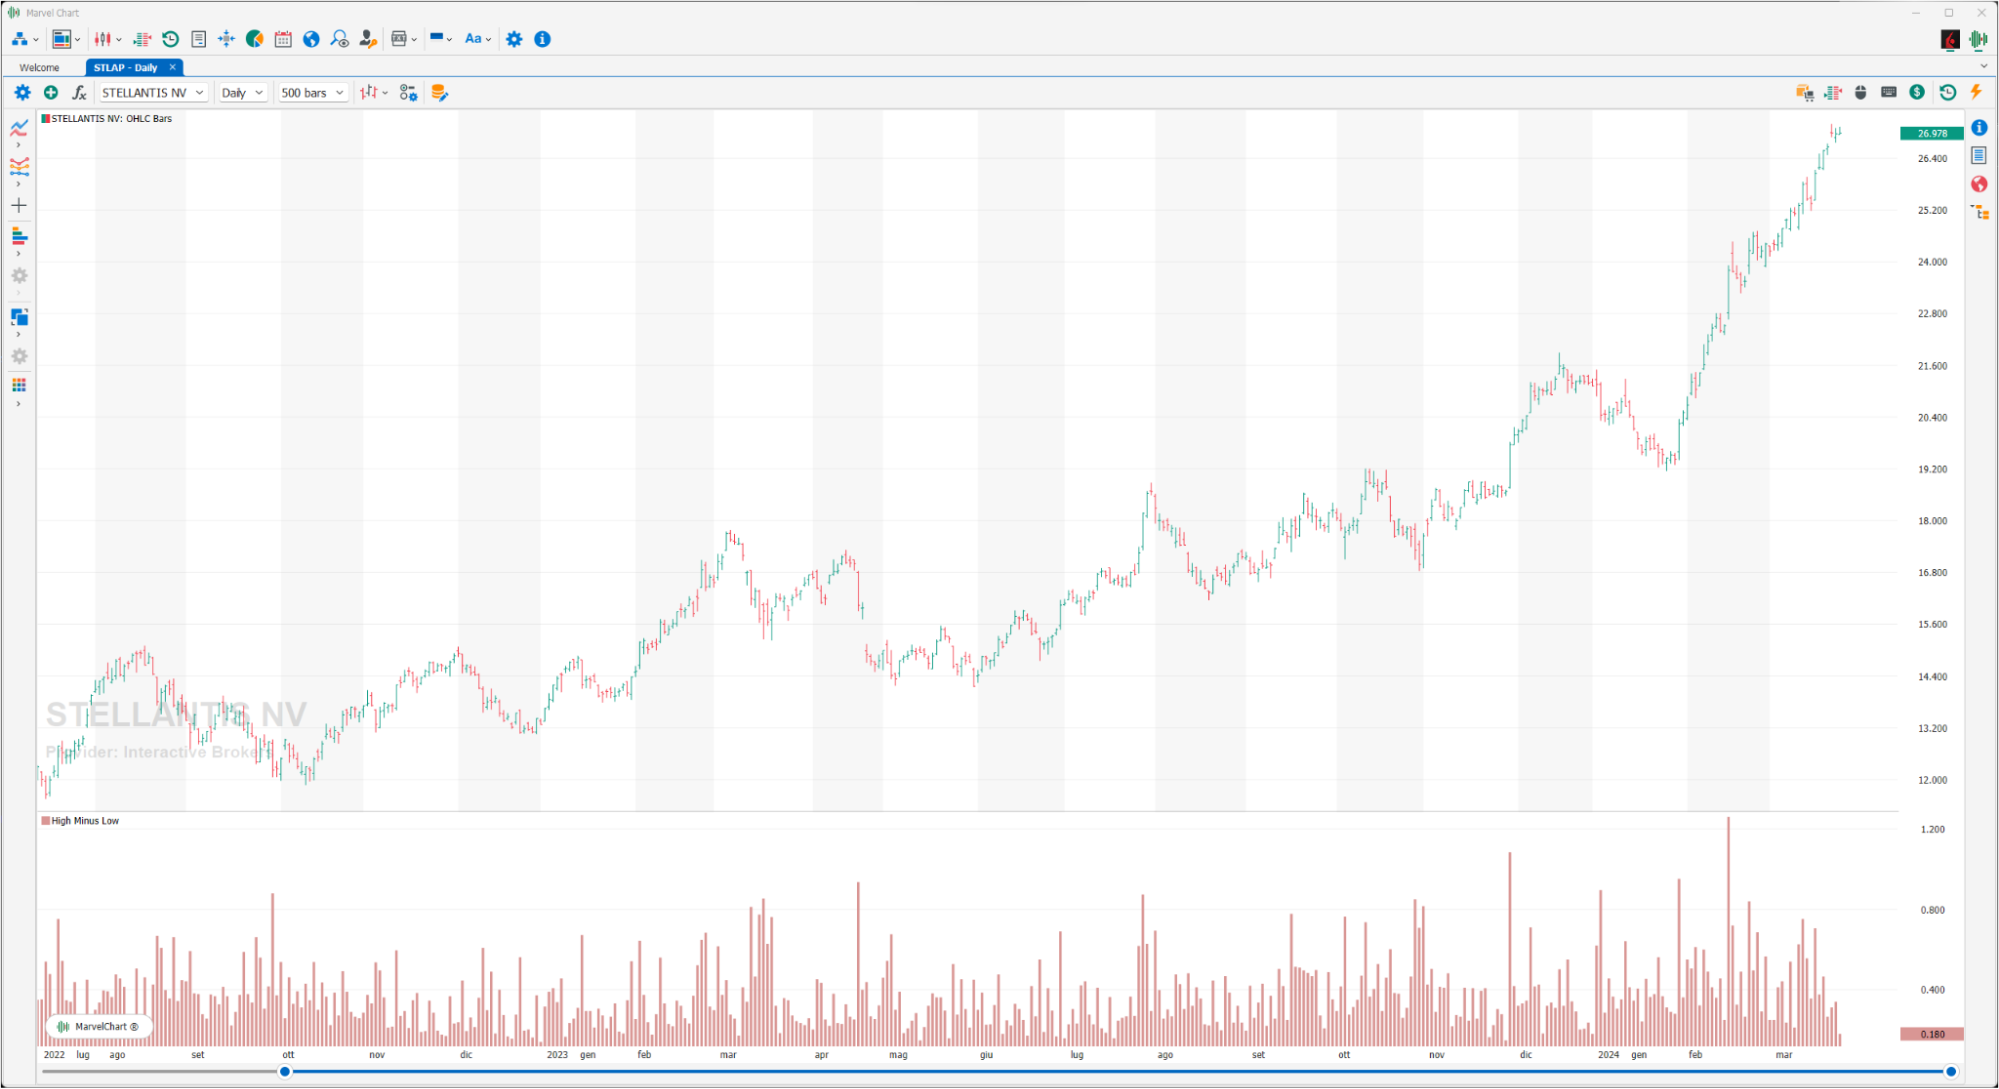
The High Minus Low indicator, as its name suggests, measures the difference between the HIGH and LOW of each bar.
Historical Volatility
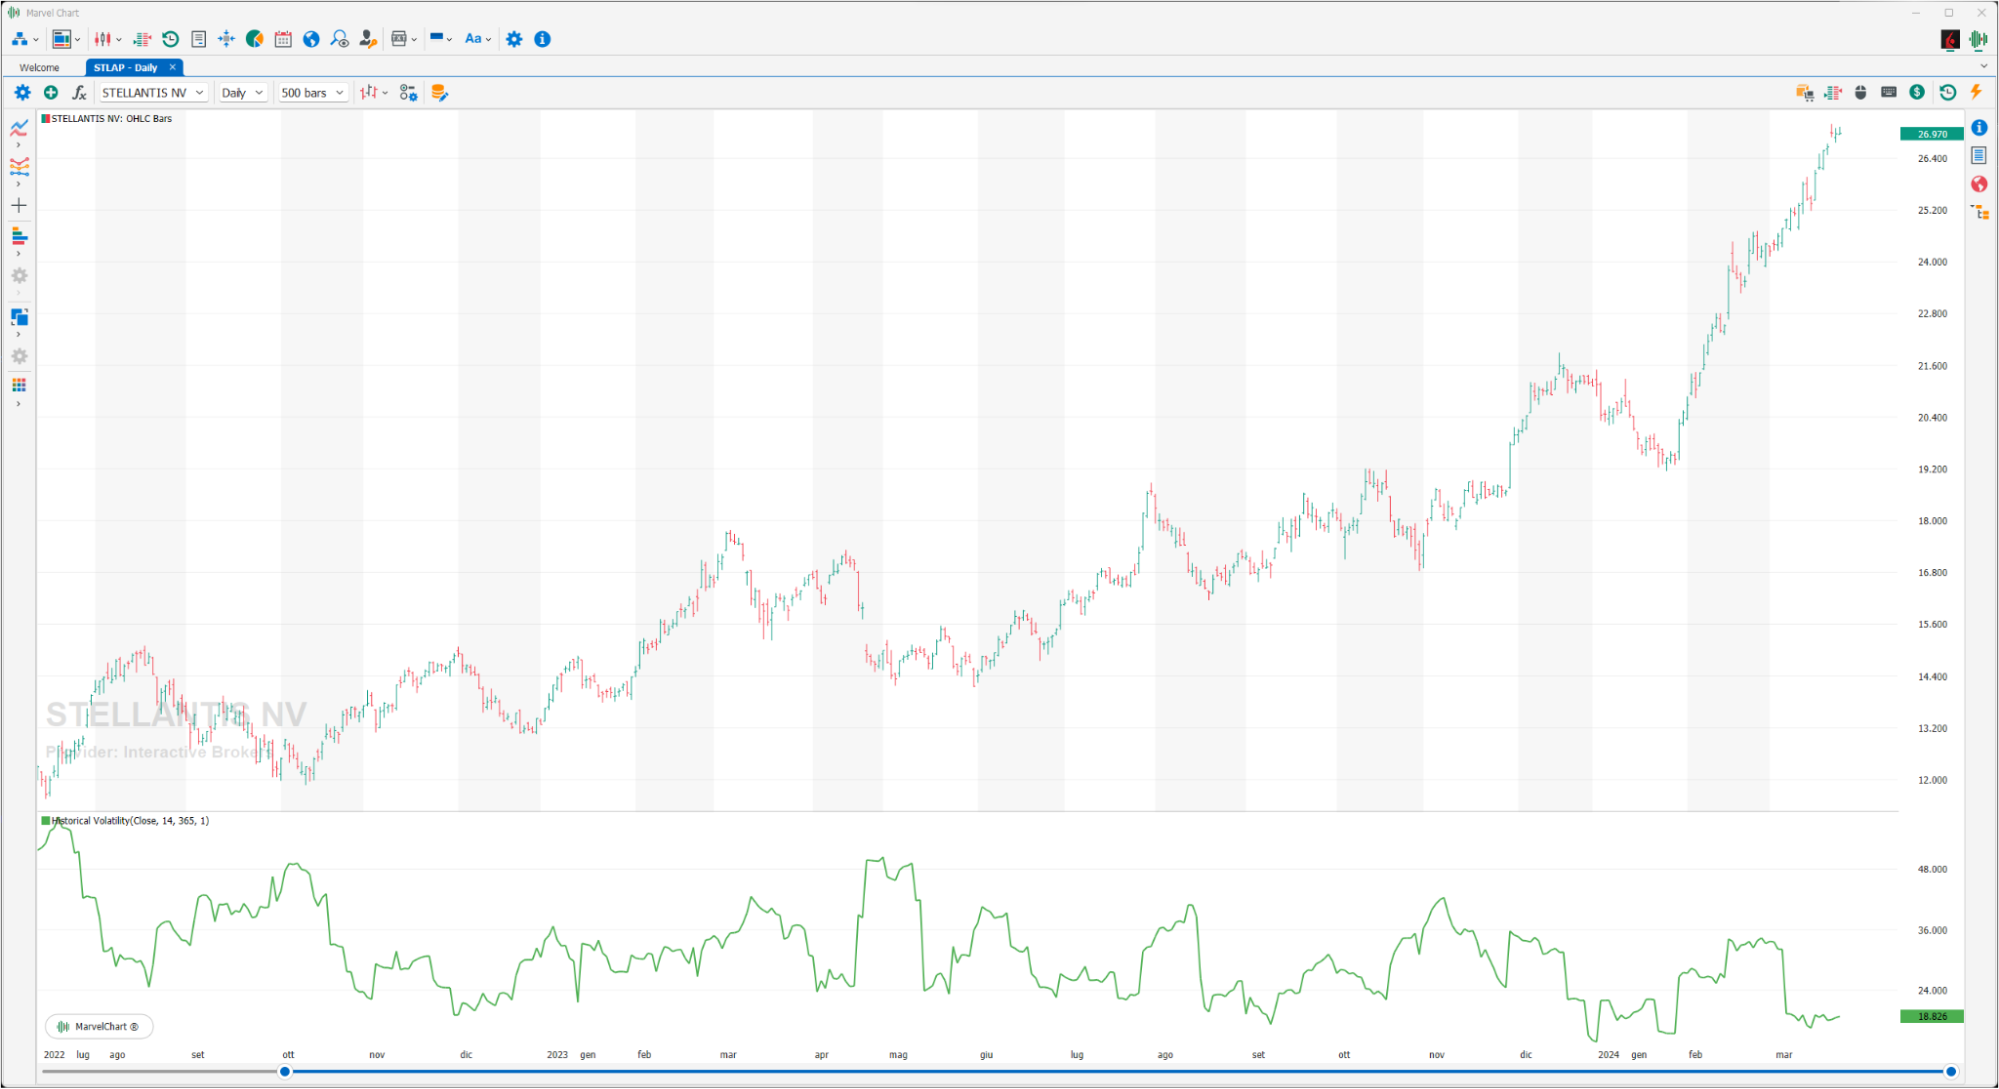
Historical Volatility is the standard deviation of a day-to-day price change expressed as an annualized percentage. In simpler terms, it is how much a market fluctuates over a given period of time.
Historical Volatility Ratio
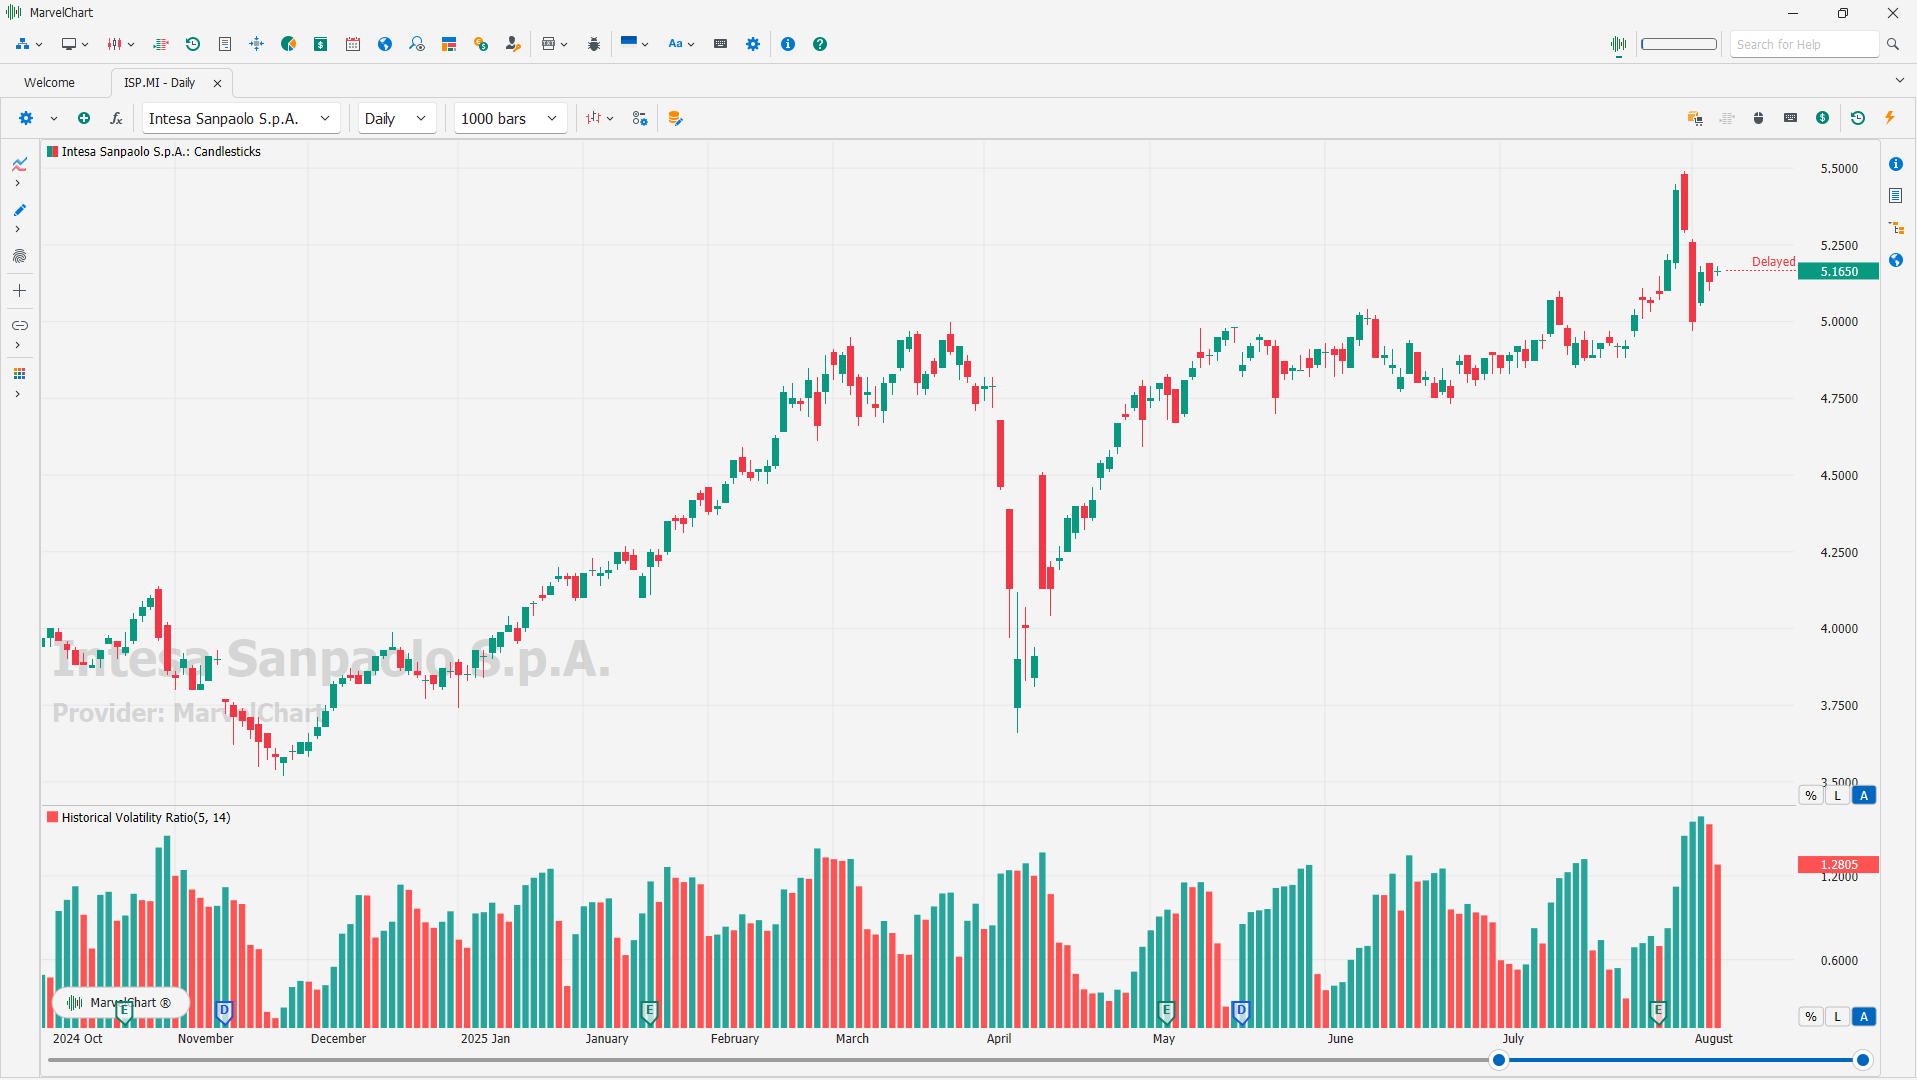
The Historical Volatility Ratio is a valuable tool that allows investors to compare the volatility of an asset over different time frames. It divides the calculation for a short period by the same calculations for a usually longer period, providing a percentage of short to long average historical volatility.
HL Volatility
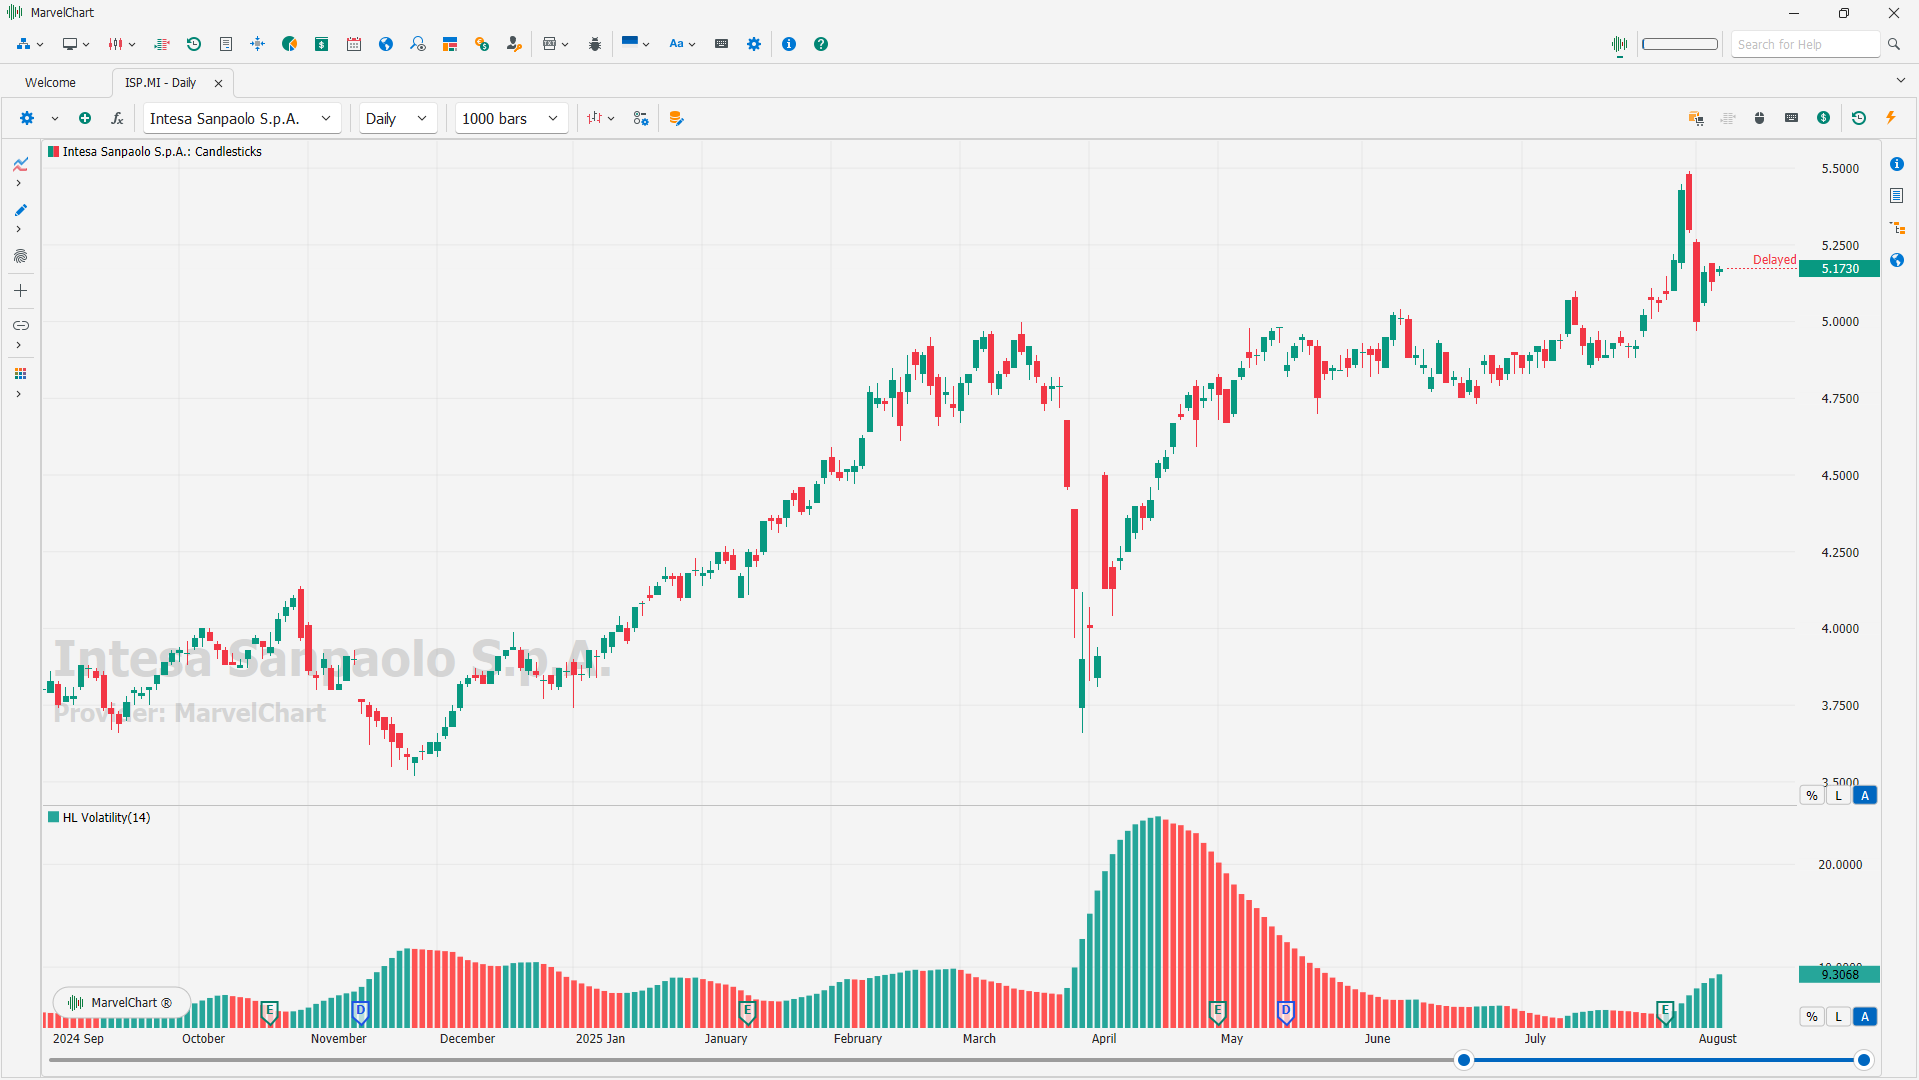
The HL Volatility study introduces a different approach to measuring volatility, the tendency of price to fluctuate. This approach takes into account minimum and maximum prices on a certain period and relates them to the current price.
The HL Volatility is calculated as a percentage ratio of two exponential moving averages:
difference between the highest high and the lowest low on the specified period;
current close.
Normalized Average True Range
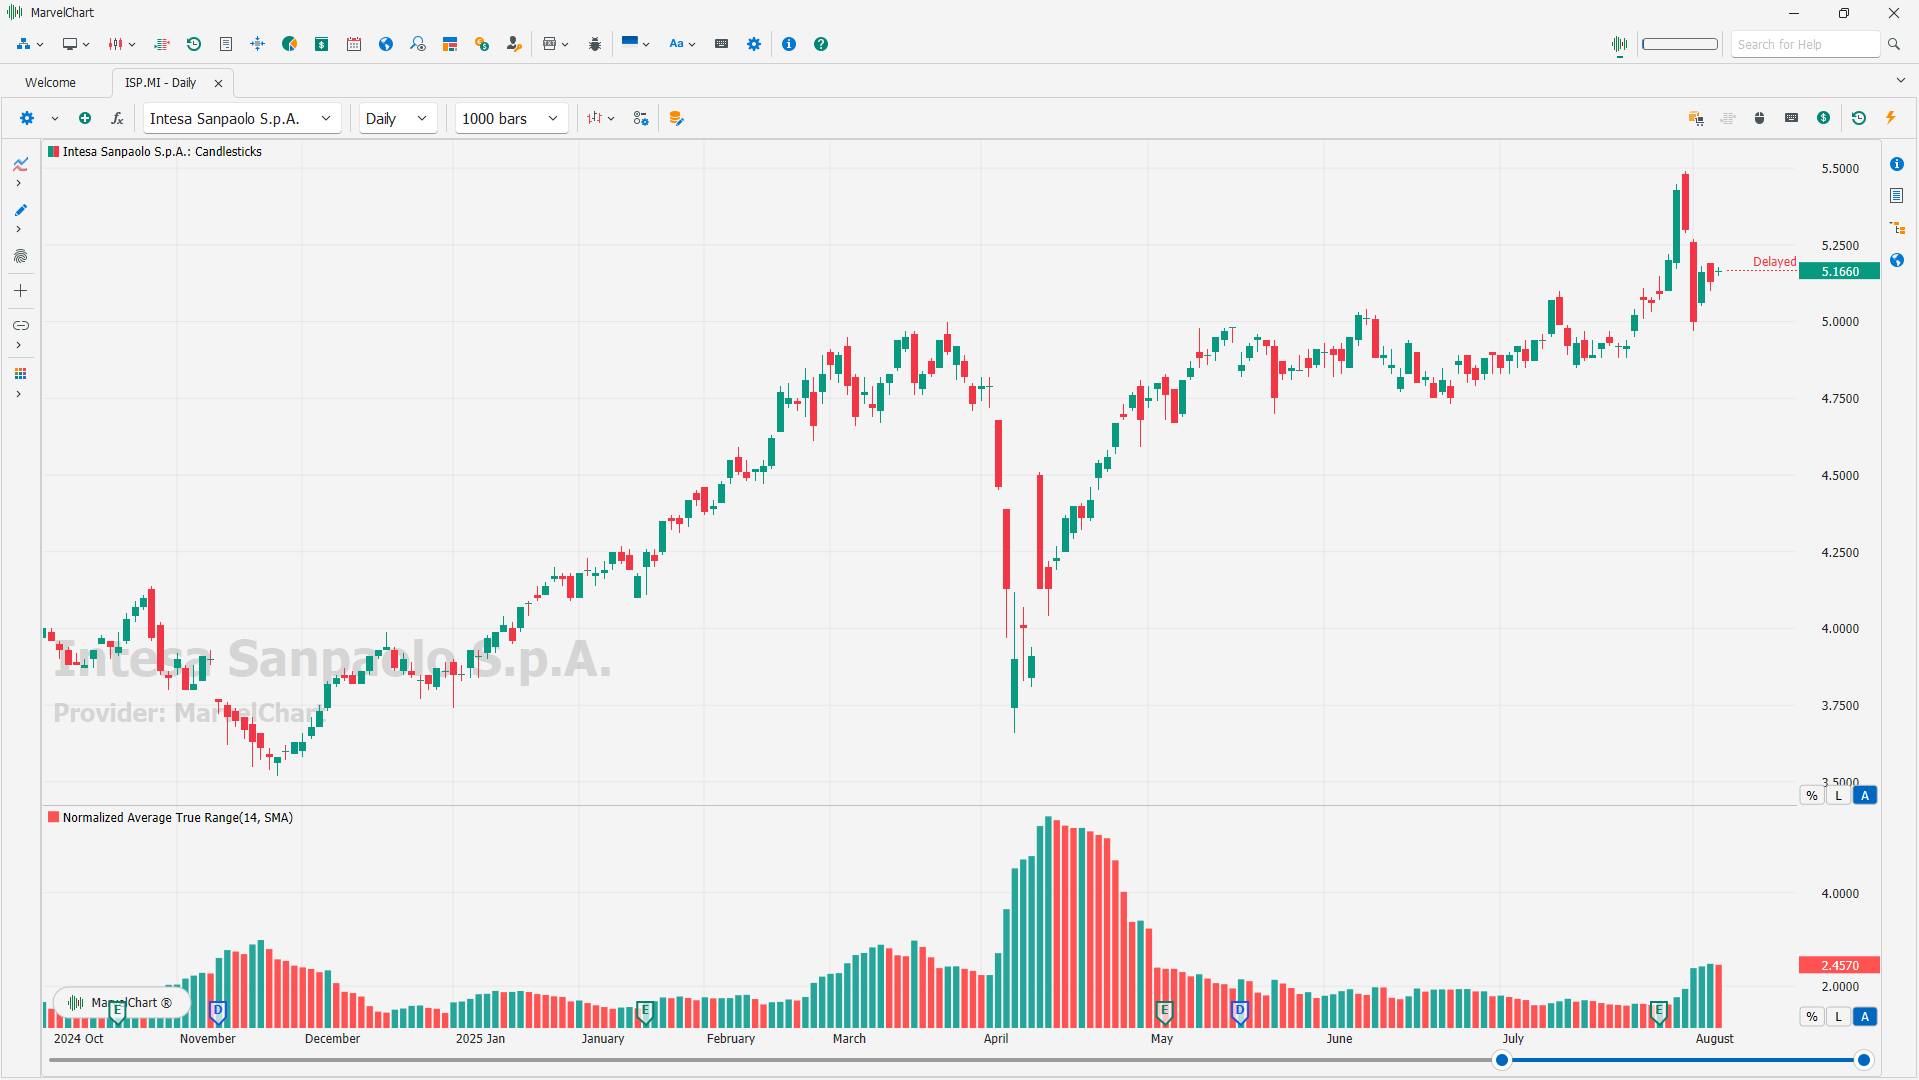
The Normalized Average True Range (NATR) indicator is a volatility indicator that expresses the Average True Range (ATR) as a percentage of the asset's price. This normalization allows for comparing volatility across different assets and time periods, regardless of their price levels. Essentially, it provides a relative measure of volatility, rather than an absolute one.
Price Rate Of Change
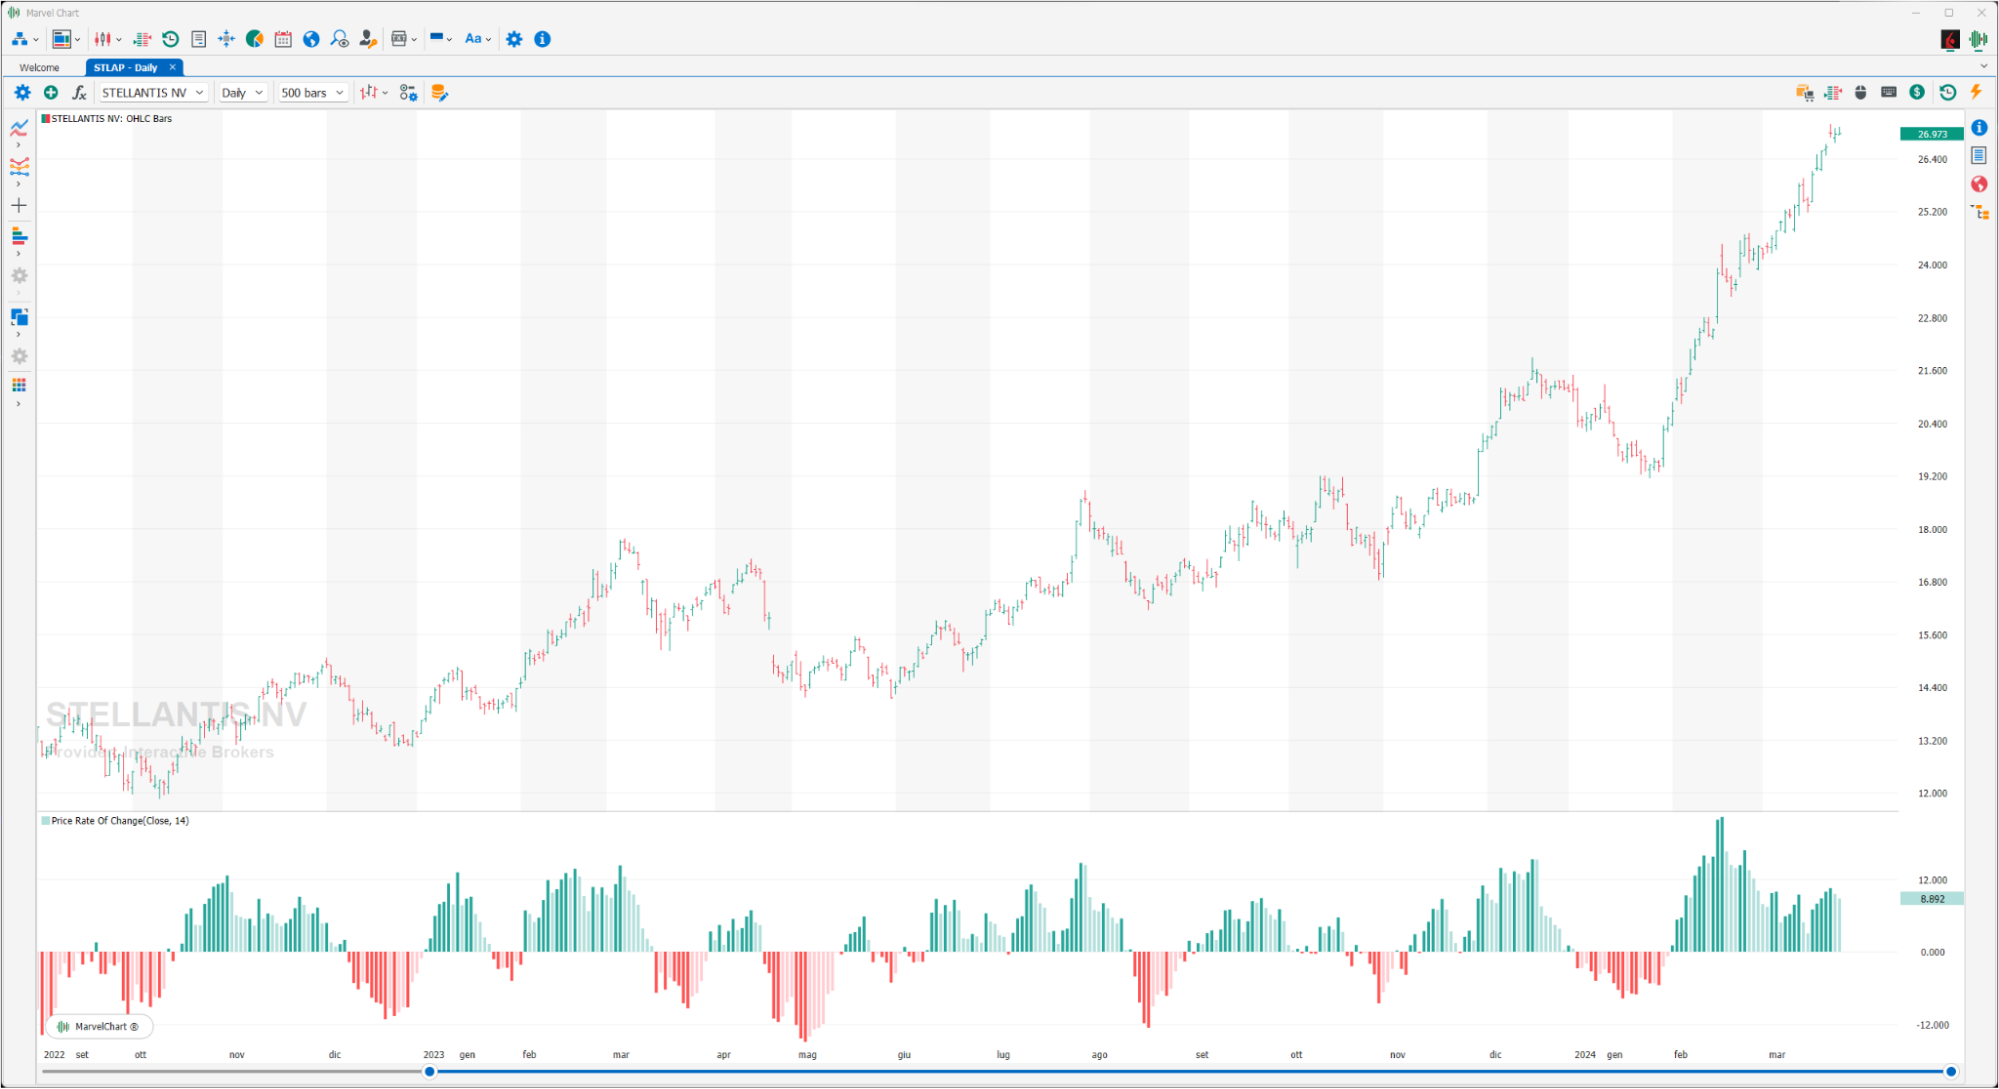
The Price ROC is an indicator calculated on the difference between the current CLOSE and the CLOSE of n previous periods. The result is the percentage of how much the CLOSE has changed in the last n periods. If the current CLOSE is higher than the CLOSE of n previous periods, the Price ROC is positive.
Pro Go
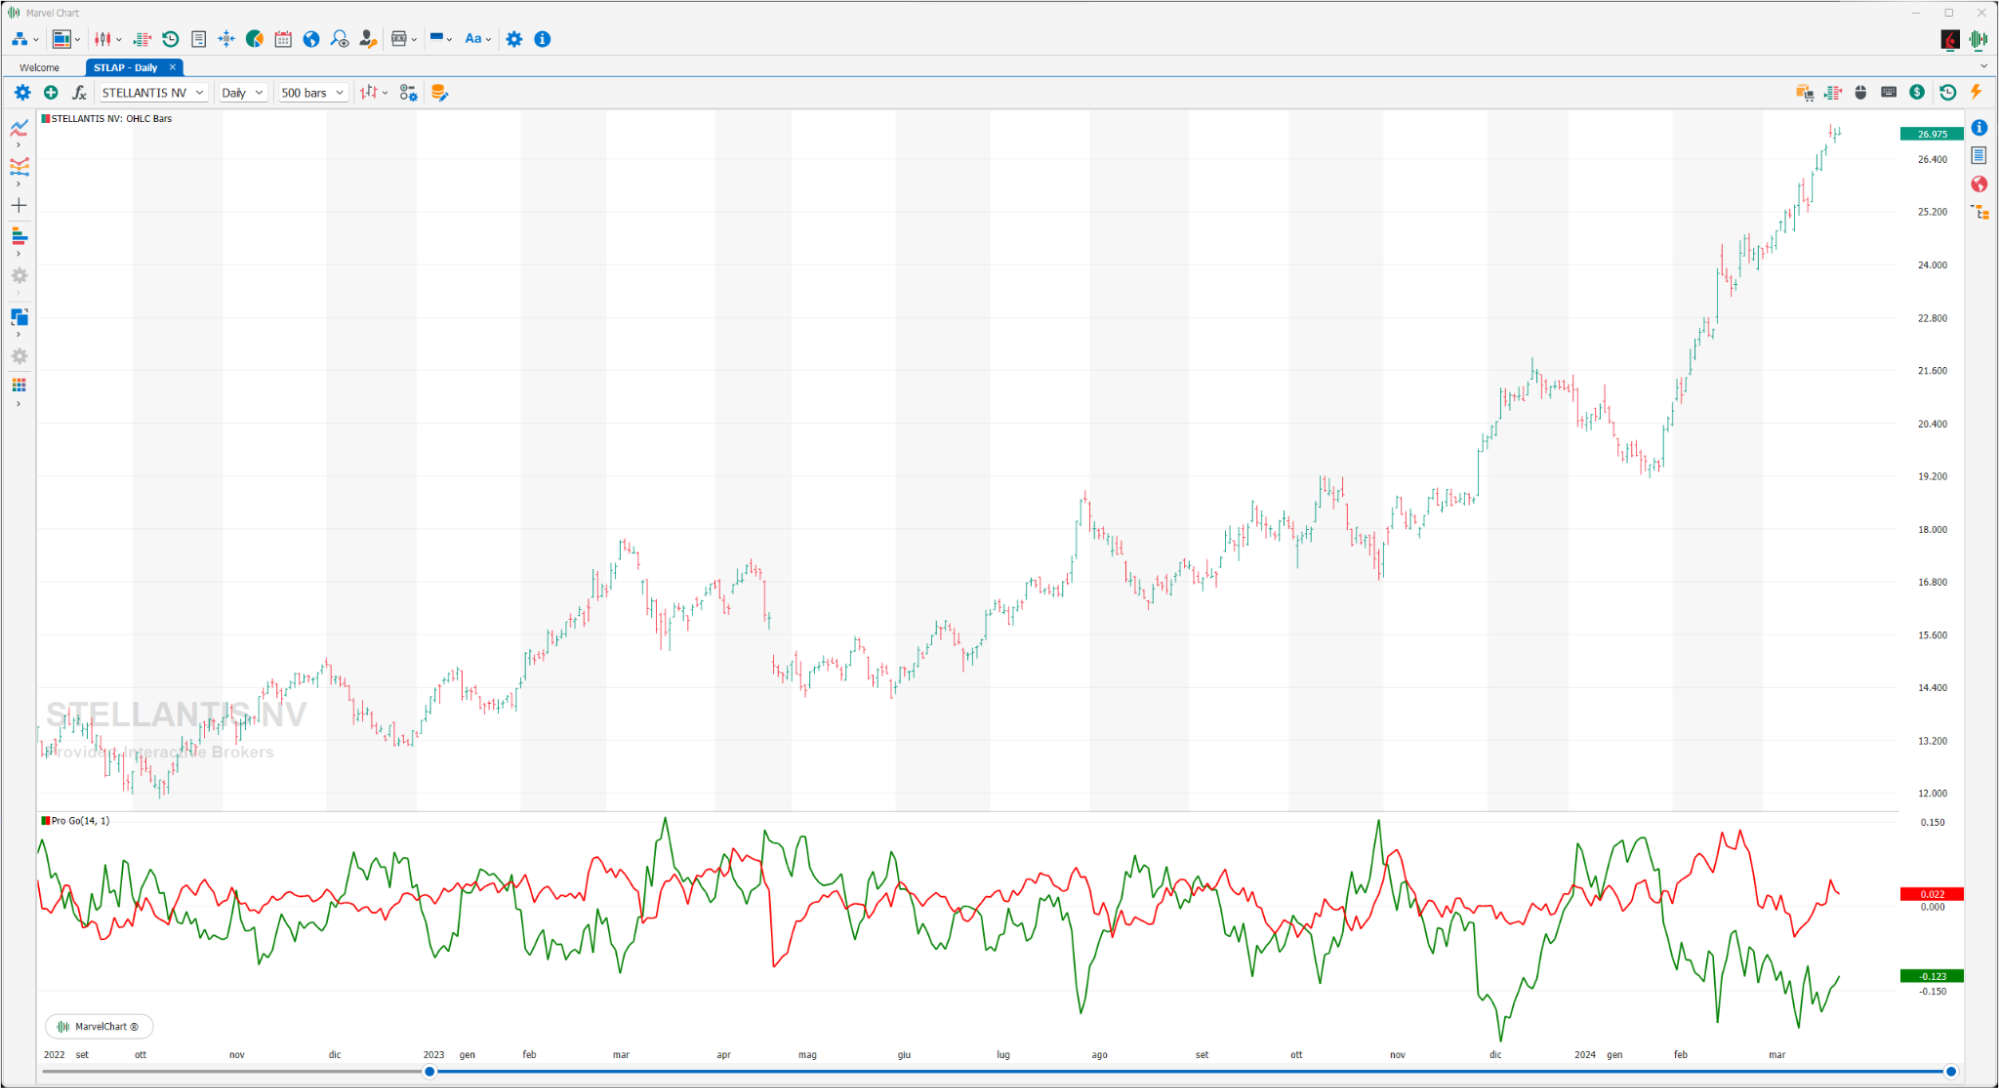
This indicator is composed of two lines, a green one called “Public Buy” and a red one called “Professional Buy”. The creator, Larry Williams, starts from the assumption that there is a substantial difference between the purchases of small investors (Public Buy) and of strong hands (Professional Buy). The interpretation is very simple, the line that crosses the other one provides the signal. So when the red line crosses the green one upwards it is a bearish signal, on the contrary when the green line crosses the red line upwards the signal is bullish.
Relative Volatility Index
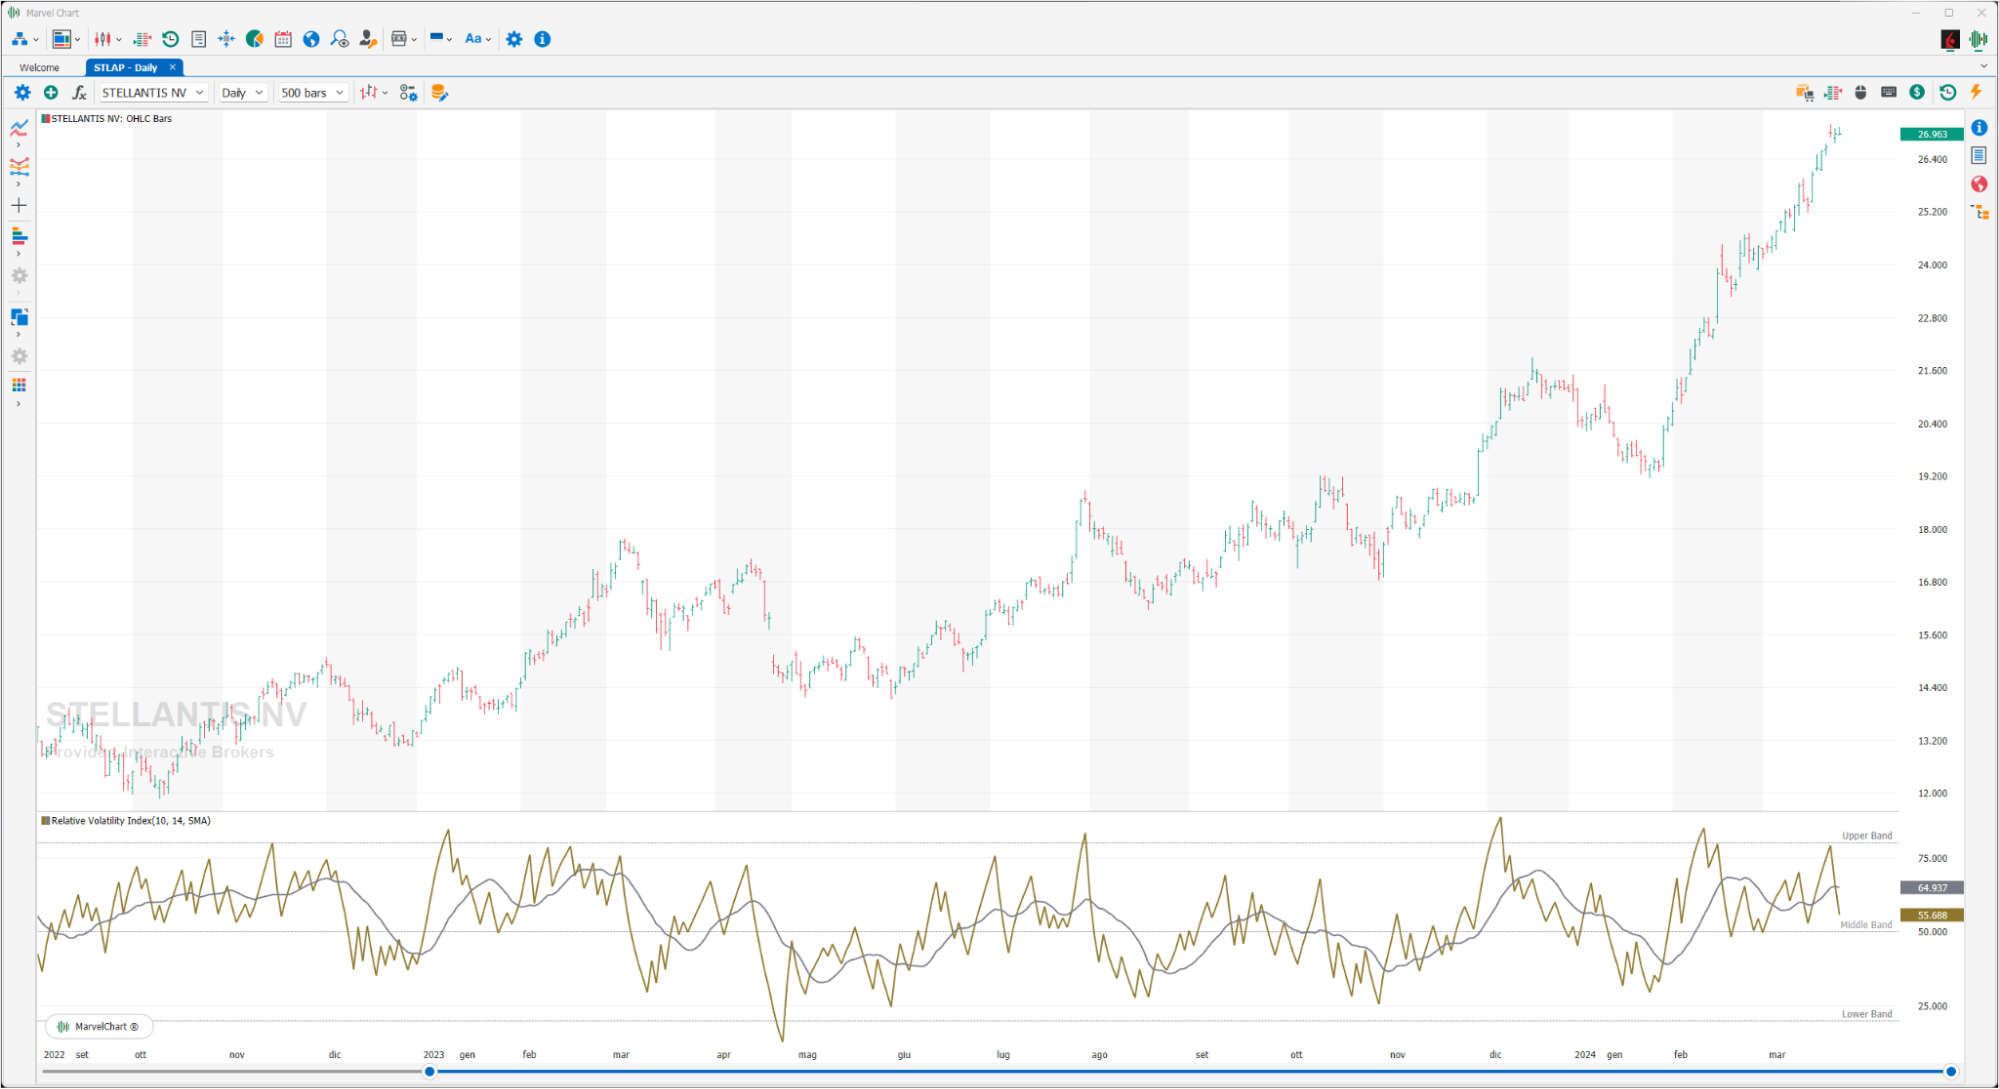
The Relative Volatility Index (RVI) is a volatility indicator, very similar to the Relative Strength Index (RSI), but with some key differences. The RVI measures the standard deviation of prices as they change over time, while the RSI measures absolute price changes. The Relative Volatility Index is plotted on the chart and ranges from 0 to 100.
True Range
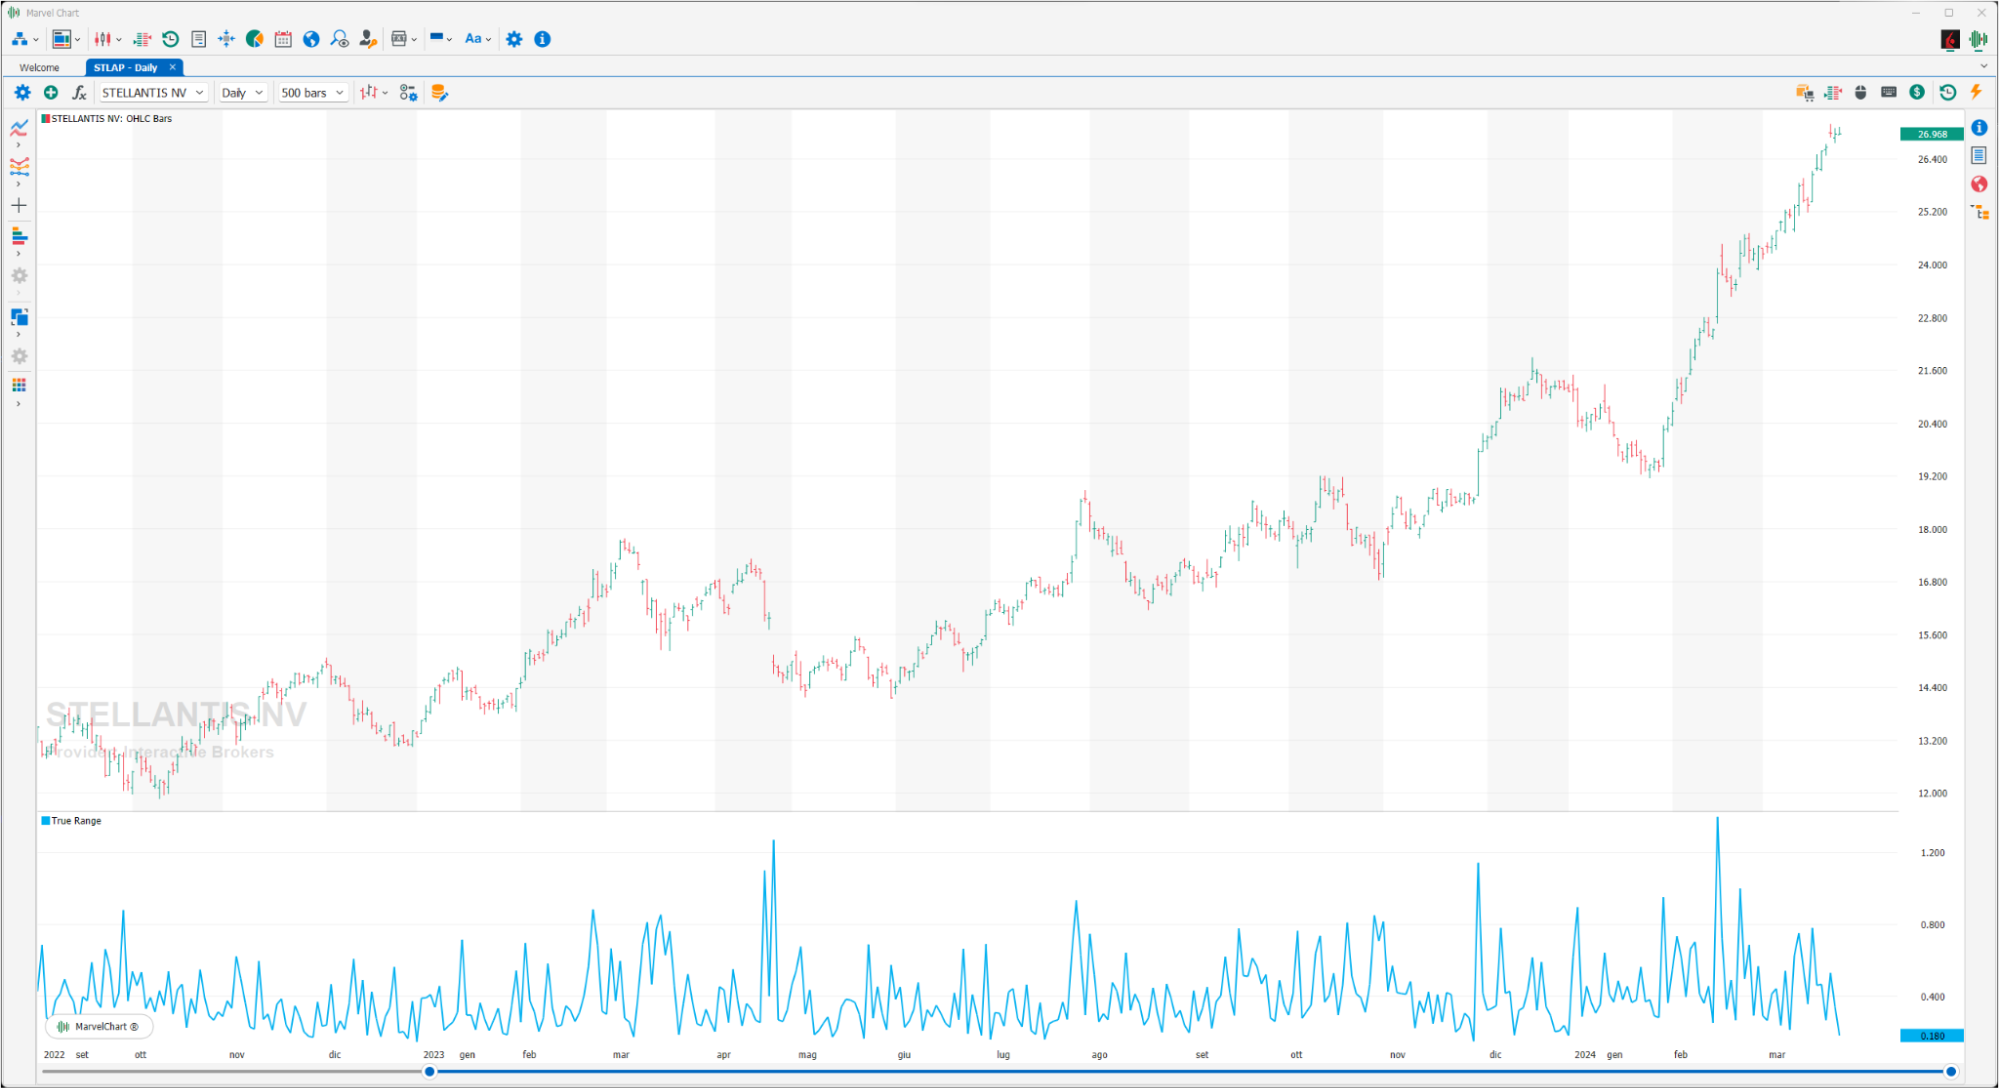
The True Range measures the range of price movement that occurred in the bar (based on the time frame) of trading as the difference between the HIGH price and the LOW price, or (H-L). It is therefore a very immediate volatility indicator that, to compensate for the measurements of the days in which large excursions in one direction occur (days inside), considers ONLY the largest data among the following 3 measurements:
difference between the HIGH and the CLOSE of the bar;
difference between the CLOSE of the previous bar and the LOW of the current bar;
difference between the CLOSE of the previous bar and the HIGH of the current bar.
Wilder Volatility
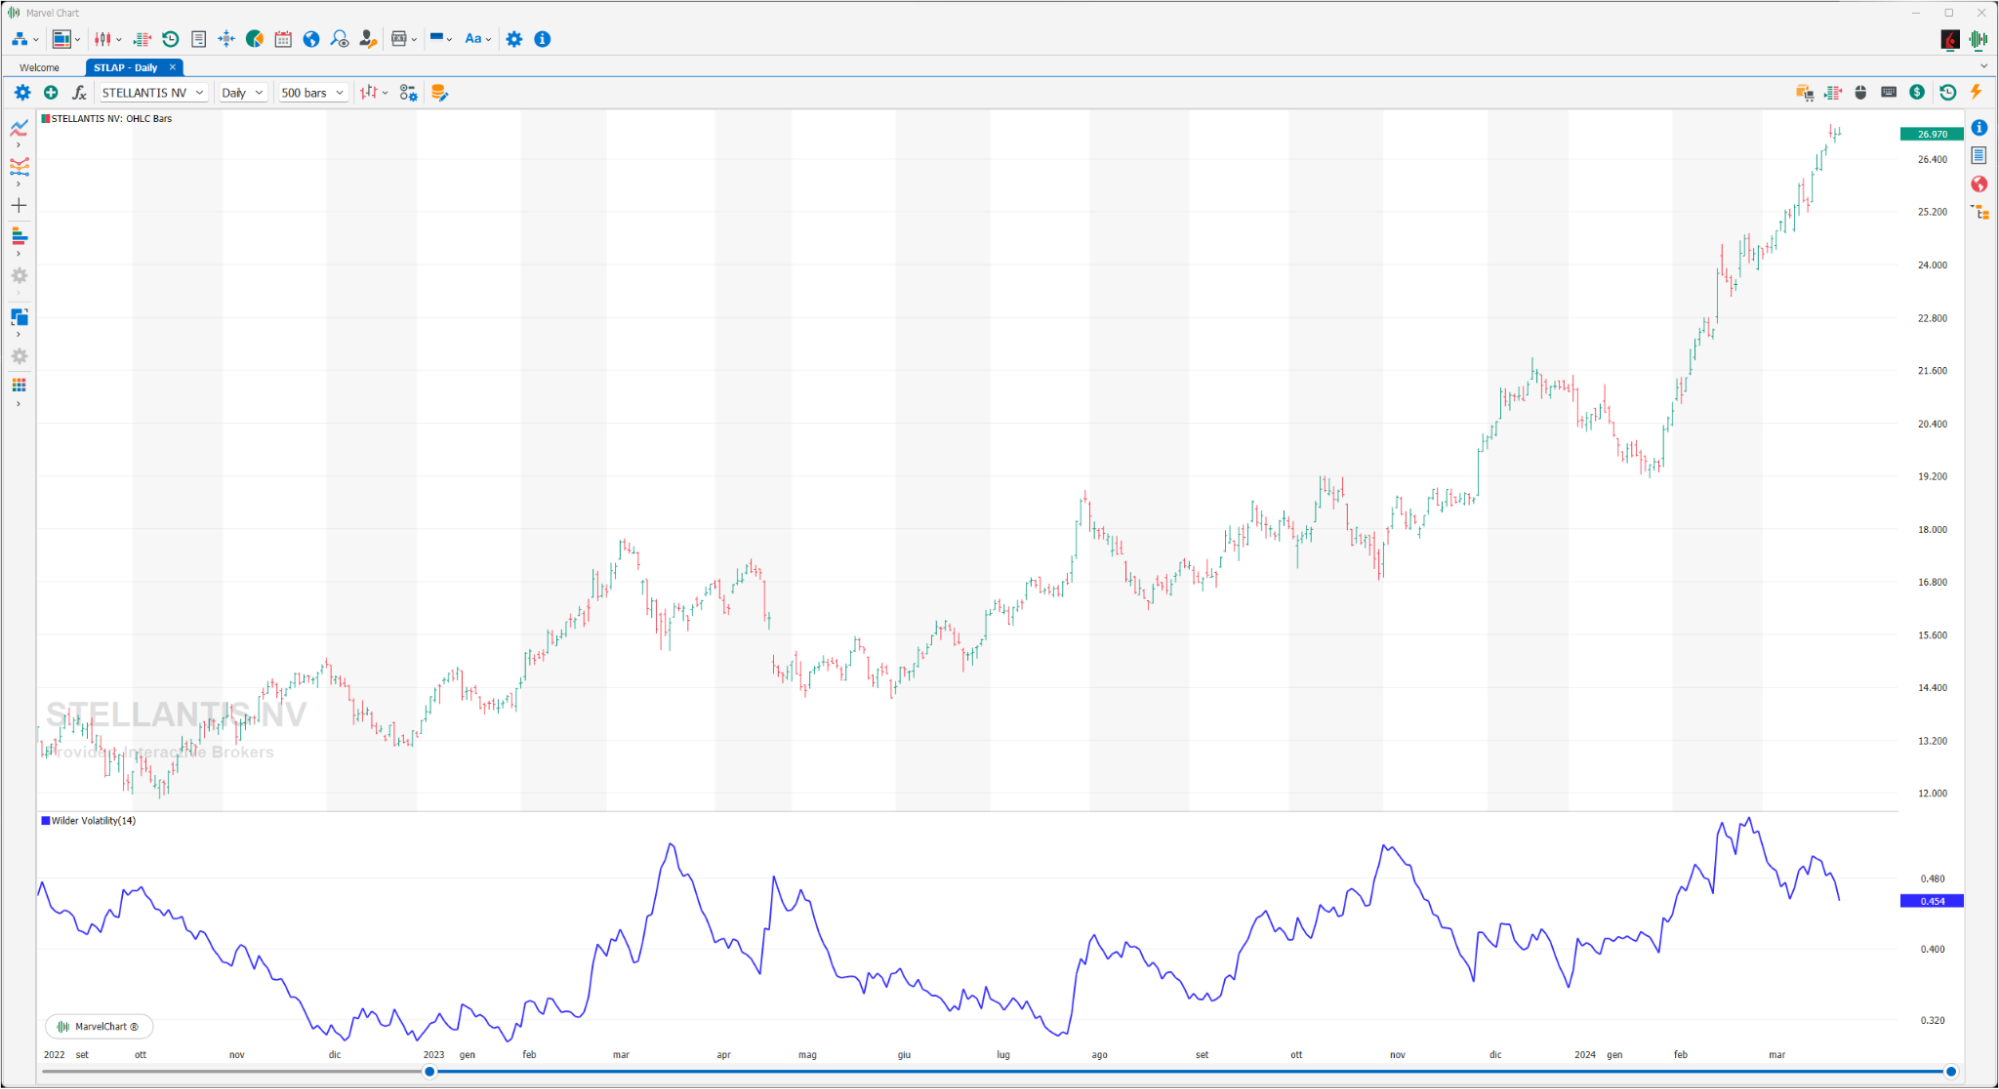
The Wilder Volatility Index, developed by Welles Wilder, is an arithmetic volatility indicator based on the True Range, not on statistics (Historical Volatility). The Wilder Volatility Index is always positive and is calculated on the HIGH - LOW difference of each bar. It can be used as research or evaluation of more or less volatile financial instruments.
Williams VIX Fix
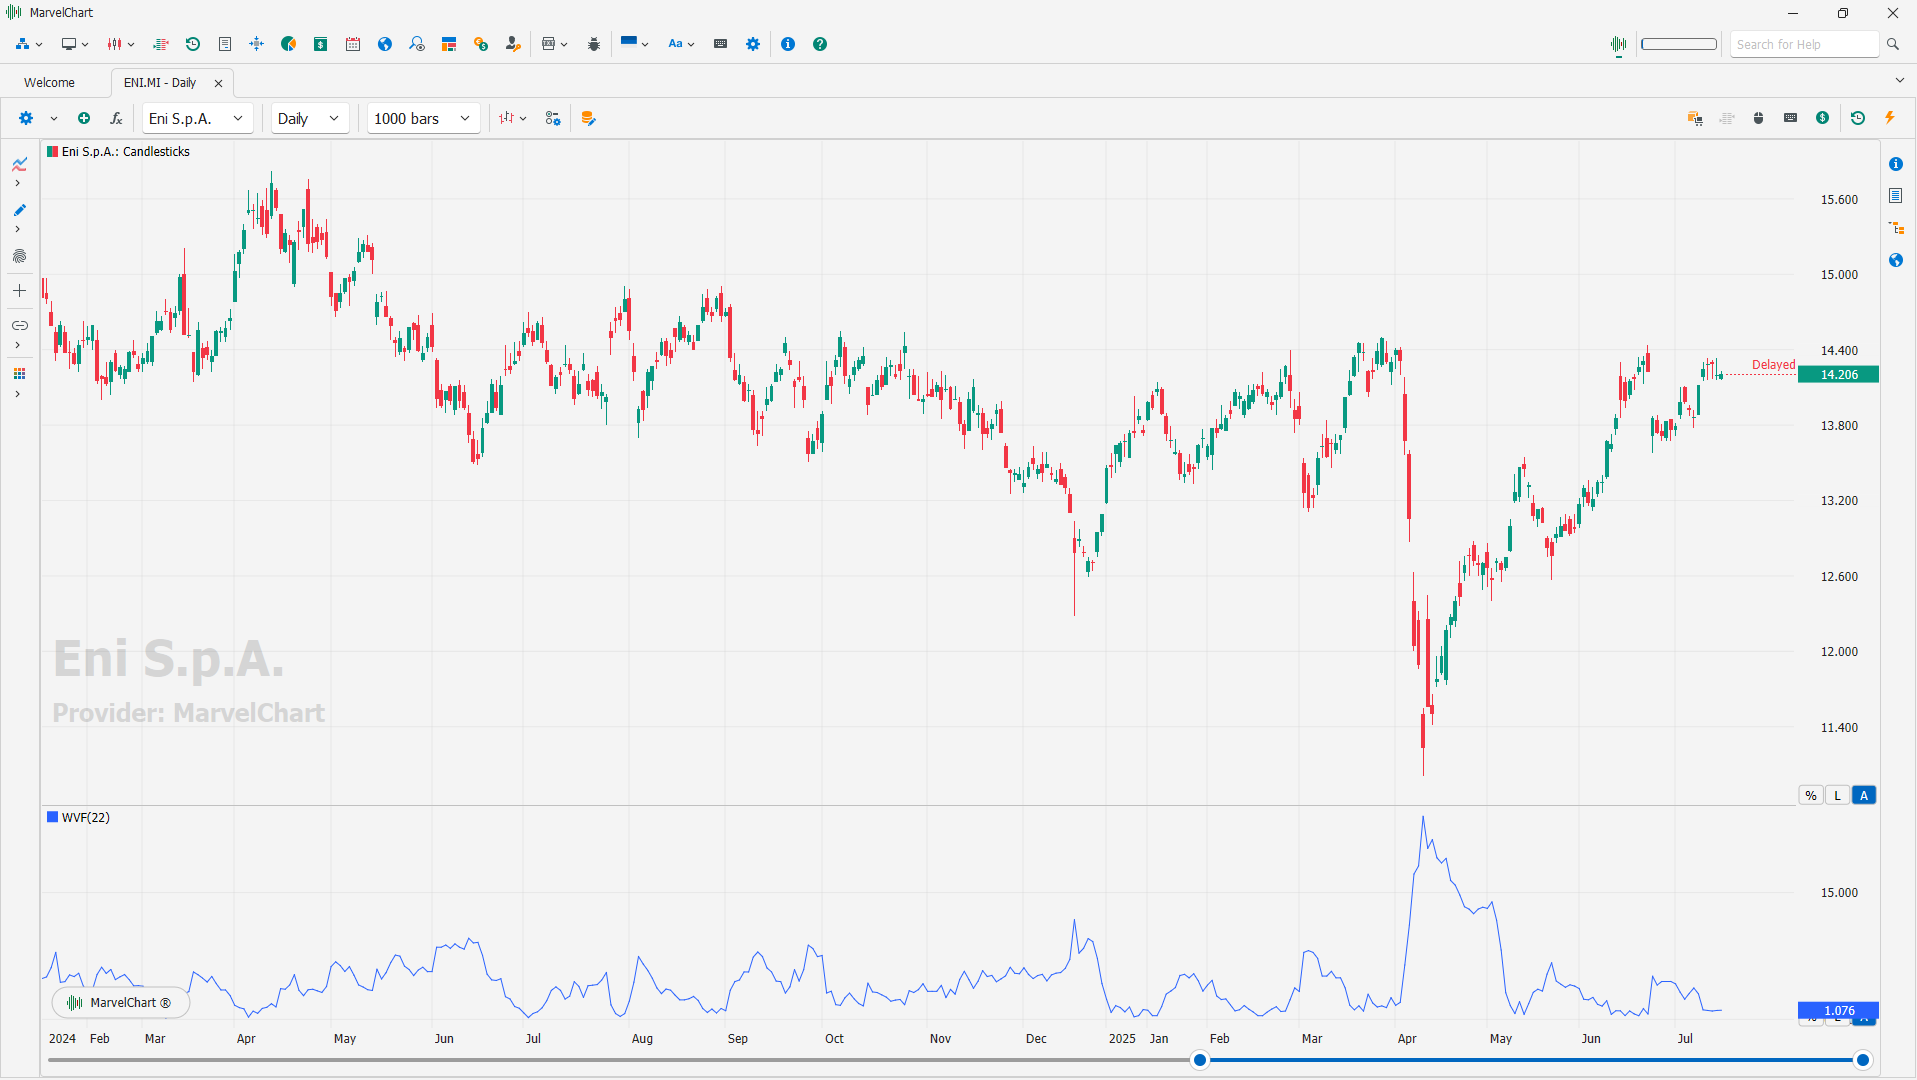
The Williams VIX Fix indicator is a “synthetic” interpretation of the actual VIX. Numerically, it calculates the difference between low price deviation from highs within a specified period.