Colored Areas
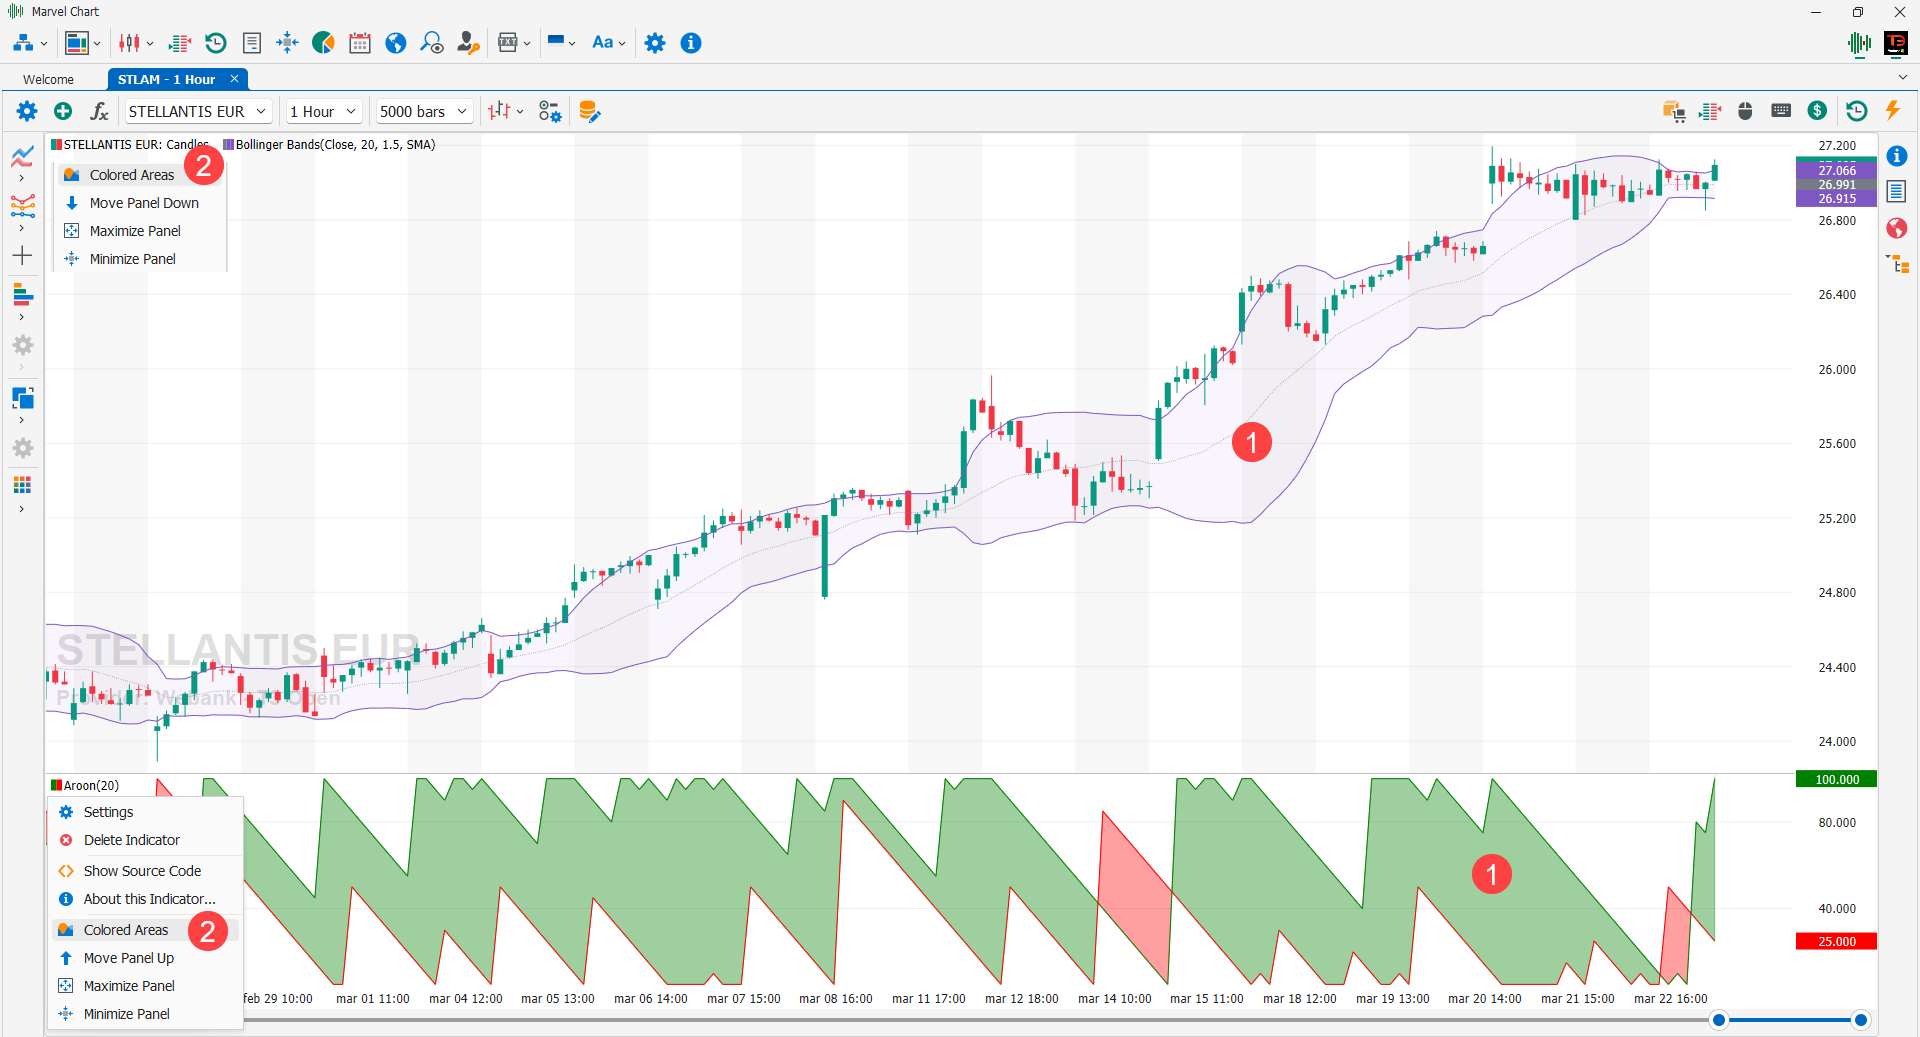
For each panel of the chart, it is possible to define colored areas 1 that are enclosed between two values chosen from all those available in the panel. Colored Areas make the interpretation of indicators more immediate, allowing for easier reading of the market situation. A Colored Area represents the space between two series of values, for example between the Close price and the price of its moving average, or between the upper and lower bands of an indicator. You can access the Colored Areas settings window 1 by clicking on the header of a historical series or an indicator, and then from the drop-down menu choosing the Colored Areas item.
Settings
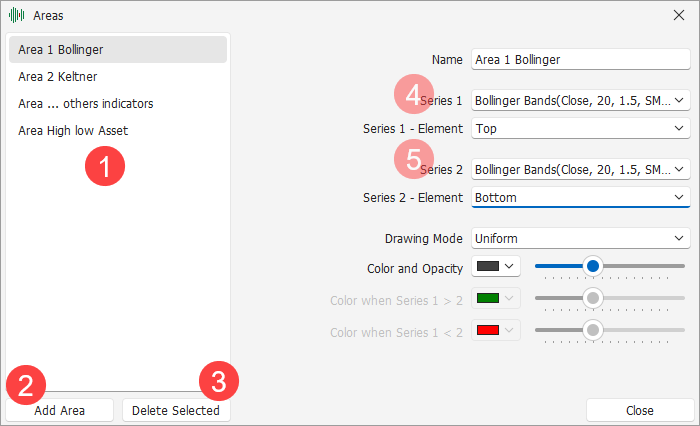
The Colored Areas settings window is divided into two sections, on the left the list of color areas 1 present in the chart panel, while on the right the settings related to the area selected in the list on the left are displayed. To add new Colored Areas you can use the Add Area 2 button, while with the Delete Selected 3 button you can delete the areas selected in the 1 list. Since a Colored Area represents the space between two series of values, the settings related to the series of data that will represent the lower and upper borders of the Colored Area are particularly important. In the selection boxes 4 and 5, “Series 1” and “Series 2” you can choose which historical series or indicators to use, and in the boxes “Series 1 – Element” and “Series 2 – Element” which elements of the historical series or indicator to use. For historical series the available elements are Open, High, Low and Close. For indicators the list of elements depends on which and how many lines compose it. For example, Bollinger Bands have Top, Median and Bottom elements to indicate respectively the upper band, the median line and the lower band. Other indicators will have a different list of available elements, and some indicators will have a list composed of only one element.
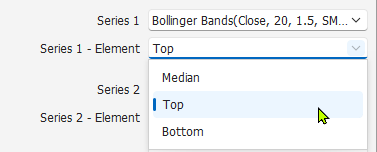
The pair “Series 1” and “Series 1 – Element” represents the choice of the first series of data to use to draw the Colored Area, which for simplicity in the following explanation we will call “element 1”. The pair “Series 2” and “Series 2 – Element” represents the choice of the second series of data to use to draw the Colored Area, which for simplicity in the following explanation we will call “element 2”.
Configure a Colored Area
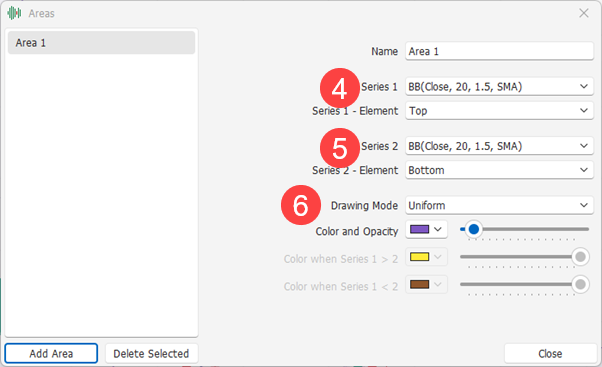
Once you select a Colored Area from the list on the left side of the window, its settings will be displayed on the right side. They include:
Name - Name of the Colored Area;
Series 1 - Time series or indicator for selecting element 1;
Series 1 - Element - Time series element or indicator for selecting element 1;
Series 2 - Time series or indicator for selecting element 2;
Series 2 - Element - Time series element or indicator for selecting element 2;
Drawing Mode - Drawing mode of the Colored Area. The available options are:
Uniform - The Colored Area will be drawn with a single color;
Multiple Colors - The Colored Area will use two different colors, depending on the relationship between the values of element 1 and element 2;
Color and Opacity - Active only if the mode selected in the 6 Drawing Mode drop-down box is Uniform. Indicates the color with which to draw the Colored Area and its opacity. For the opacity setting, the more the bar pointer is moved to the left, the more transparent the area will be, the more the bar pointer is moved to the right, the more opaque the area will be;
Color when Series 1 > 2 - Active only if the mode selected in the 6 Drawing Mode drop-down box is Multiple Colors. Indicates the color with which to draw the Colored Area and its opacity when the values of element 1 are greater than those of element 2. For the opacity setting, the more the bar pointer is moved to the left, the more transparent the area will be, the more the bar pointer is moved to the right, the more opaque the area will be;
Color when Series 1 < 2 - Active only if the mode selected in the 6 Drawing Mode drop-down box is Multiple Colors. Indicates the color with which to draw the Colored Area and its opacity when the values of element 1 are less than those of element 2. For the opacity setting, the more the bar pointer is moved to the left, the more transparent the area will be, the more the bar pointer is moved to the right, the more opaque the area will be;
The settings made in this window are applied immediately to the chart, so as to have an immediate preview to make it easier to choose the parameters of each area. If a Colored Area uses a marker as the data series for element 1 or element 2, when the marker is removed from the Chart the Colored Area is also removed.
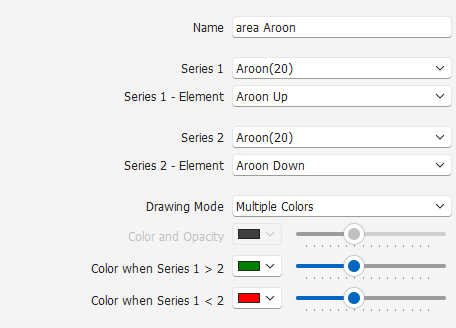
In this image you can see the Aroon marker setting in the Chart window. Note the Drawing Mode selection which is Multiple Colors, using 2 distinct colors.
It is possible to add one or more Colored Areas to a Chart using markers. See the chapter Extending MarvelChart for more information.