Trend
Accumulative Swing Index
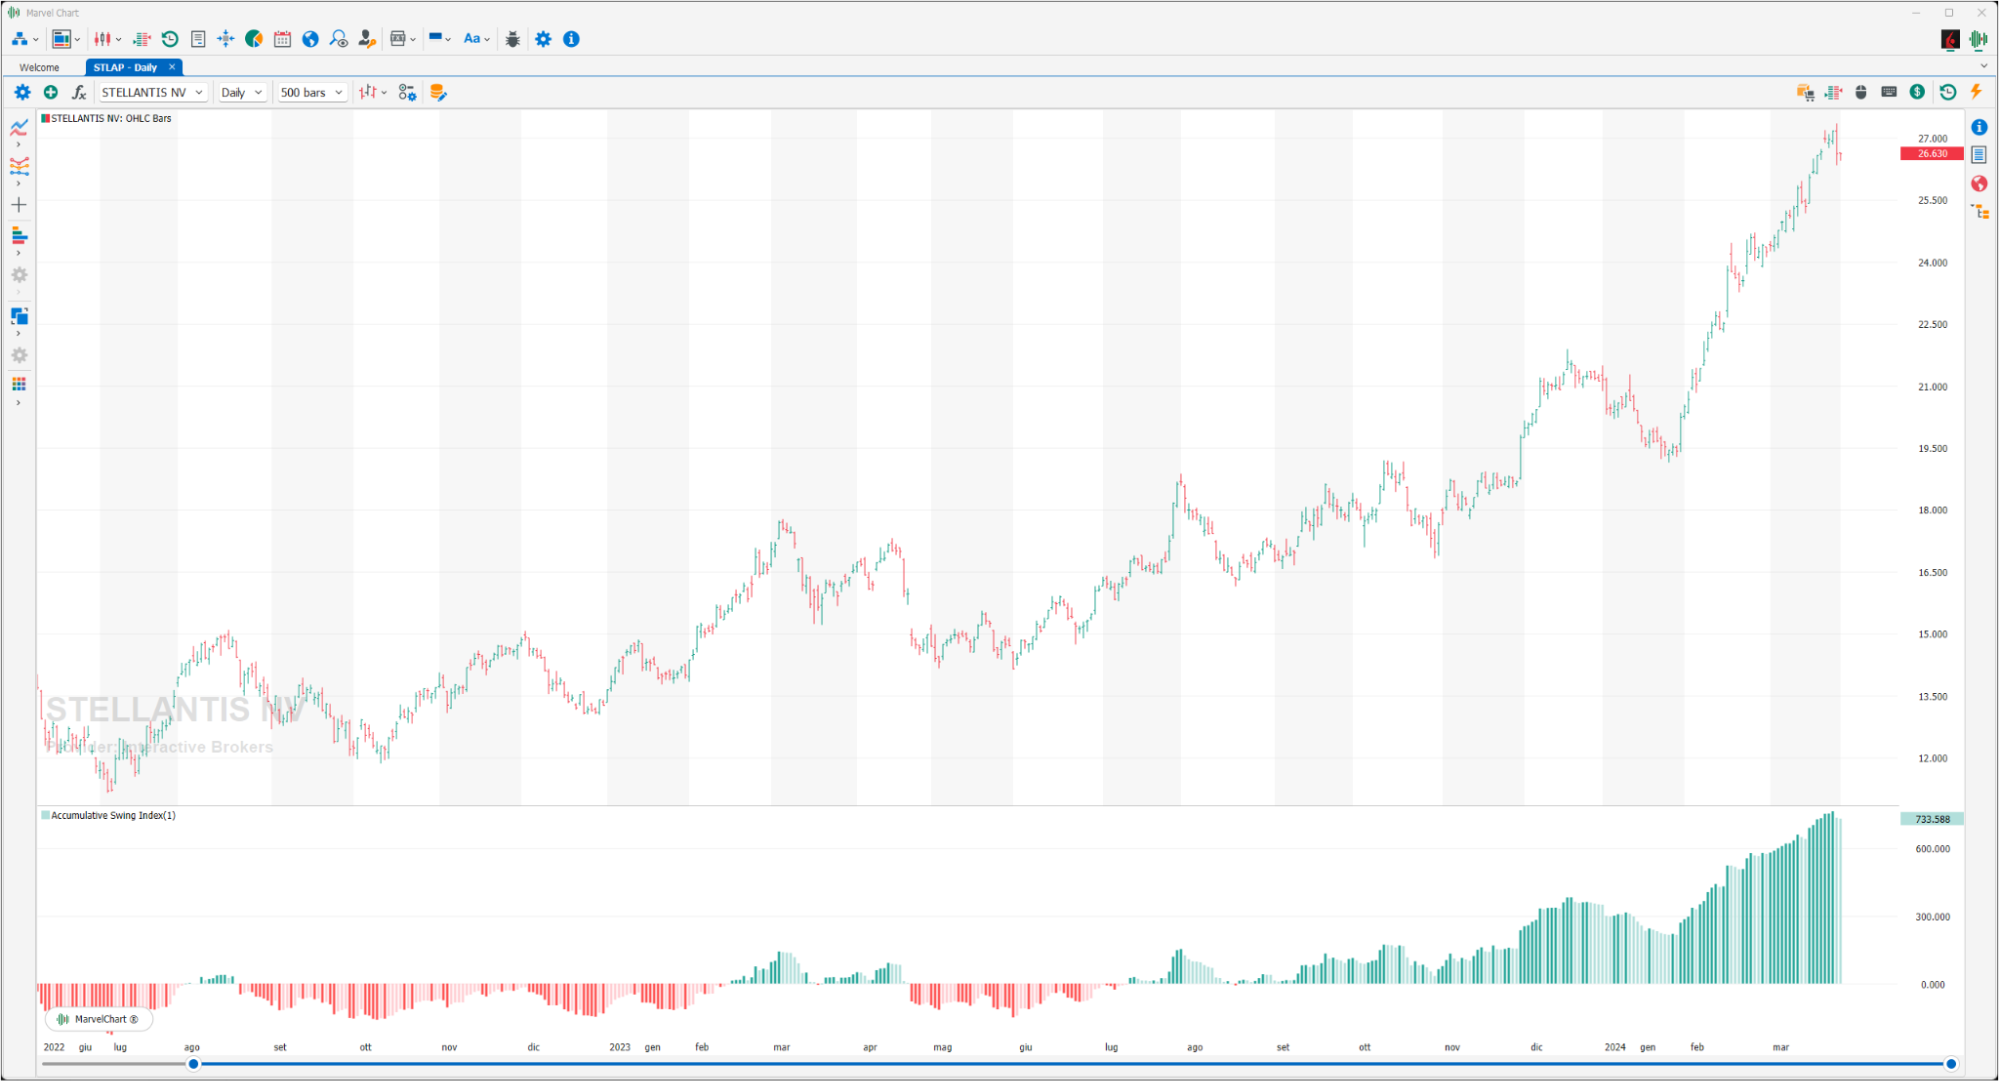
The Accumulative Swing Index is an indicator used to inspect the long-term trend by comparing the bar chart. In particular, it uses the OPEN, CLOSE, HIGH and LOW data of a particular period of time. This index is a variation of the Welles Wilder Swing Index, which adds the individual values resulting from the Swing Index. The swing index gives a value from 0 to 100 if the bar is positive, a value from 0 to -100 if negative, the Accumulative Swing Index is a variant that is used to have greater precision in the long term compared to the normal Swing Index that uses only two bars. Basically, when the Accumulative Swing Index is positive, it means that the long-term trend is positive, while when the Accumulative Swing Index is negative, the long-term trend is negative. If there is no long-term trend, the ASI will oscillate between positive and negative values. It is very useful because it gives a value to the swings and therefore a quantitative indication of the reversals that occur even in the short term. When the Accumulative Swing Index is plotted on the same chart as the daily chart, the trend lines drawn on the Accumulative Swing Index can be compared with the trend lines drawn on the bar chart. For those who know how to draw trend lines, the Accumulative Swing Index can be an excellent tool to confirm their ideas. Often, false trend signals identified on bar charts will not be confirmed by the Accumulative Swing Index. Since the Accumulative Swing Index is a weighted average that gives more importance to the CLOSE price, a rapid daily deviation of the price will not be reflected in the indicator.
Aroon
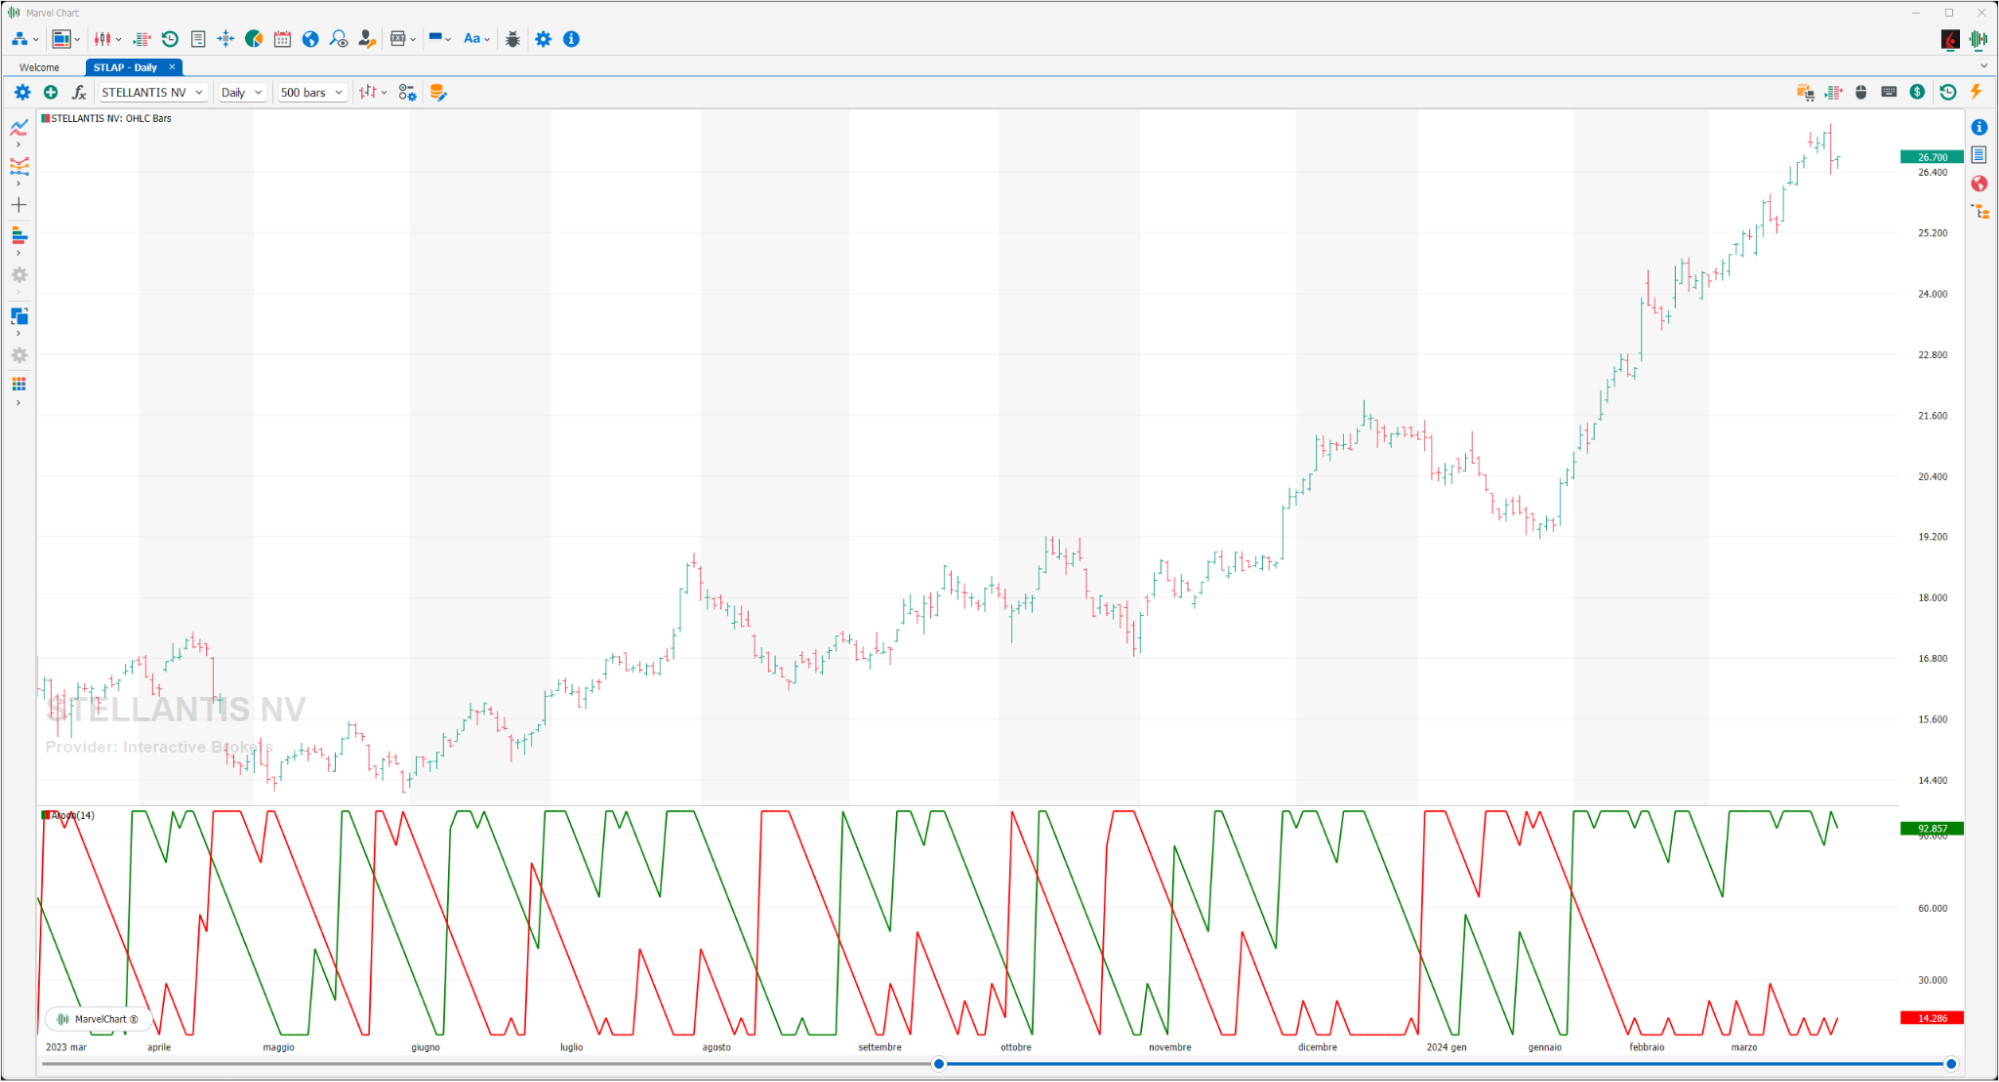
Aroon is a technical analysis indicator developed by Tushar Chande in 1995 that is used to identify trends and their reversals. This indicator is composed of two lines, one called “Aroon Up” that serves to measure the strength of a long trend and the other “Aroon Down” that measures the strength of a short trend.
Both are expressed as a percentage of the total time. Both Aroon Up and Aroon Down therefore oscillate between the values 0 and 100. The closer the values are to 100 the stronger the trend, the closer they are to zero the weaker the trend, therefore the lower the level of Aroon Up, the weaker the long trend and the stronger the short trend and vice versa.
Aroon Up If it has reached the level of 100 the positive trend is very strong. The closer it remains to 100 the stronger the underlying trend will be. If it oscillates between 80 and 100 it suggests a potential positive trend, this signal becomes stronger if at the same time Aroon Down is between 0 and 30. If it oscillates between 0 and 20 it suggests weakness and therefore a possible reversal of the current trend.
Aroon Down If it has reached the level of 100 the short trend is very strong. The closer it remains to 100 the stronger the underlying trend will be. If it oscillates between 80 and 100 it suggests a potential negative trend, this signal becomes stronger if at the same time Aroon Up is between 0 and 30. If it oscillates between 0 and 20 it suggests weakness and therefore a possible reversal of the trend.
Aroon Oscillator

The Aroon Oscillator is a trend-following indicator that uses aspects of the Aroon indicator (Aroon Up and Aroon Down) to assess the strength of a current trend and the likelihood of it continuing. An oscillator reading above 0 indicates that an uptrend is present, while readings below zero indicate that a downtrend is present. Traders watch for zero line crossovers to signal potential trend changes, and large moves, above 50 or below -50, are also highlighted to signal strong price movements.
Center Of Gravity
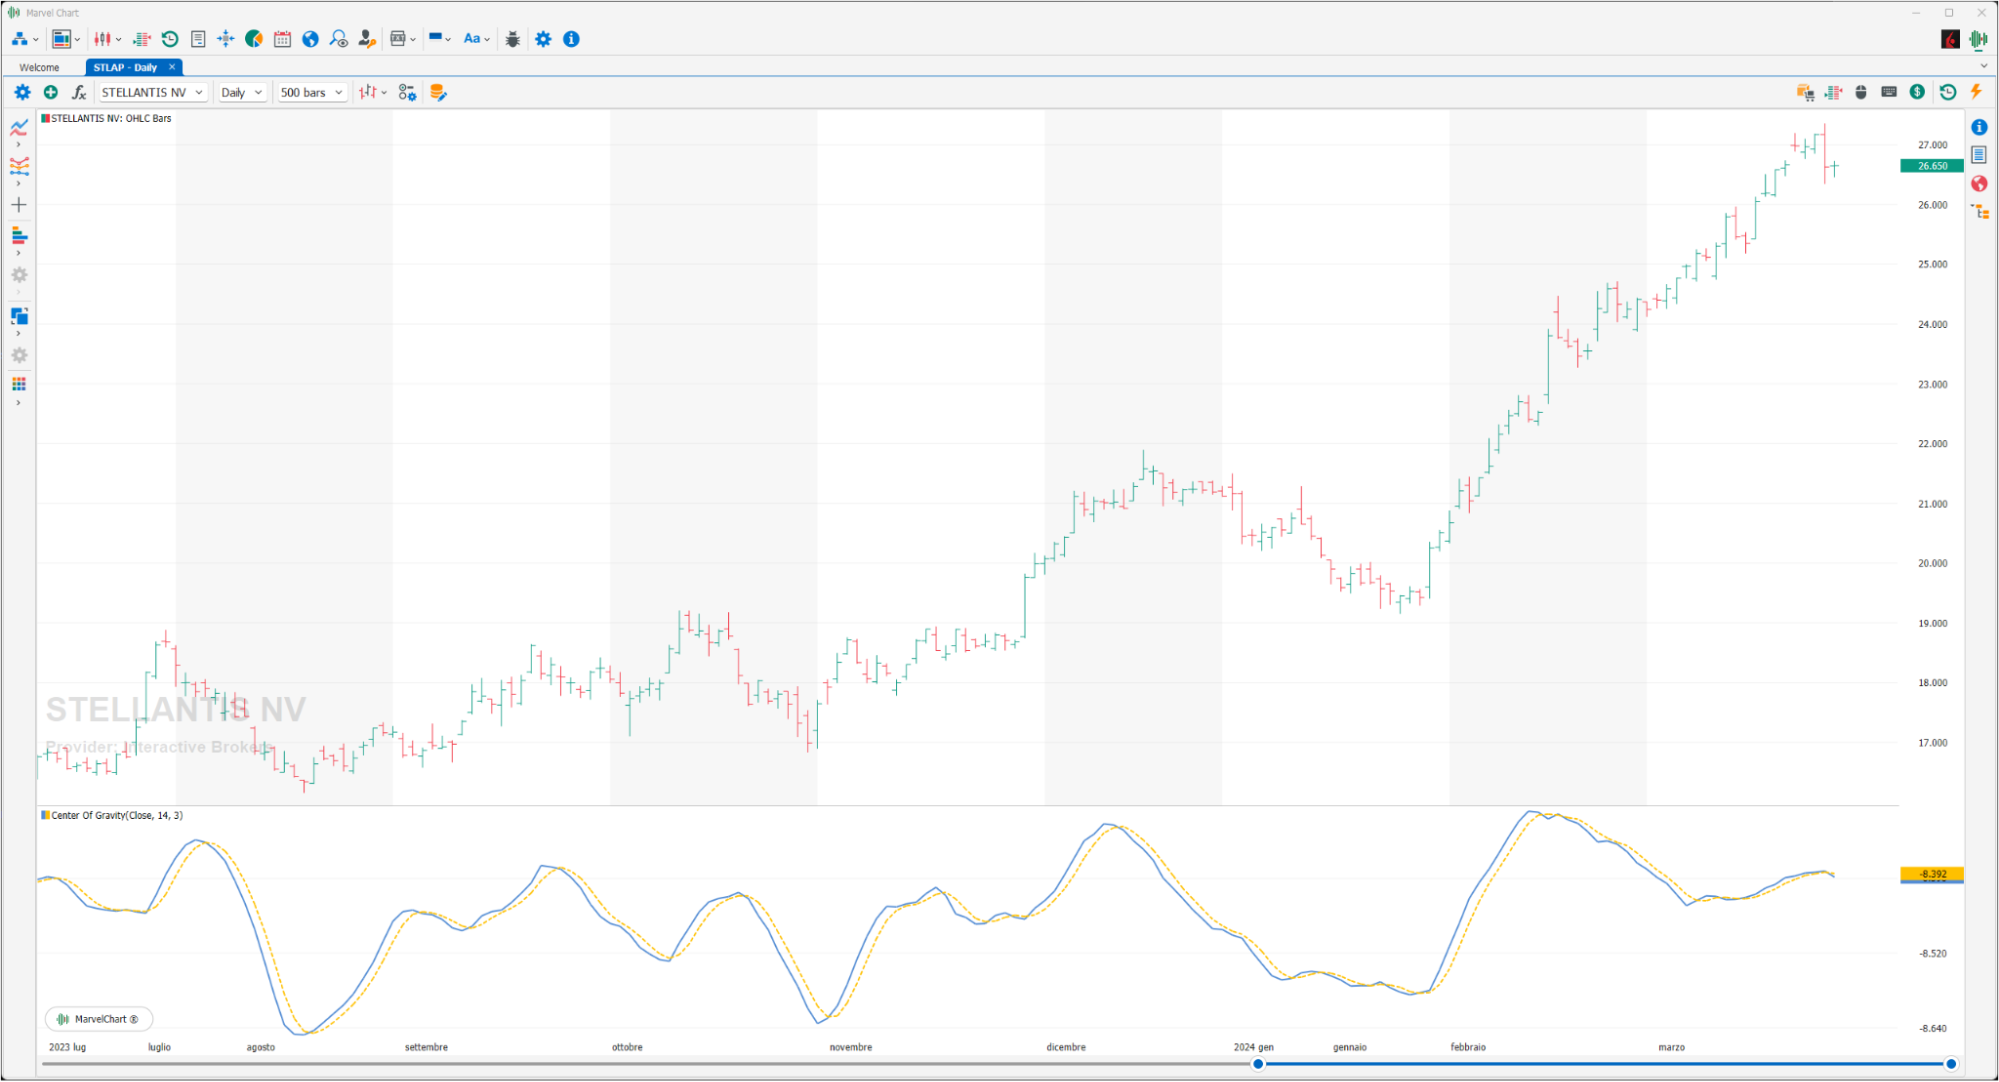
The Center Of Gravity, by John Ehlers, was first published in May 2002, Ehler states that this oscillator has no latencies. The interpretation is the classic one for oscillators, a BUY signal is generated when the fast line crosses the slow line. On the contrary, a SELL signal is generated when the fast line crosses the slow line.
Commodity Channel Index
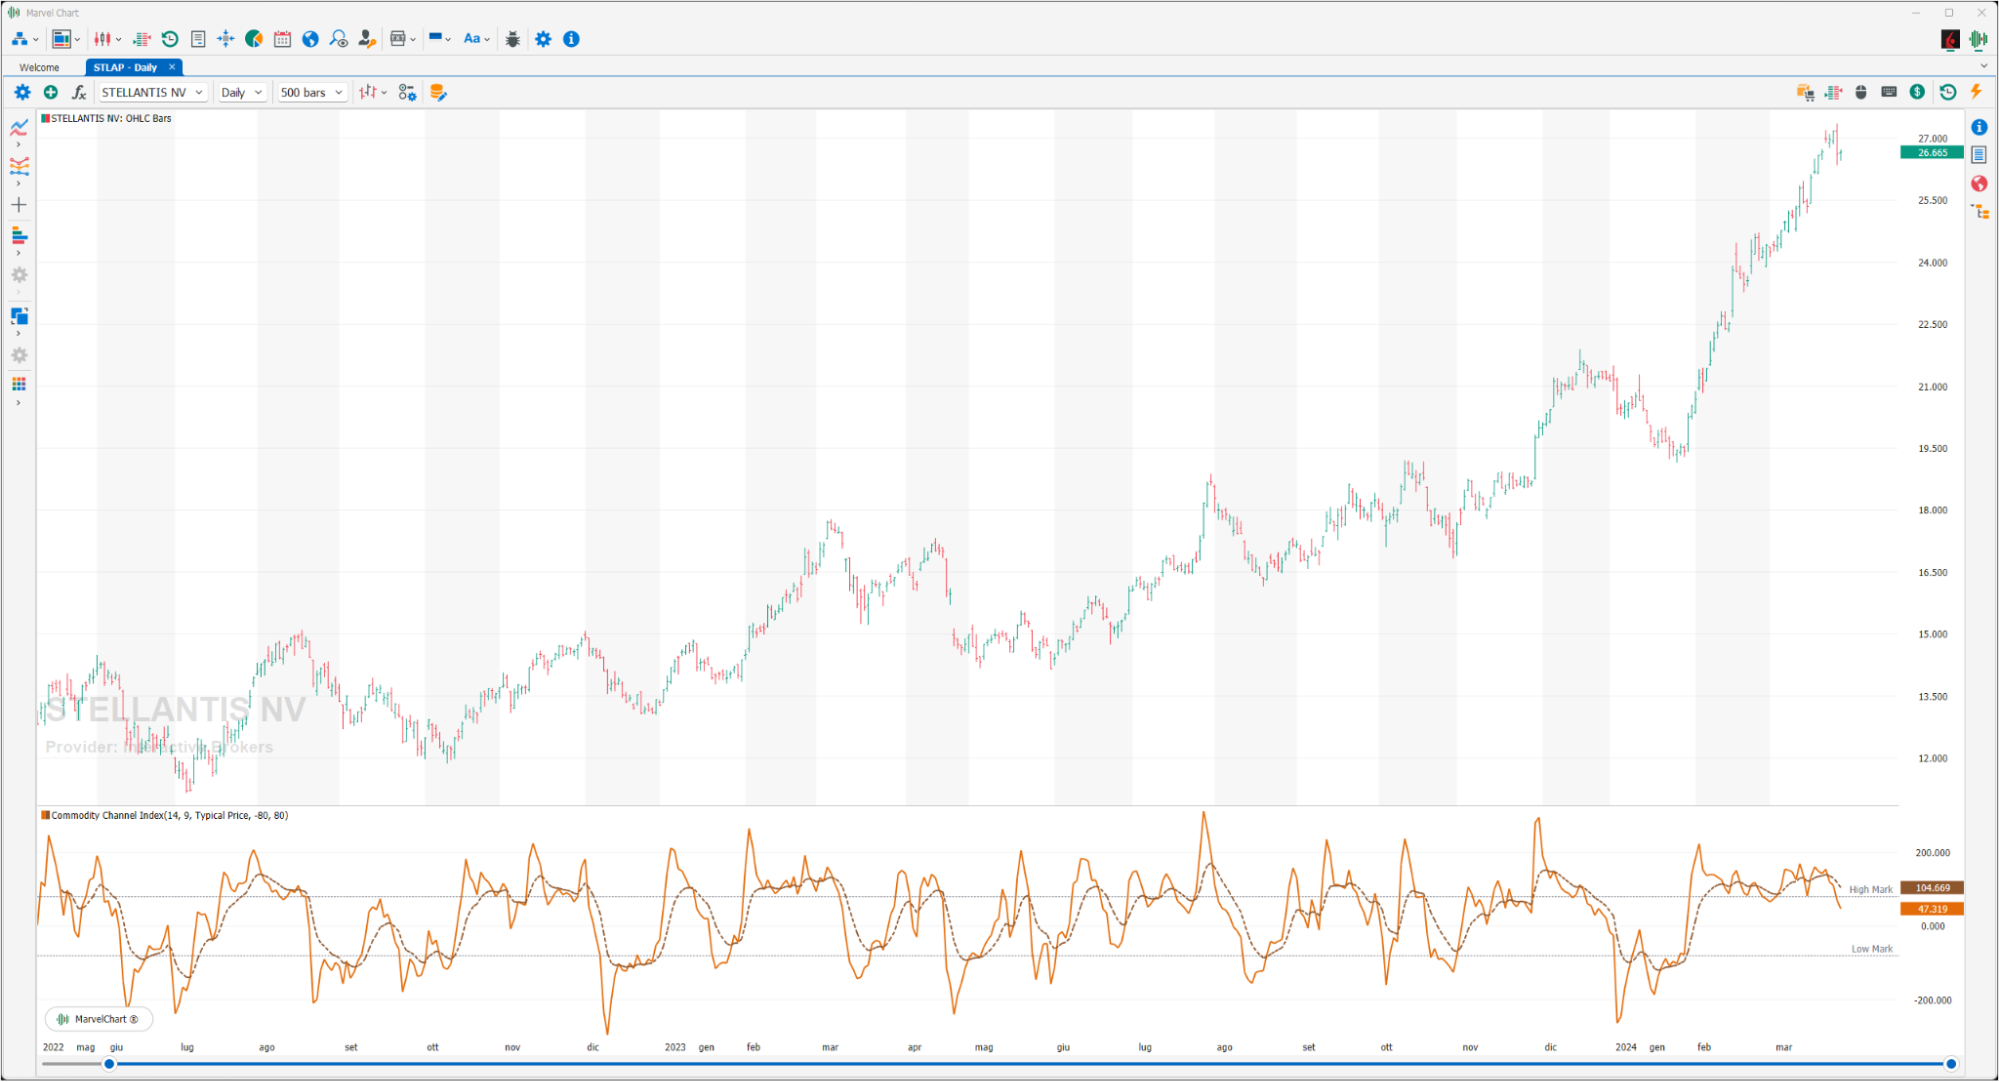
The CCI (Commodity Channel Index) is an oscillator created by Donald R. Lambert to identify cyclical changes in the commodity market. The basic hypothesis of the CCI is that raw materials move cyclically, with the formation of highs and lows at periodic intervals, however this oscillator is also used on stocks and bonds and more generally on all markets that have strong cyclicality. The construction of the Commodity Channel Index starts from the calculation of the “Typical Price” and its “Simple Moving Average” at 20 periods. Lambert recommends using a third of the cycle duration as the period for the calculation of the CCI, so if the cycle lasts 60 periods a CCI of 20 periods will be used. The average deviation is then calculated and the CCI indicator is constructed as the ratio between the difference between the typical price with its moving average and the average deviation multiplied by a constant equal to 0.015. The constant 0.015 introduced by Lambert allows the oscillator to have values that are in the majority (70-80%) of cases between +100 and -100. The CCI is then used as a true oscillator, highlighting overbought situations when it is above +100 and oversold situations when it is below -100. In addition, the Commodity Channel Index provides divergence signals from prices and these are all the stronger when they occur mostly in the indicator's overbought positions.
Ehler Fisher Transform
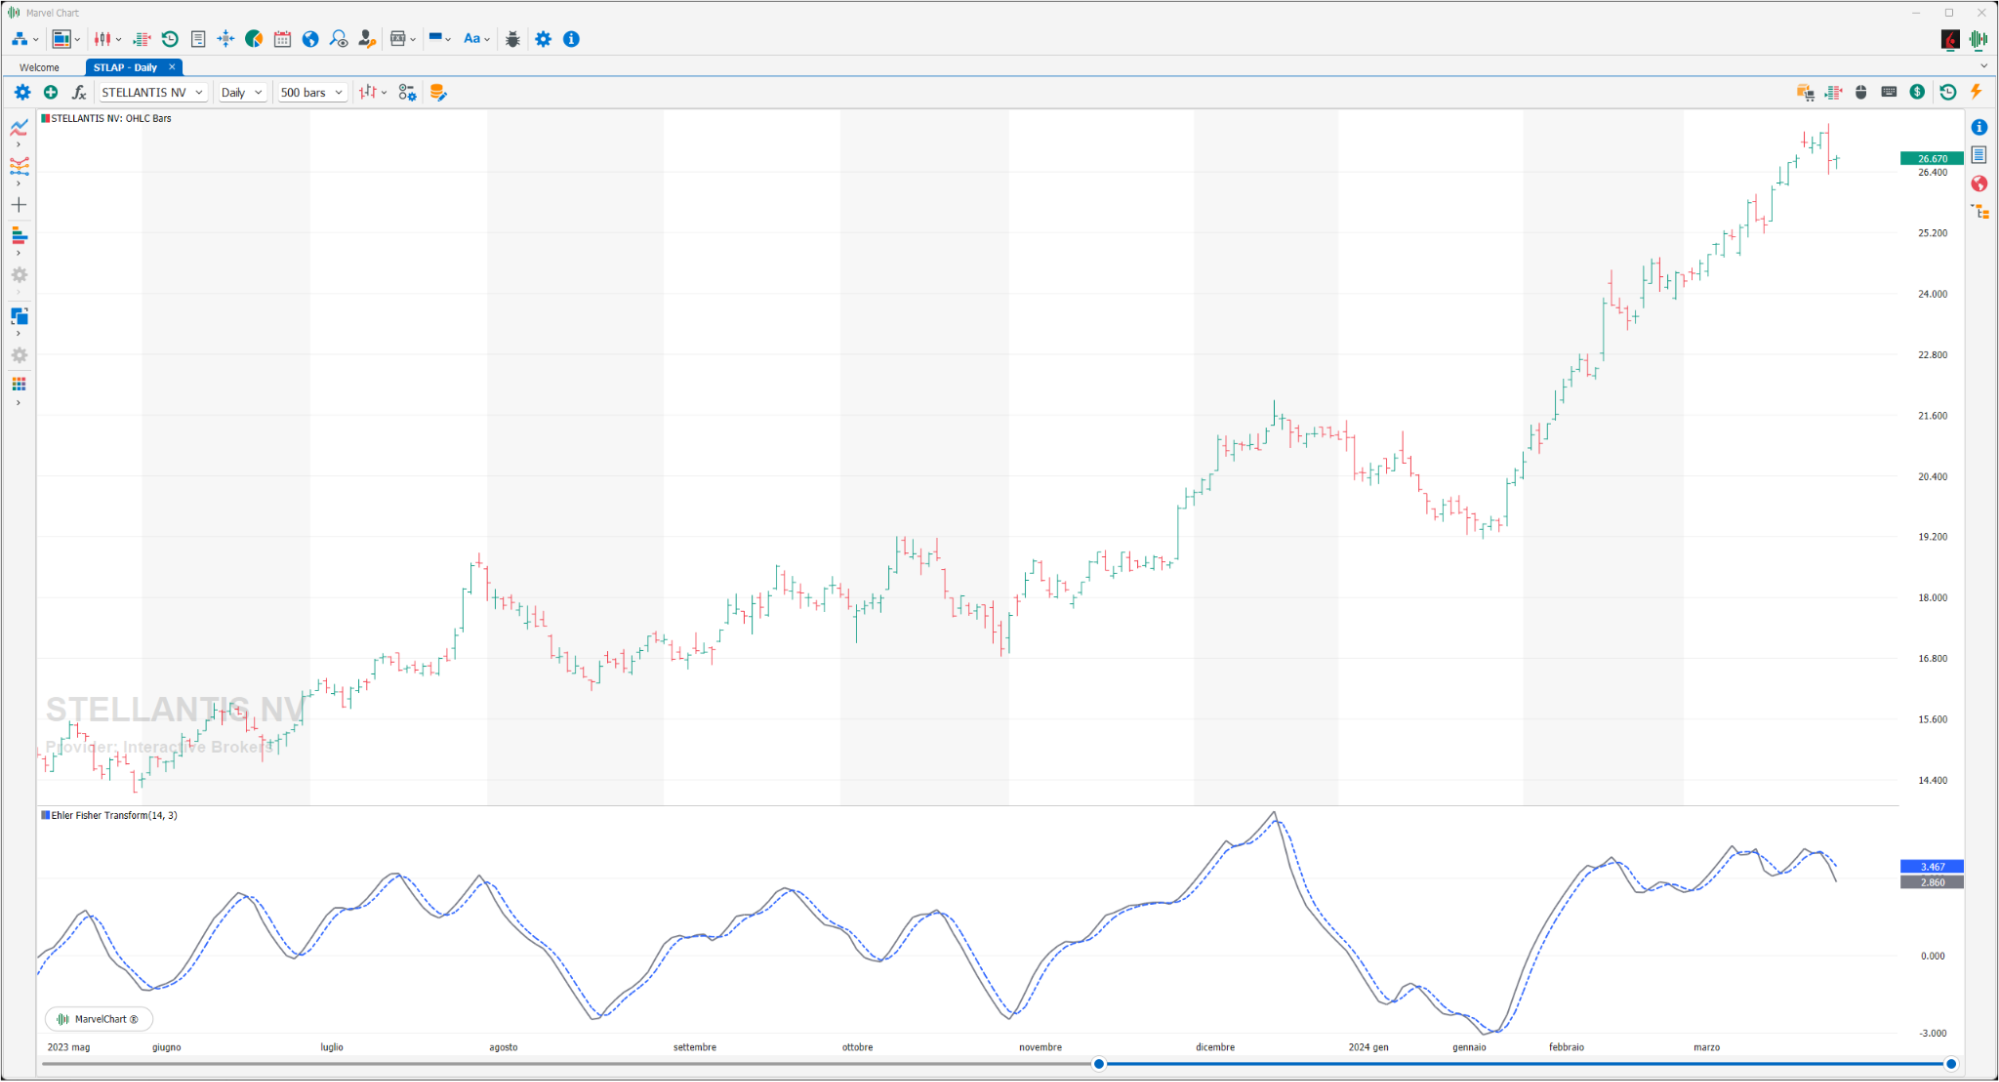
The Ehler Fisher Transform indicator, devised by John Ehler, is of recent conception, in fact it was first published in 2002. With clear turning points and a fast response, the Ehler Fisher Transform is used to identify trend reversals and is based on the assumption that prices behave like a square wave and do not follow a Gaussian or normal distribution. BUY and SELL signals are generated when the indicator crosses the trigger line, which is the Ehler Fisher Transform of a previous bar, upwards or downwards. So a BUY signal is generated when the Fisher line crosses the -1 threshold upwards and crosses above the trigger line. A SELL signal is generated when the Fisher line crosses the 1 threshold and crosses the trigger line.
FX Sniper
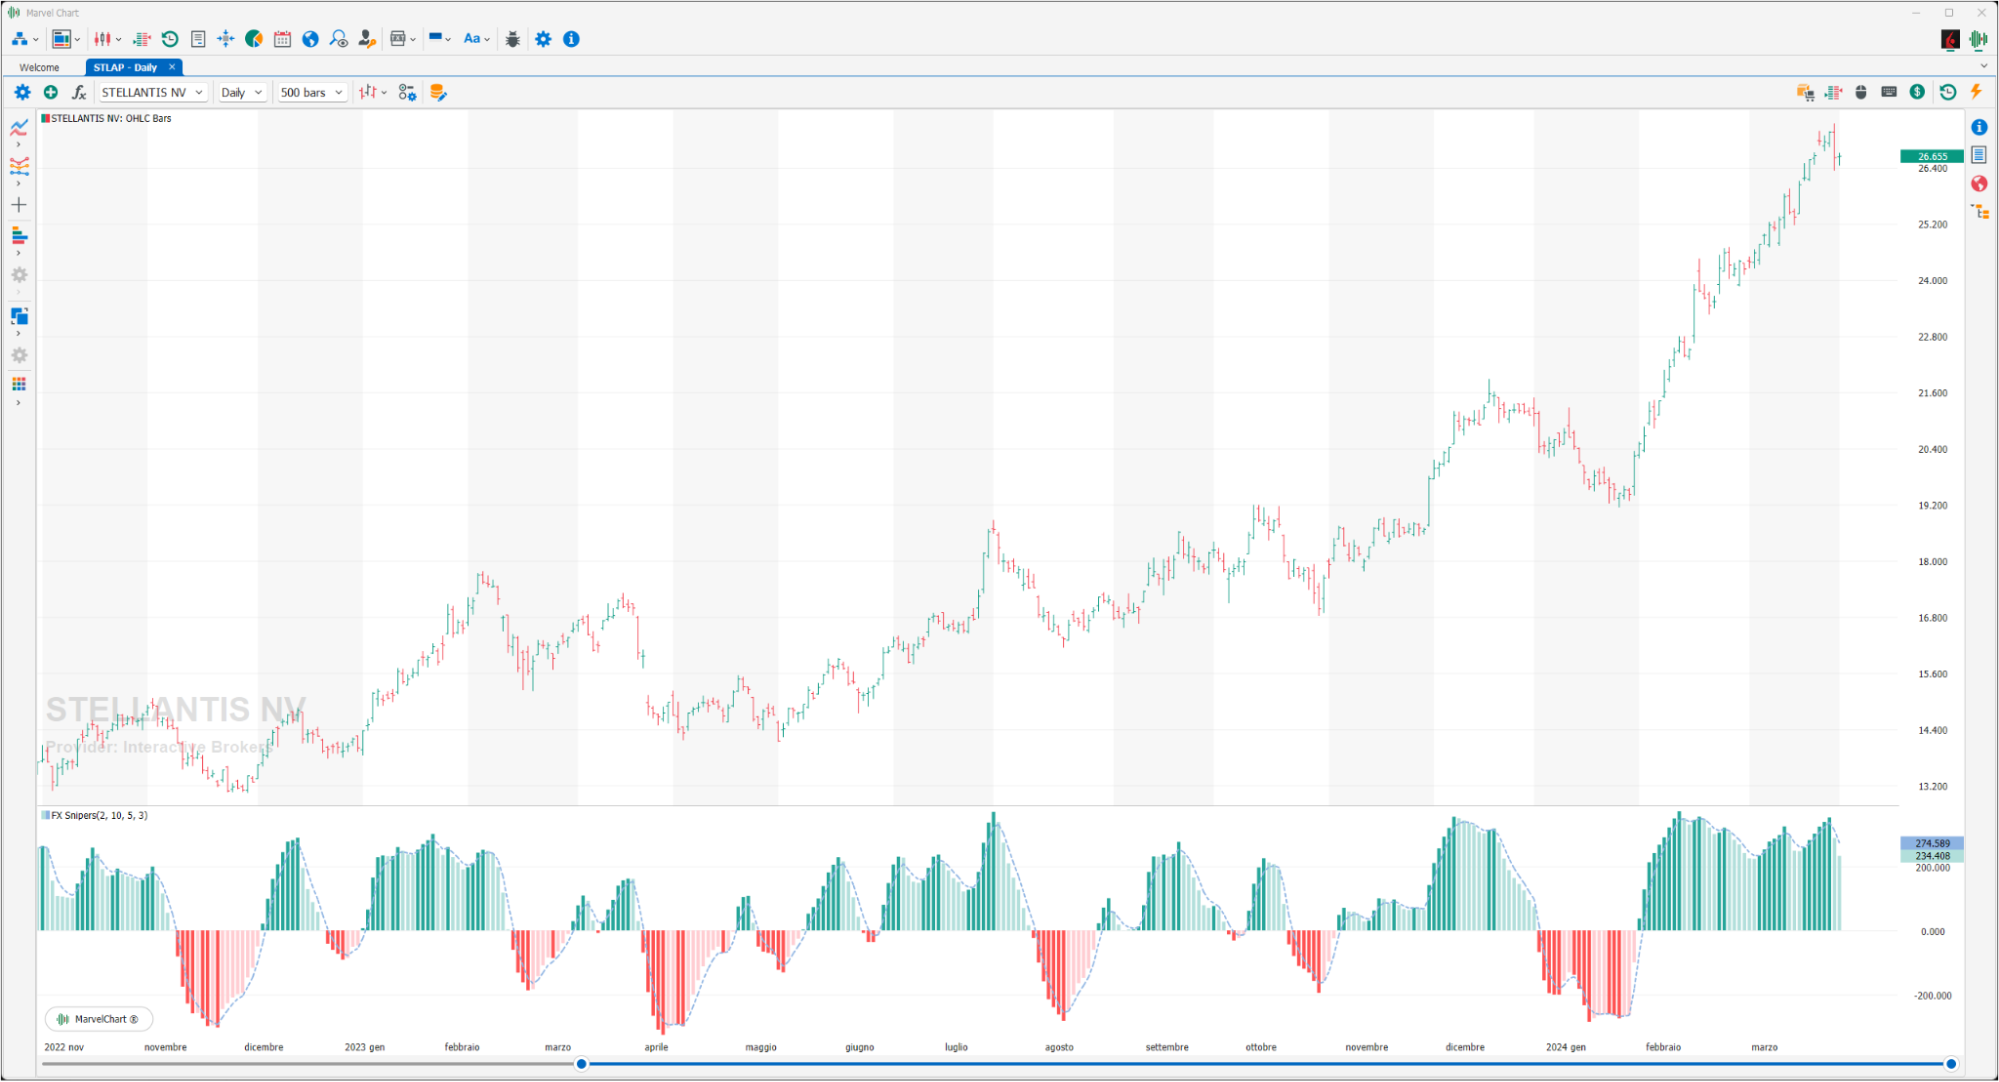
The main purpose of this tool is to help traders and investors in all types of financial markets to catch the next price movement just when the price direction is about to change. This tool can be used to identify the price direction in both downtrend, uptrend and range-bound markets. This tool can be used as a standalone tool although it can also be combined with other tools.
MACD
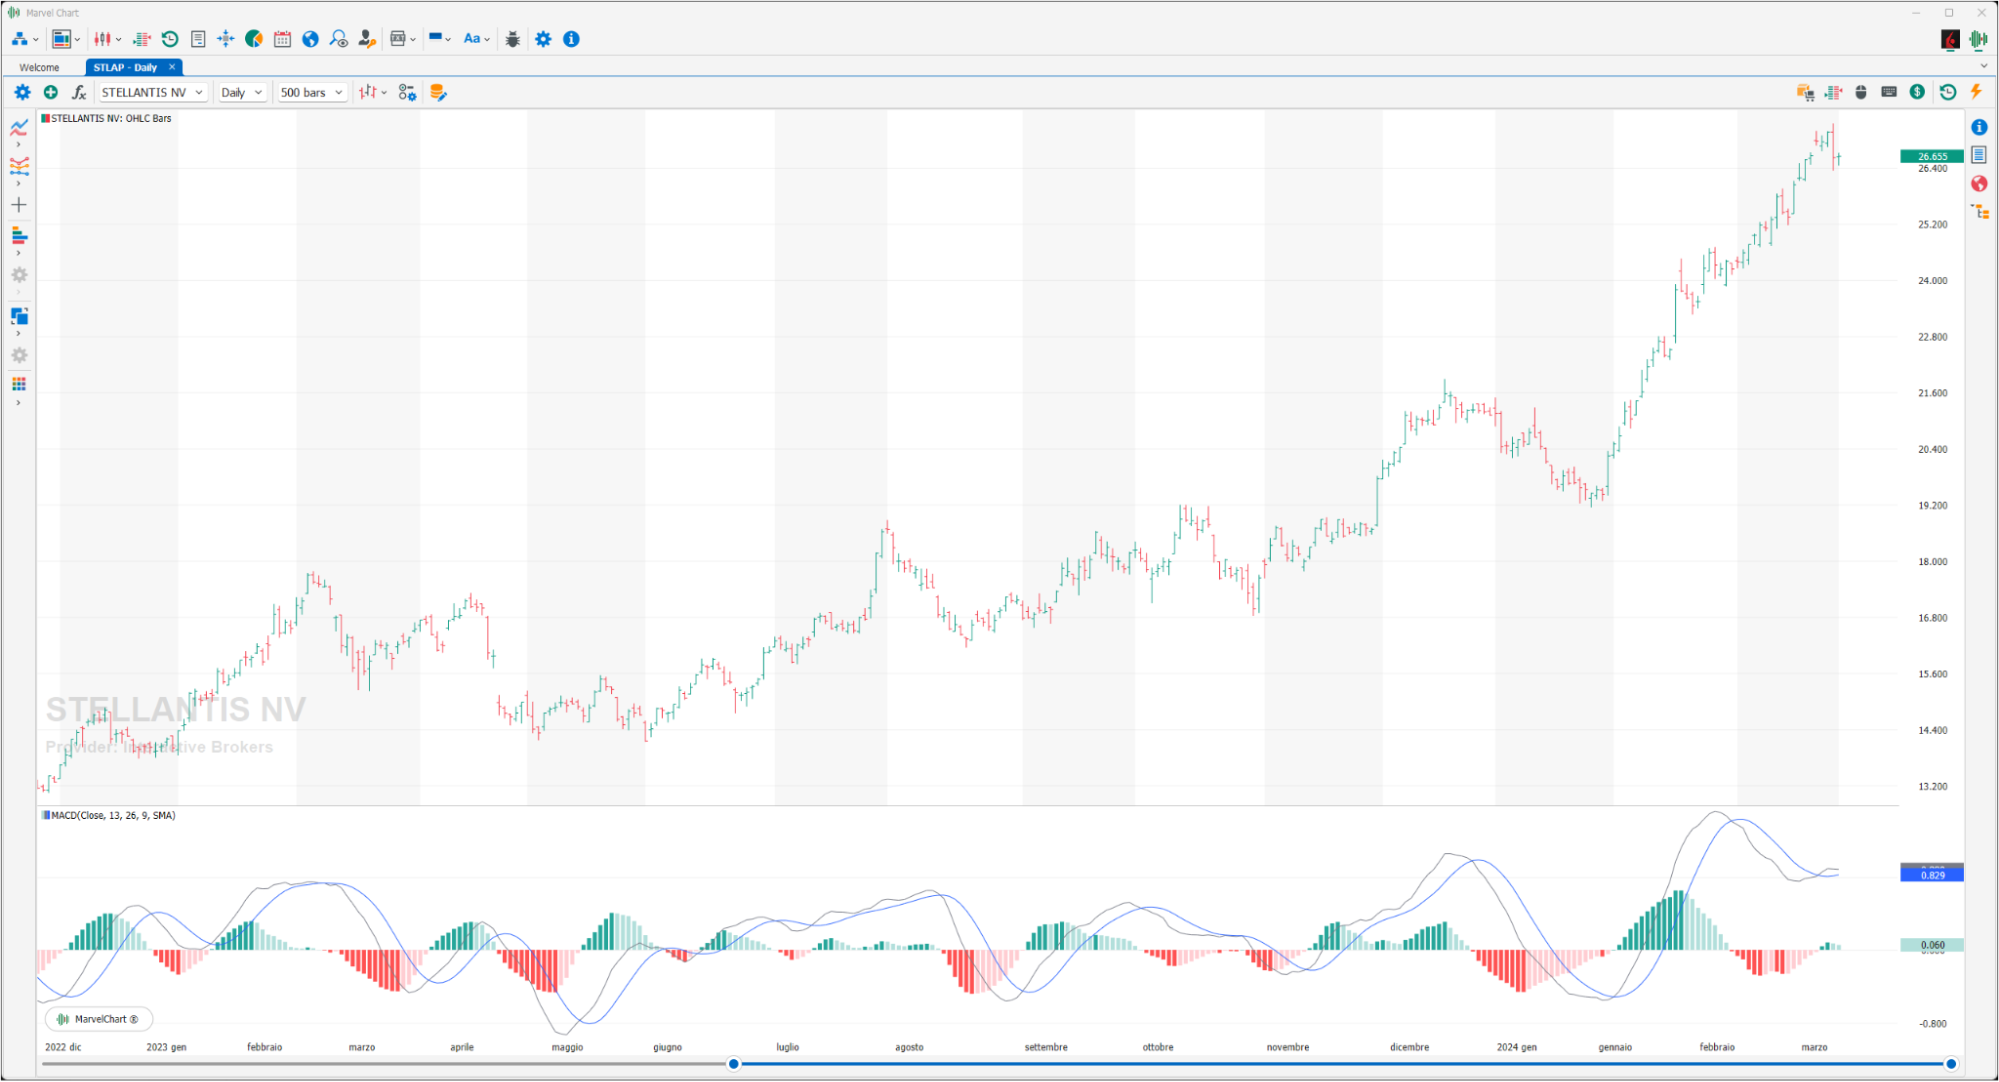
The Moving Average Convergence Divergence, or more simply MACD, is a technical analysis indicator invented and developed by Gerald Appel in the 1970s. From a graphical point of view, the MACD appears as two lines that oscillate around the zero threshold. The fastest line, called the MACD line, is given by the difference between two “Moving Averages” calculated on the CLOSE prices at 12 and 26 periods. The slowest line, called the MACD Signal, is an exponential moving average with 9 periods of the MACD line. From an operational point of view, there are different interpretations relating to the moment in which the MACD generates BUY or SELL signals when the two lines cross. A first method of using the MACD generates a BUY signal when the MACD line crosses the MACD Signal from bottom to top, instead we will have a SELL signal if the MACD line were to cross the MACD Signal from top to bottom. The MACD can also be used to signal overbought or oversold areas. We will have overbought when the lines that work above the zero threshold are far from the zero line, we will have oversold when the lines that work below the zero threshold are far from the zero line itself. Reliability is strictly linked to the assignment of a value for “distant” since it is not possible to simply establish an objective value on the basis of which this condition can be considered confirmed. Finally, another interpretation is to activate the BUY or SELL signal when the lines exceed the zero threshold. Although the signal is more reliable, this type of operation causes much of the movement to be lost at birth. Since the MACD is an indicator based on the “Moving Average”, by its nature it will move late compared to the pure price. If we were to add a further delay to this delay due to the confirmation of the signal with the passage of the zero threshold, it is quite understandable how our entry timing could be significantly affected.
Mass Index
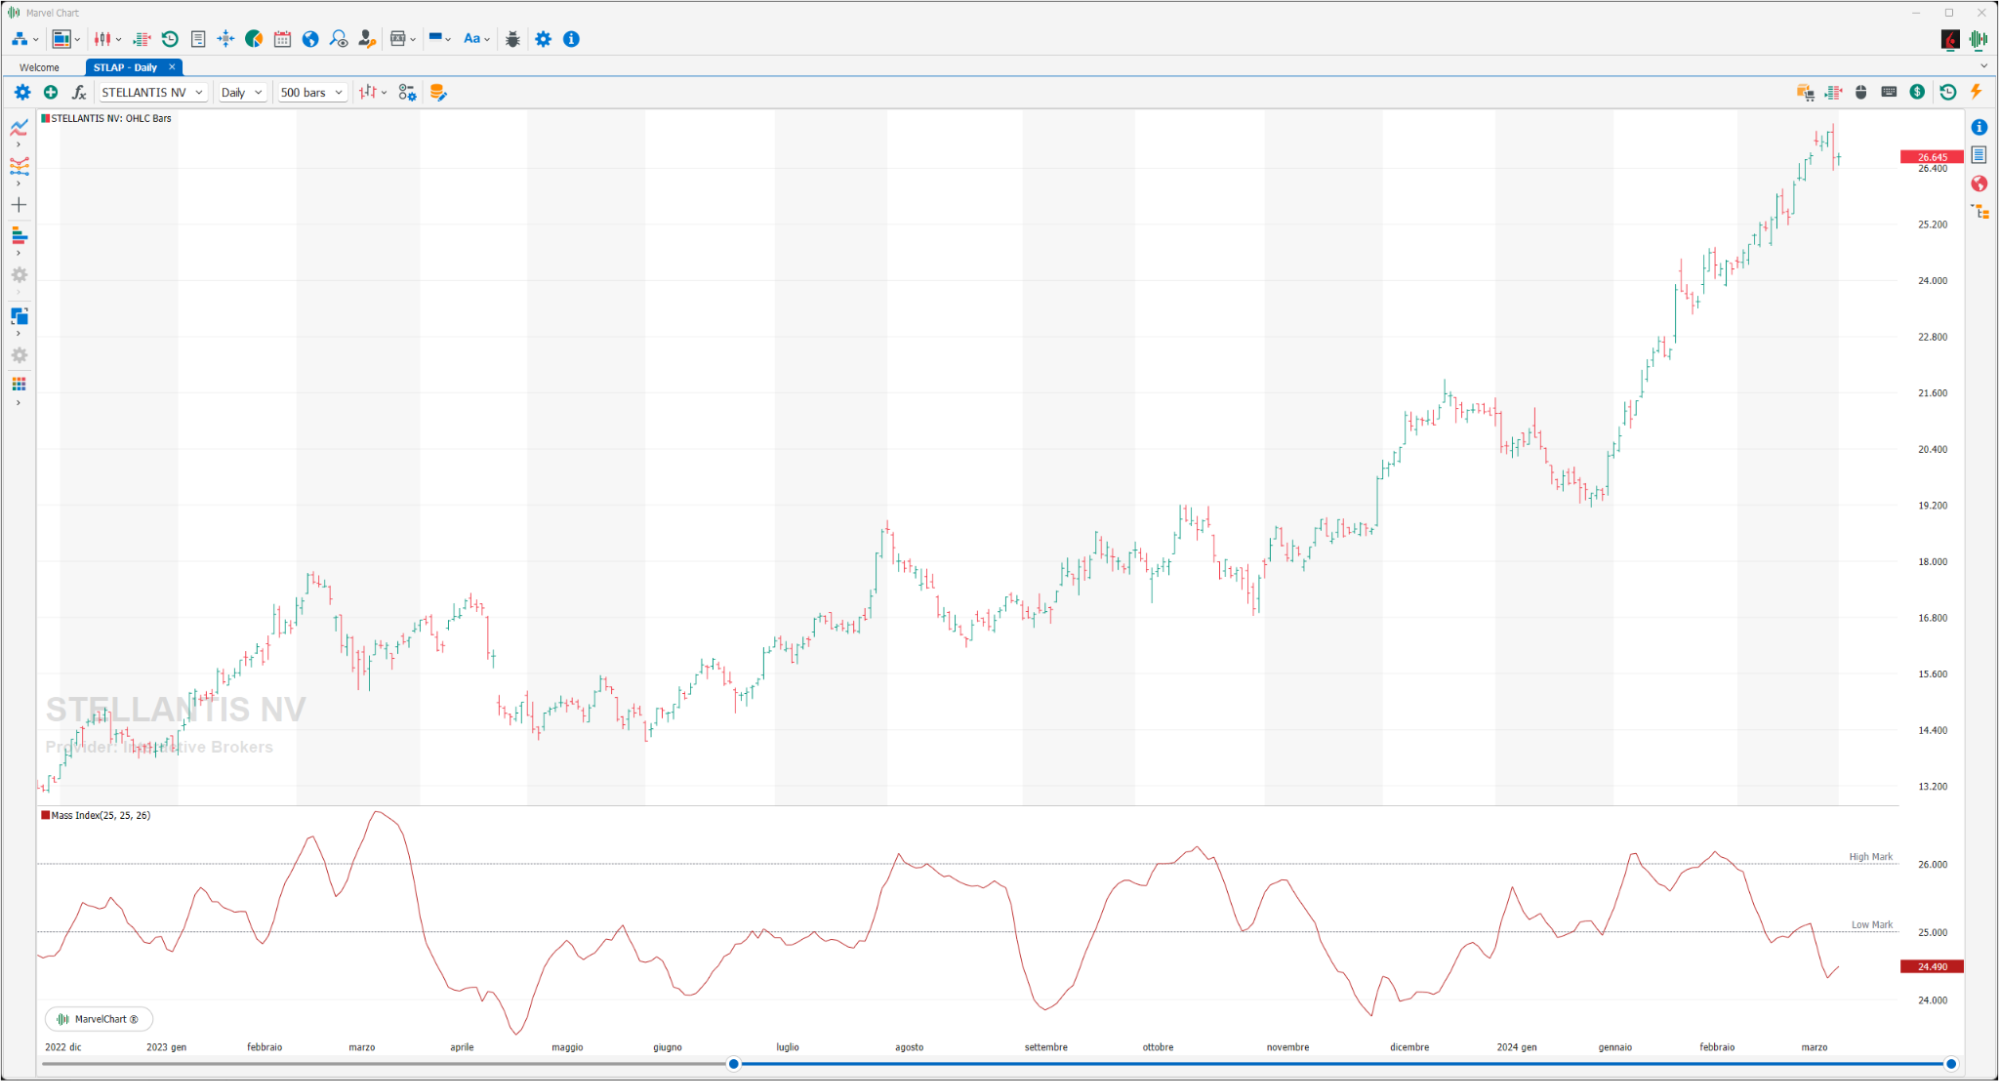
The Mass Index is an indicator created by Tushar Chandle and Donald Dorsey. To build it, an “exponential moving average” of the price fluctuation range (difference HIGH – LOW) of a fixed period is used, usually 25 periods. If the difference HIGH – LOW increases, the Mass Index increases, on the contrary, if the difference HIGH – LOW decreases, the Mass Index decreases. The use recommended by the creator of this indicator also includes the use of a “Moving Average” on the CLOSE to confirm whether the Mass Index indication is BUY or SELL. Therefore, if the Mass Index is falling and the “moving average” is rising, there could be a bearish reversal, while if the Mass Index and the “moving average” are falling, a bullish reversal could occur.
Mayer Multiple

The Mayer Multiple is an oscillator calculated as the ratio of the price to the 200-day moving average. The 200-day moving average is a widely recognized indicator for establishing a bullish or bearish macro bias. The Mayer Multiple is therefore a measure of the distance from this long-term average price as a tool for assessing overbought and oversold conditions. According to the original analysis, overbought and oversold conditions have historically coincided with Mayer Multiple values of 2.4 and 0.8, respectively. These multiples are then applied to the 200DMA to establish cyclical top and bottom price patterns.
Performance Index
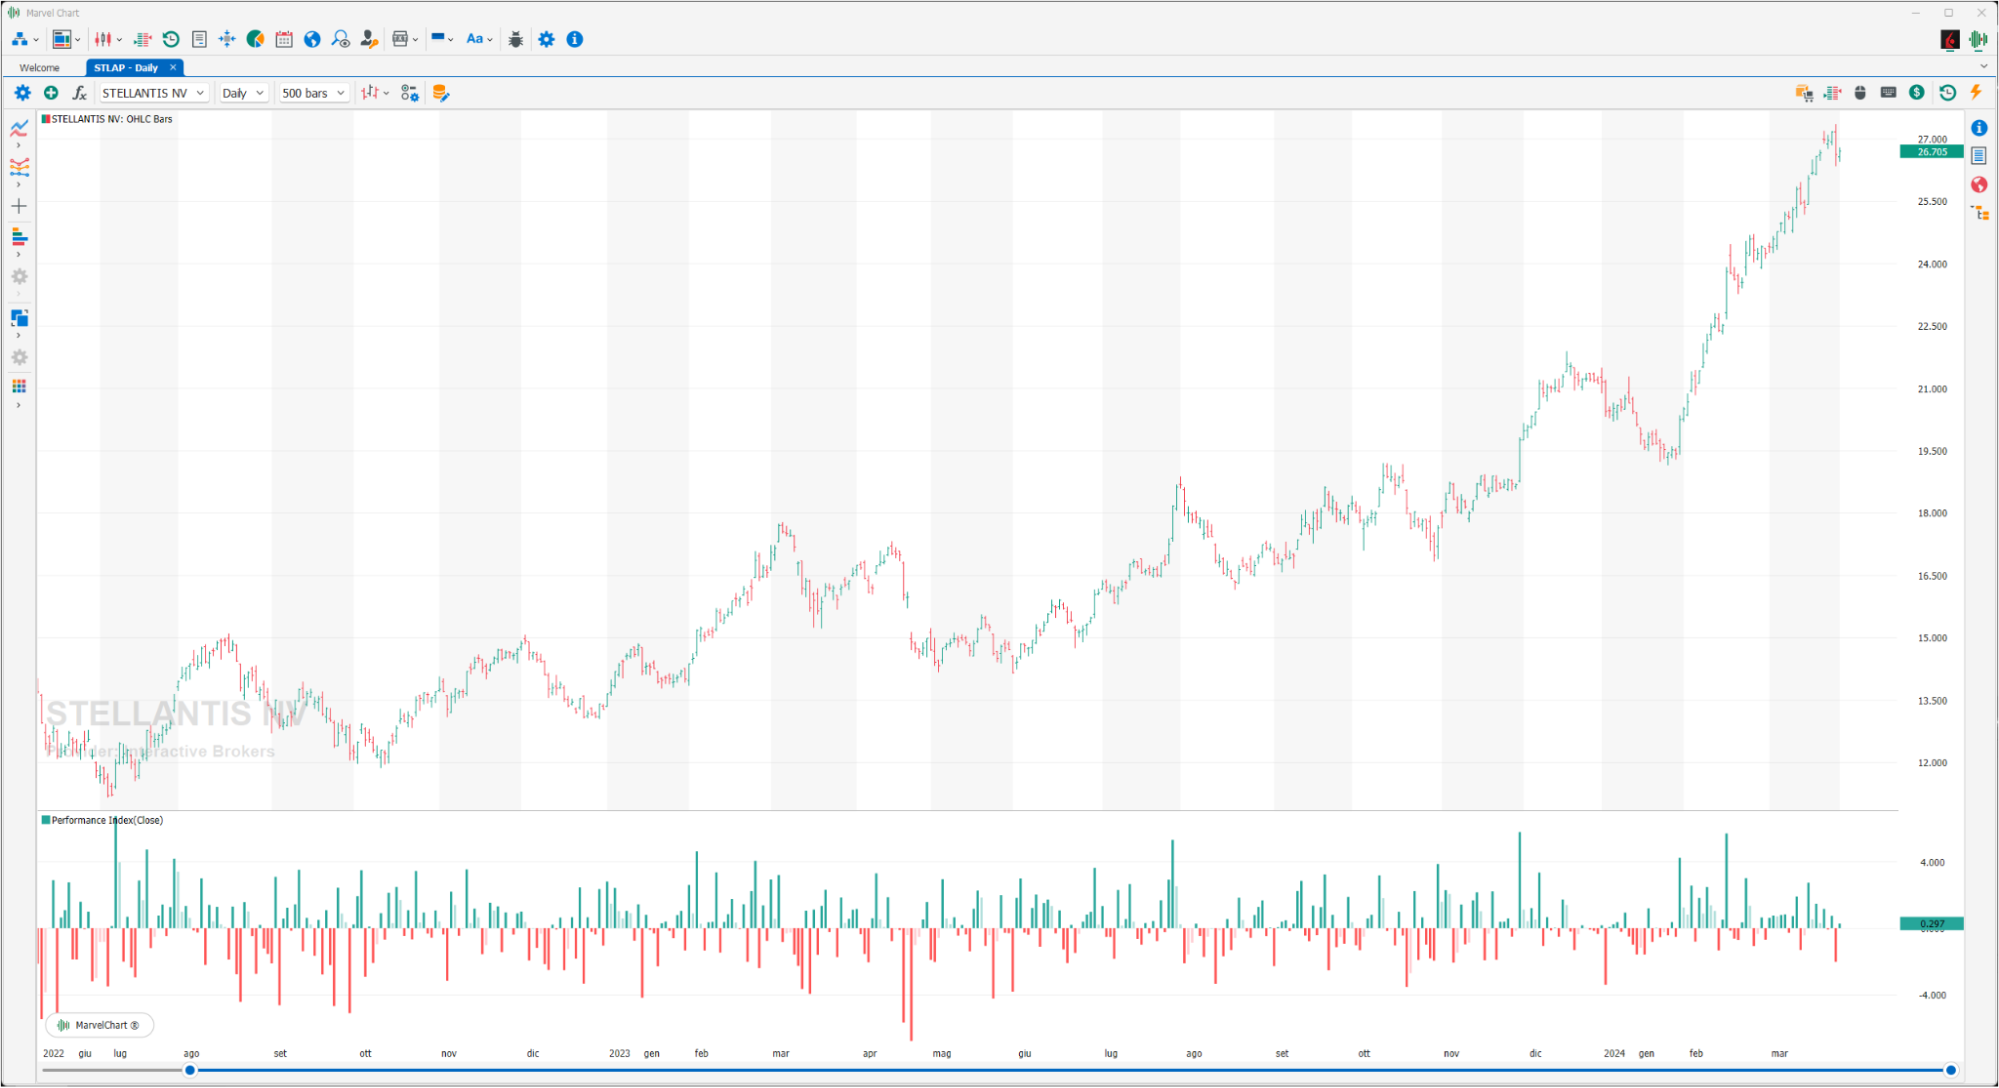
The Performance Index indicator is extremely simple both conceptually and in its calculations. It is based on the concept of performance, i.e. the variation between the CLOSE price of a bar and the previous one, identifying its trend. This simple calculation is then normalized to a percentage value, therefore it is advisable to display it via a histogram.
RAVI
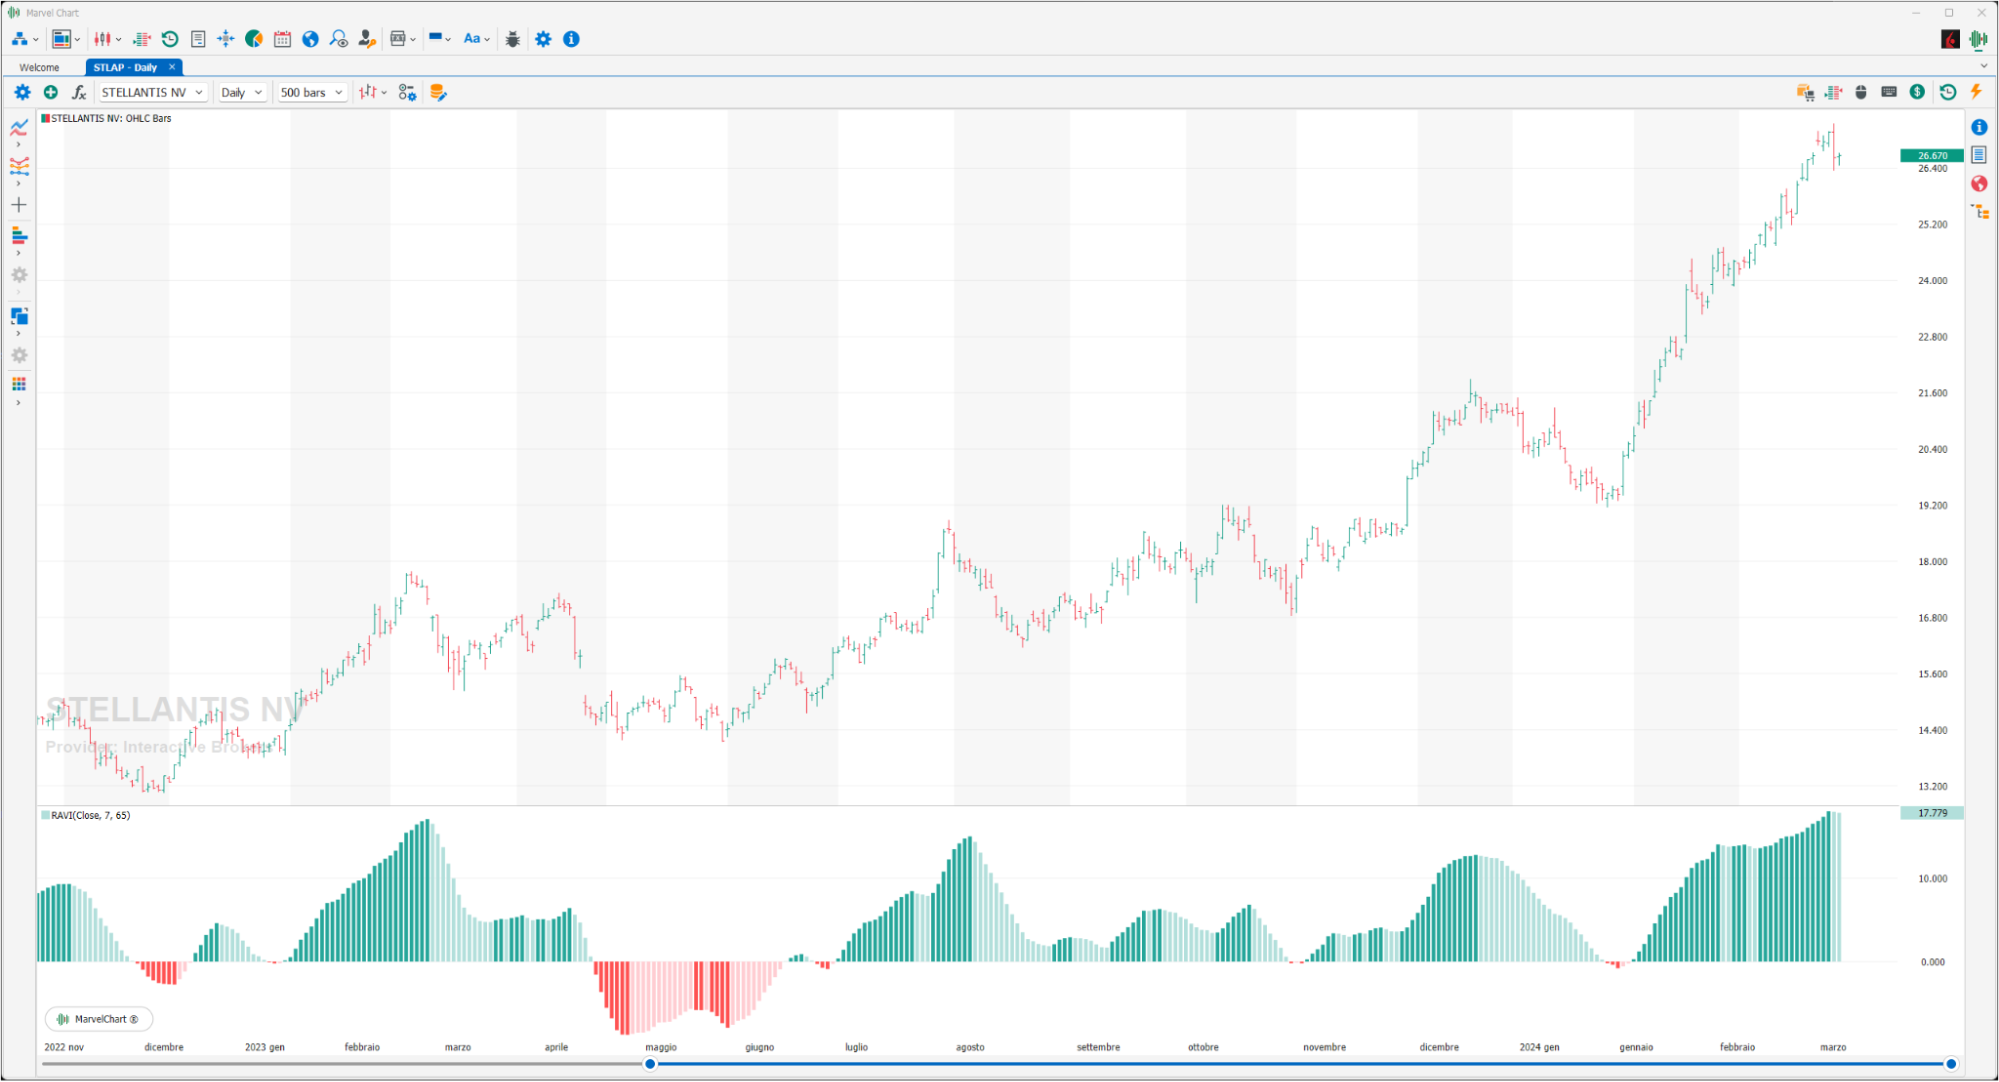
The RAVI indicator (Range Action Verification Index) is a trend indicator to be used on a daily timeframe developed by Tushar Chande. The RAVI is calculated using the “moving average” of different lengths. The first is a short “Moving Average”, following the indications of the inventor with a period of 7 bars. The second is a long “Moving Average”, following the inventor's indications with a period of 65 bars. The market is to be considered in trend if the RAVI value is greater than 0 for an uptrend, less than 0 in the case of a downtrend. Otherwise the market is consolidating.
Relative Vigor Index
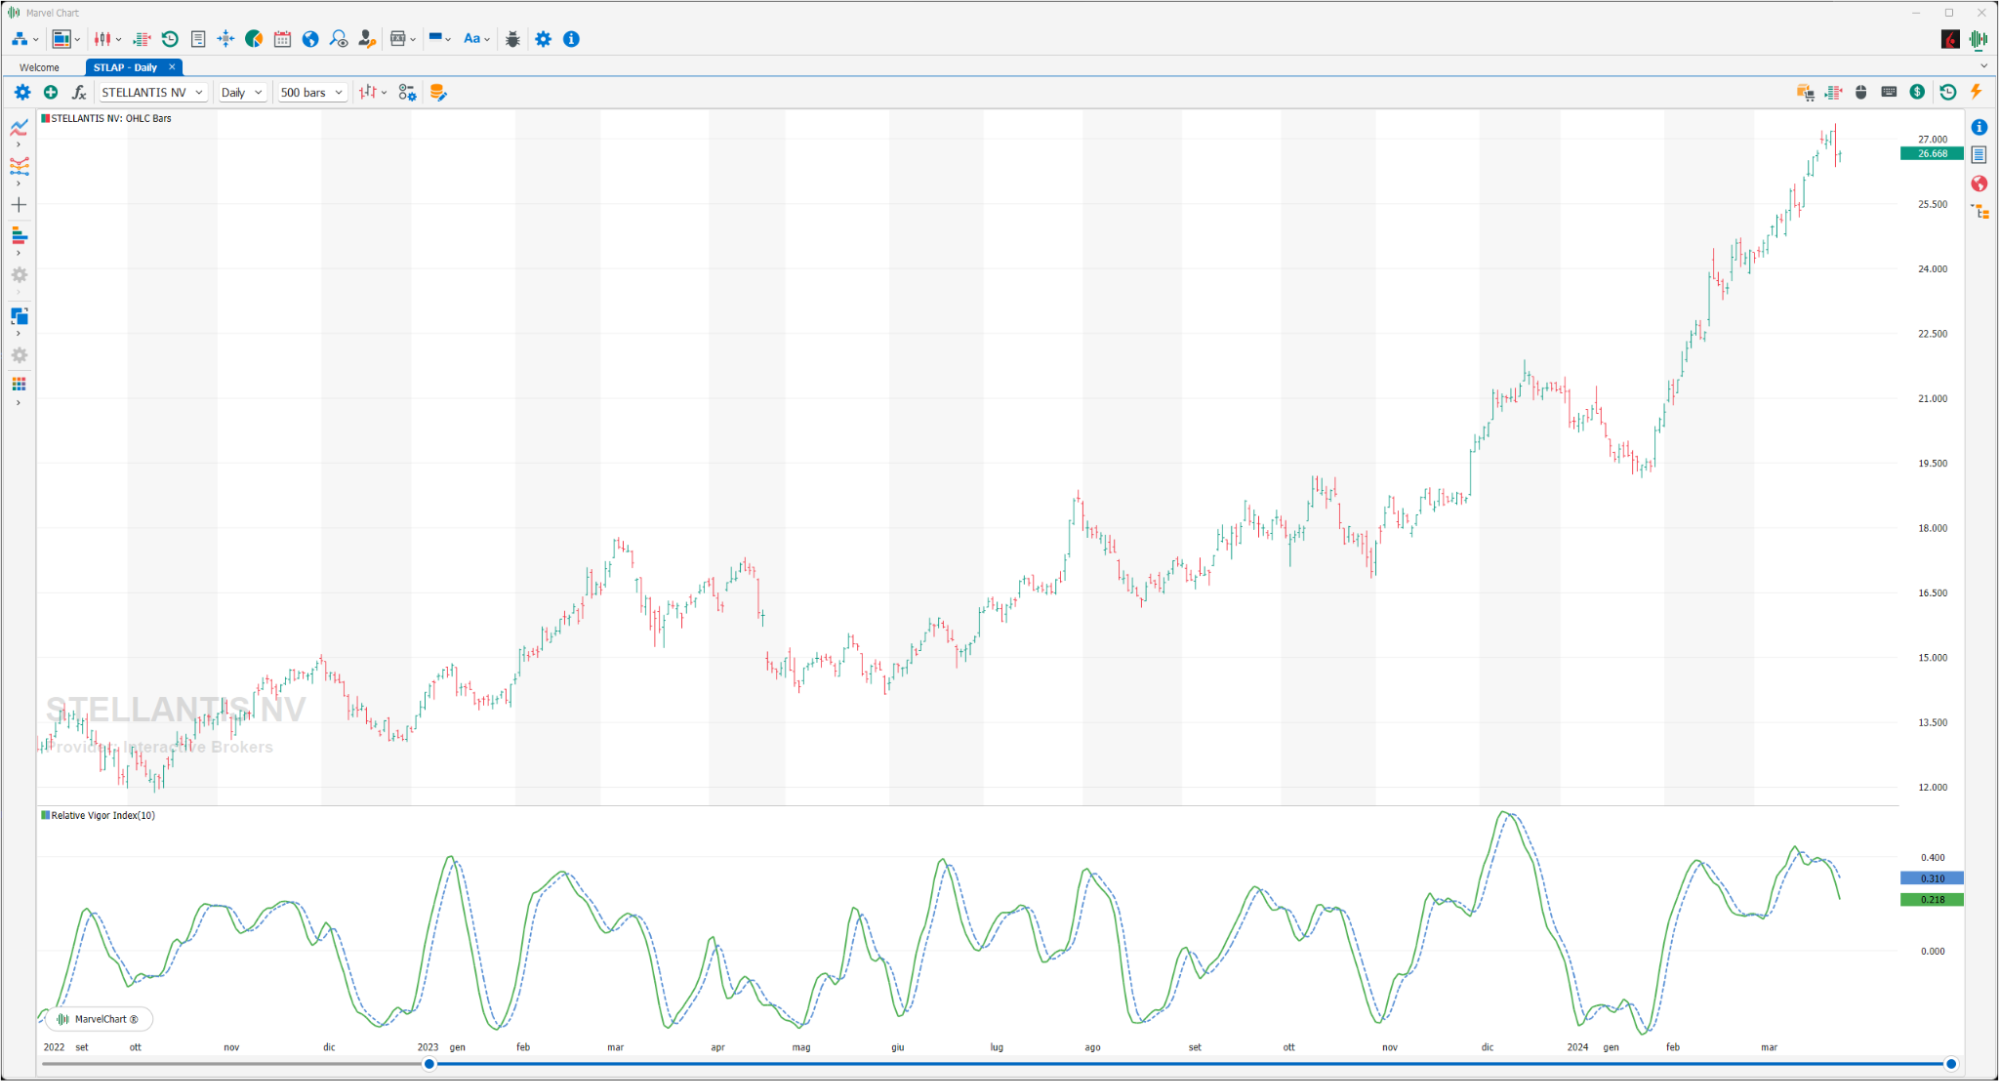
The Relative Vigor Index is based on the probability that prices close higher than the opening in the market's uptrends and, similarly, close lower than the opening in the market's downtrends. The Relative Vigor Index compares the closing price of a stock or asset with its trading range.
Schaff Trend Cycle
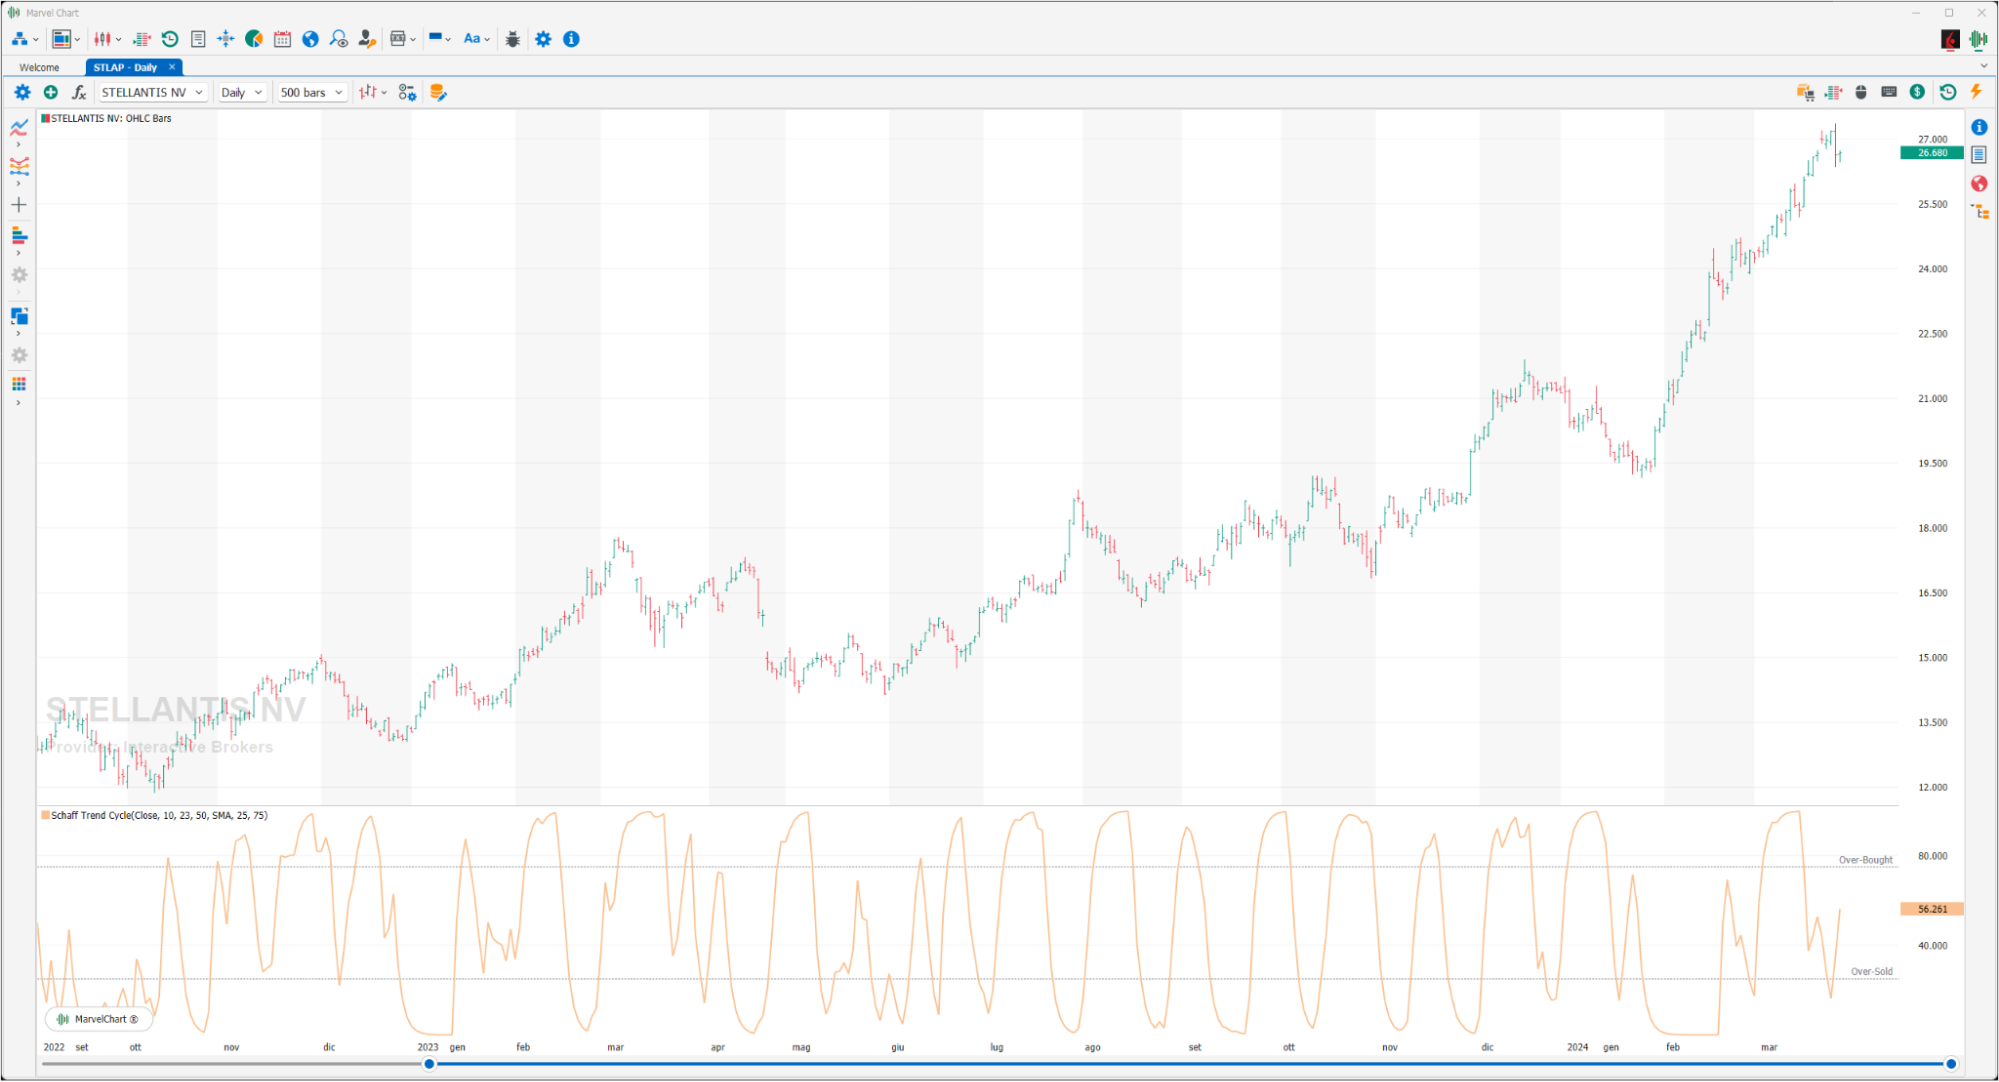
The Schaff Trend Cycle indicator created by Doug Schaff in 2008, is based on the assumption that trends accelerate and slow down cyclically, so it reacts to sudden changes in price, ignoring small ones. According to Doug Schaff's concept of the indicator, after a certain period of time, the trend returns to the original point of development in the markets, and the cycle of its subsequent movements begins to repeat itself. A SELL signal is generated when the indicator line crosses the 75% line. A BUY signal is generated when the indicator line crosses the 25% line upwards. Doug Schaff also suggests a signal filtering: if the bar following the signal bar closes below the previous HIGH, this means a greater probability of price movement and, consequently, of purchases. The signal to sell is represented by the opposite situation, that is, when the bar following the signal bar closes below the LOW of the previous bar.
Swing Index
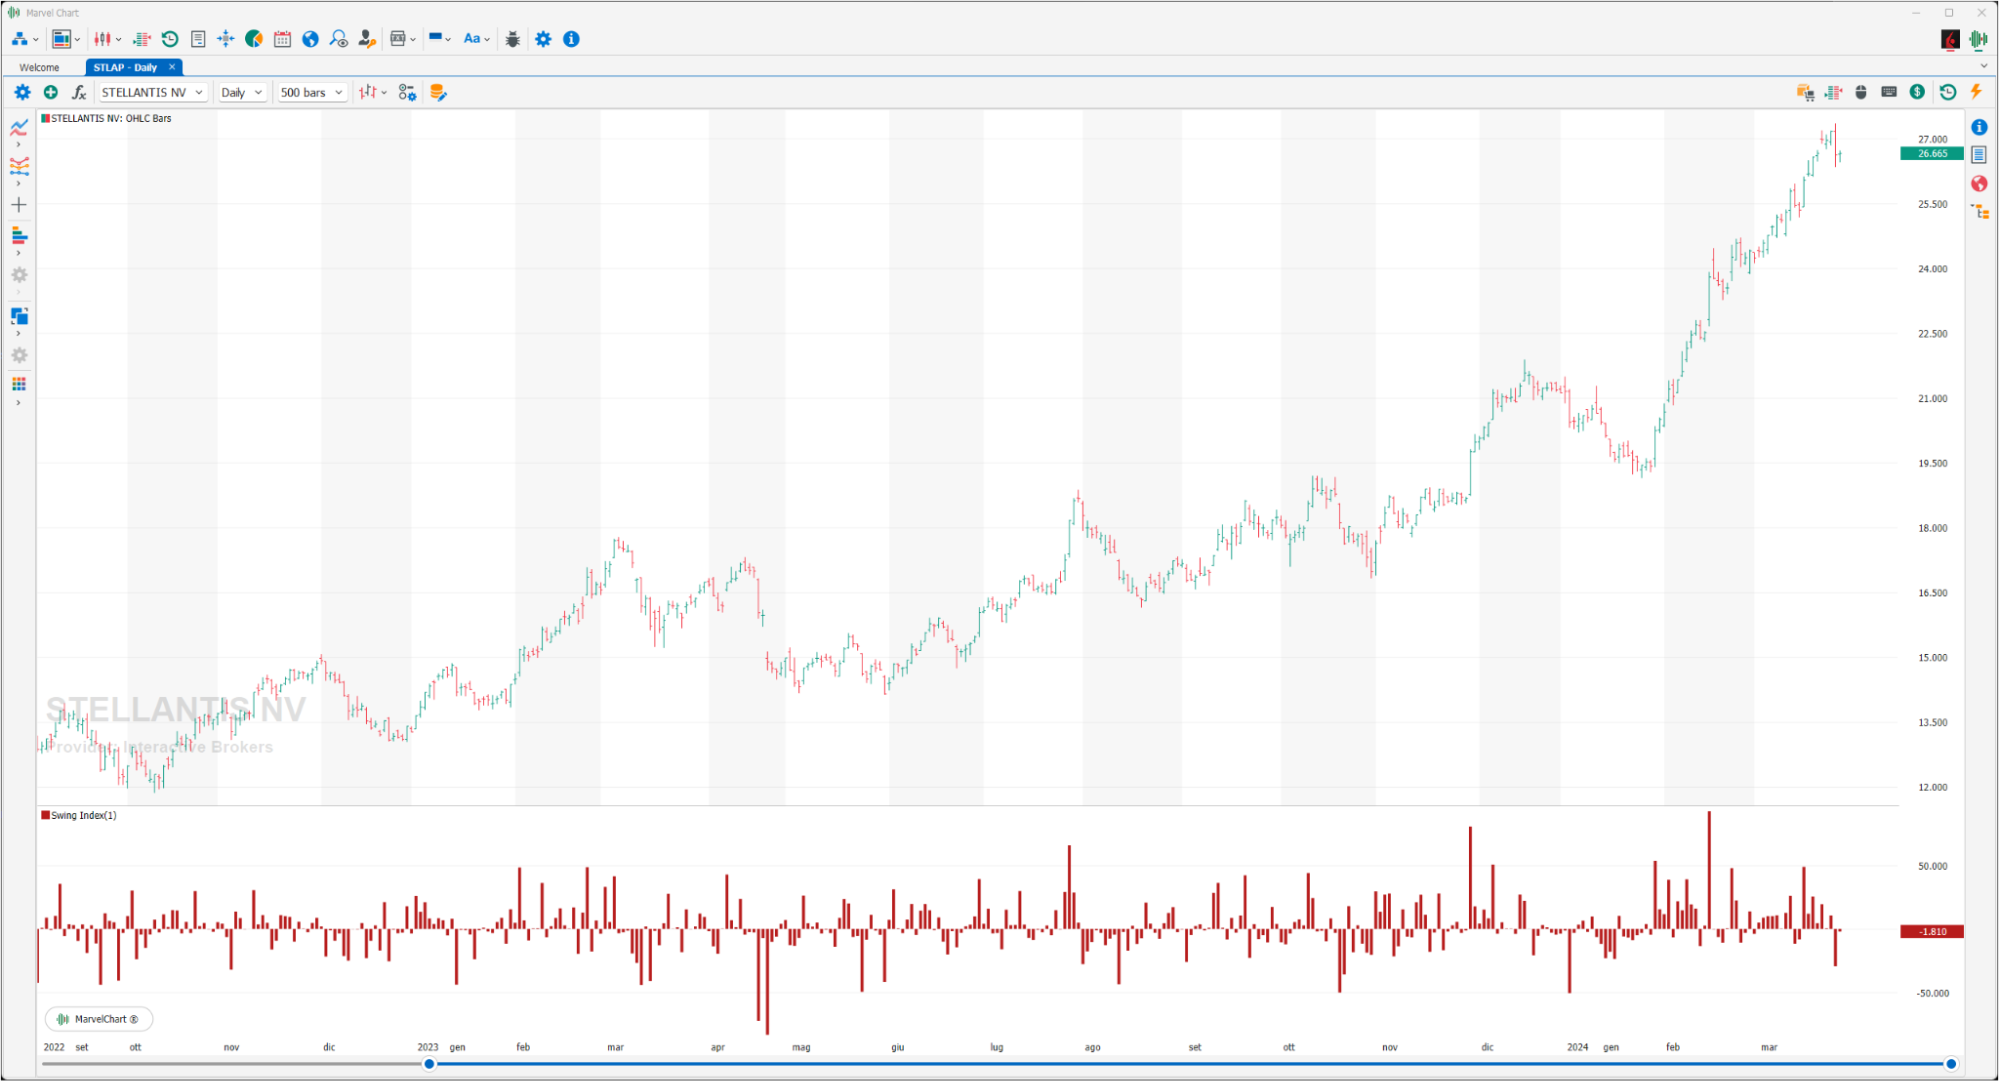
The Swing Index is a technical analysis indicator developed by Welles Wilder that aims to give a short-term indication by isolating the “real” price of a financial instrument by comparing the relationships between current prices (OPEN, HIGH, LOW, CLOSE) and the prices of the previous period. The interpretation is very simple: the forecast is bullish if the Swing Index is above 0, on the contrary it is bearish if it is below 0.
Traders Dynamic Index
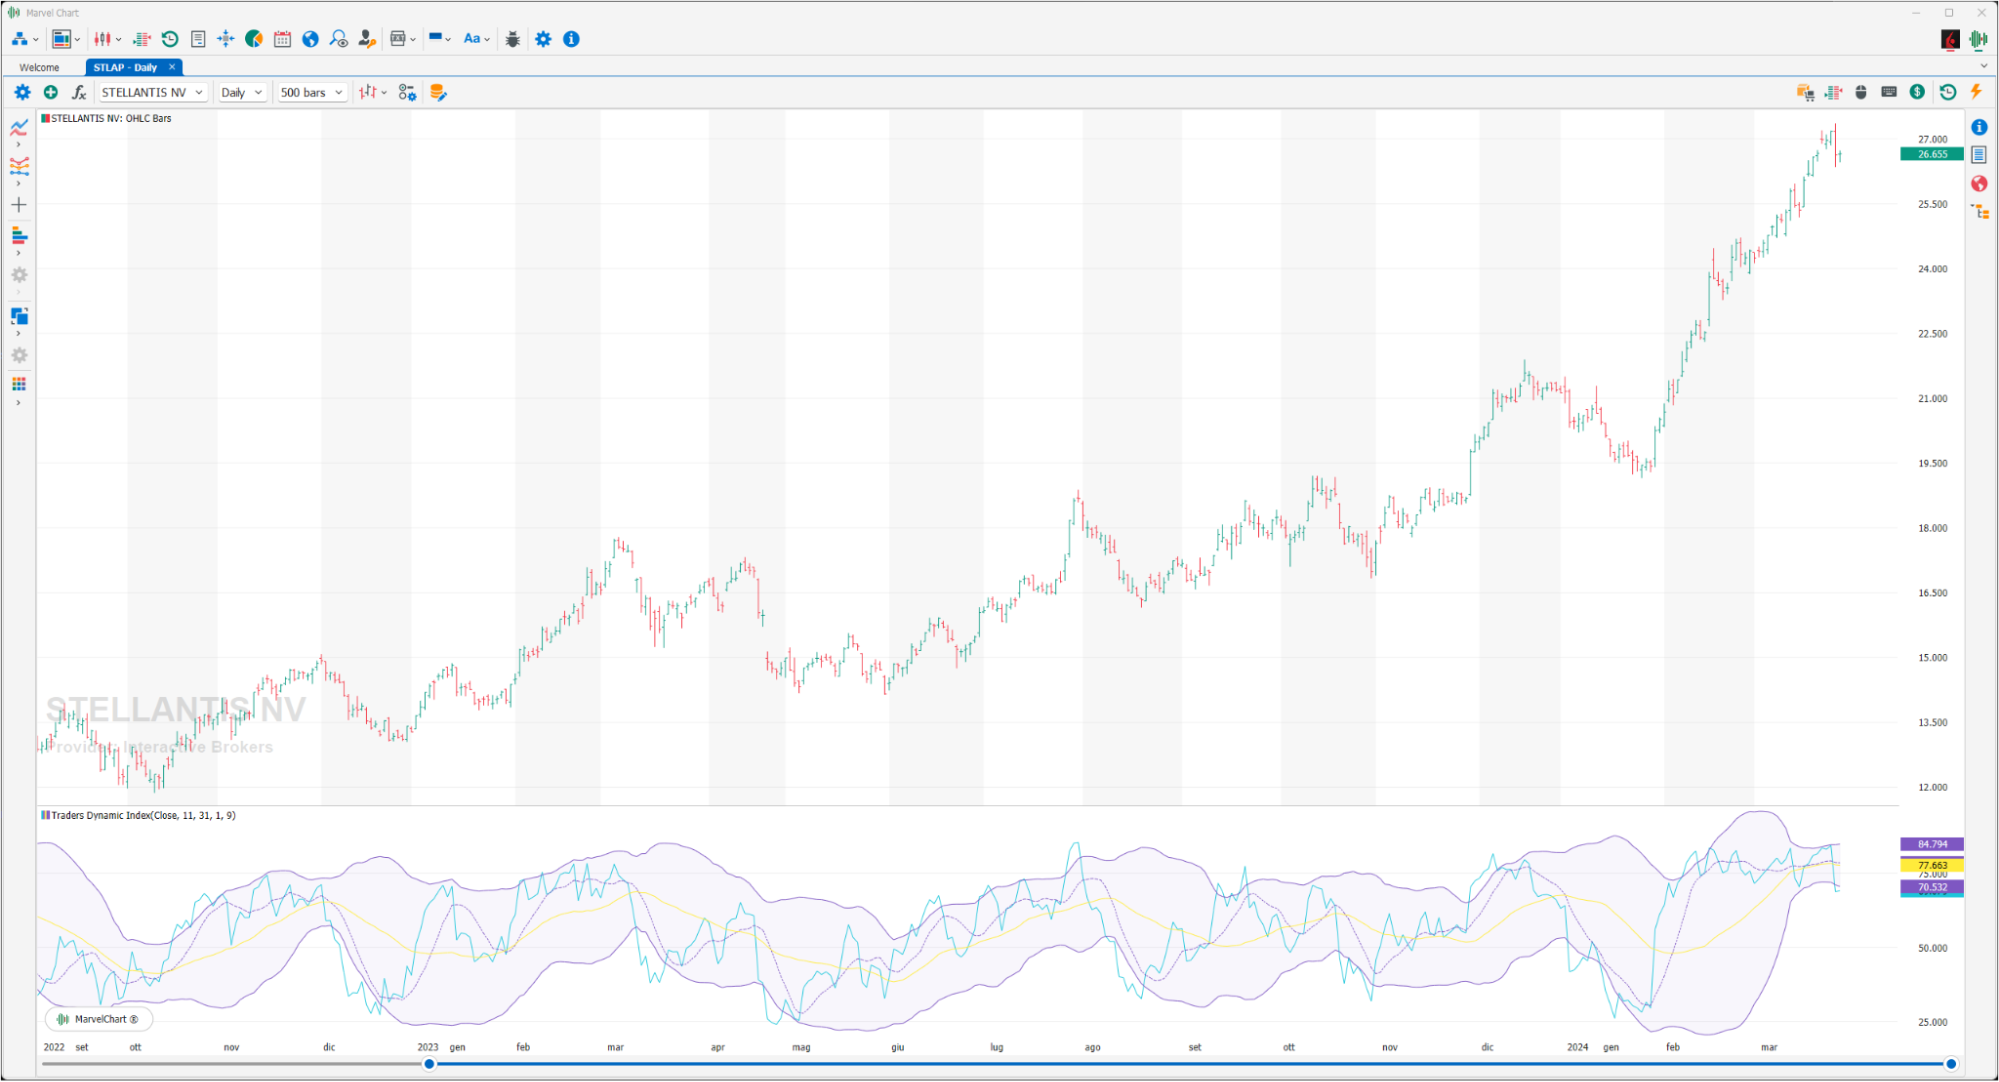
The Traders Dynamic Index (TDI) is a technical analysis indicator used by traders and investors to evaluate market conditions and predict price movements. It combines trend analysis, momentum and elements of volatility to provide a comprehensive view of the market. Developed by Dean Malone, the TDI is a versatile indicator that can be applied to various time frames and market conditions. The TDI is used to identify overbought and oversold conditions in the market. When the price line crosses the upper Bollinger Band, it indicates an overbought condition, indicating a potential reversal or pullback. Conversely, when the price line crosses below the lower Bollinger Band, it suggests an oversold condition and a possible reversal or bounce to the upside. The TDI can also be used to confirm the current trend direction. When the indicator line is above the signal line, it suggests that the market is in an uptrend. Conversely, if the indicator line is below the market signal line, it indicates a downtrend.
Vertical Horizontal Filter
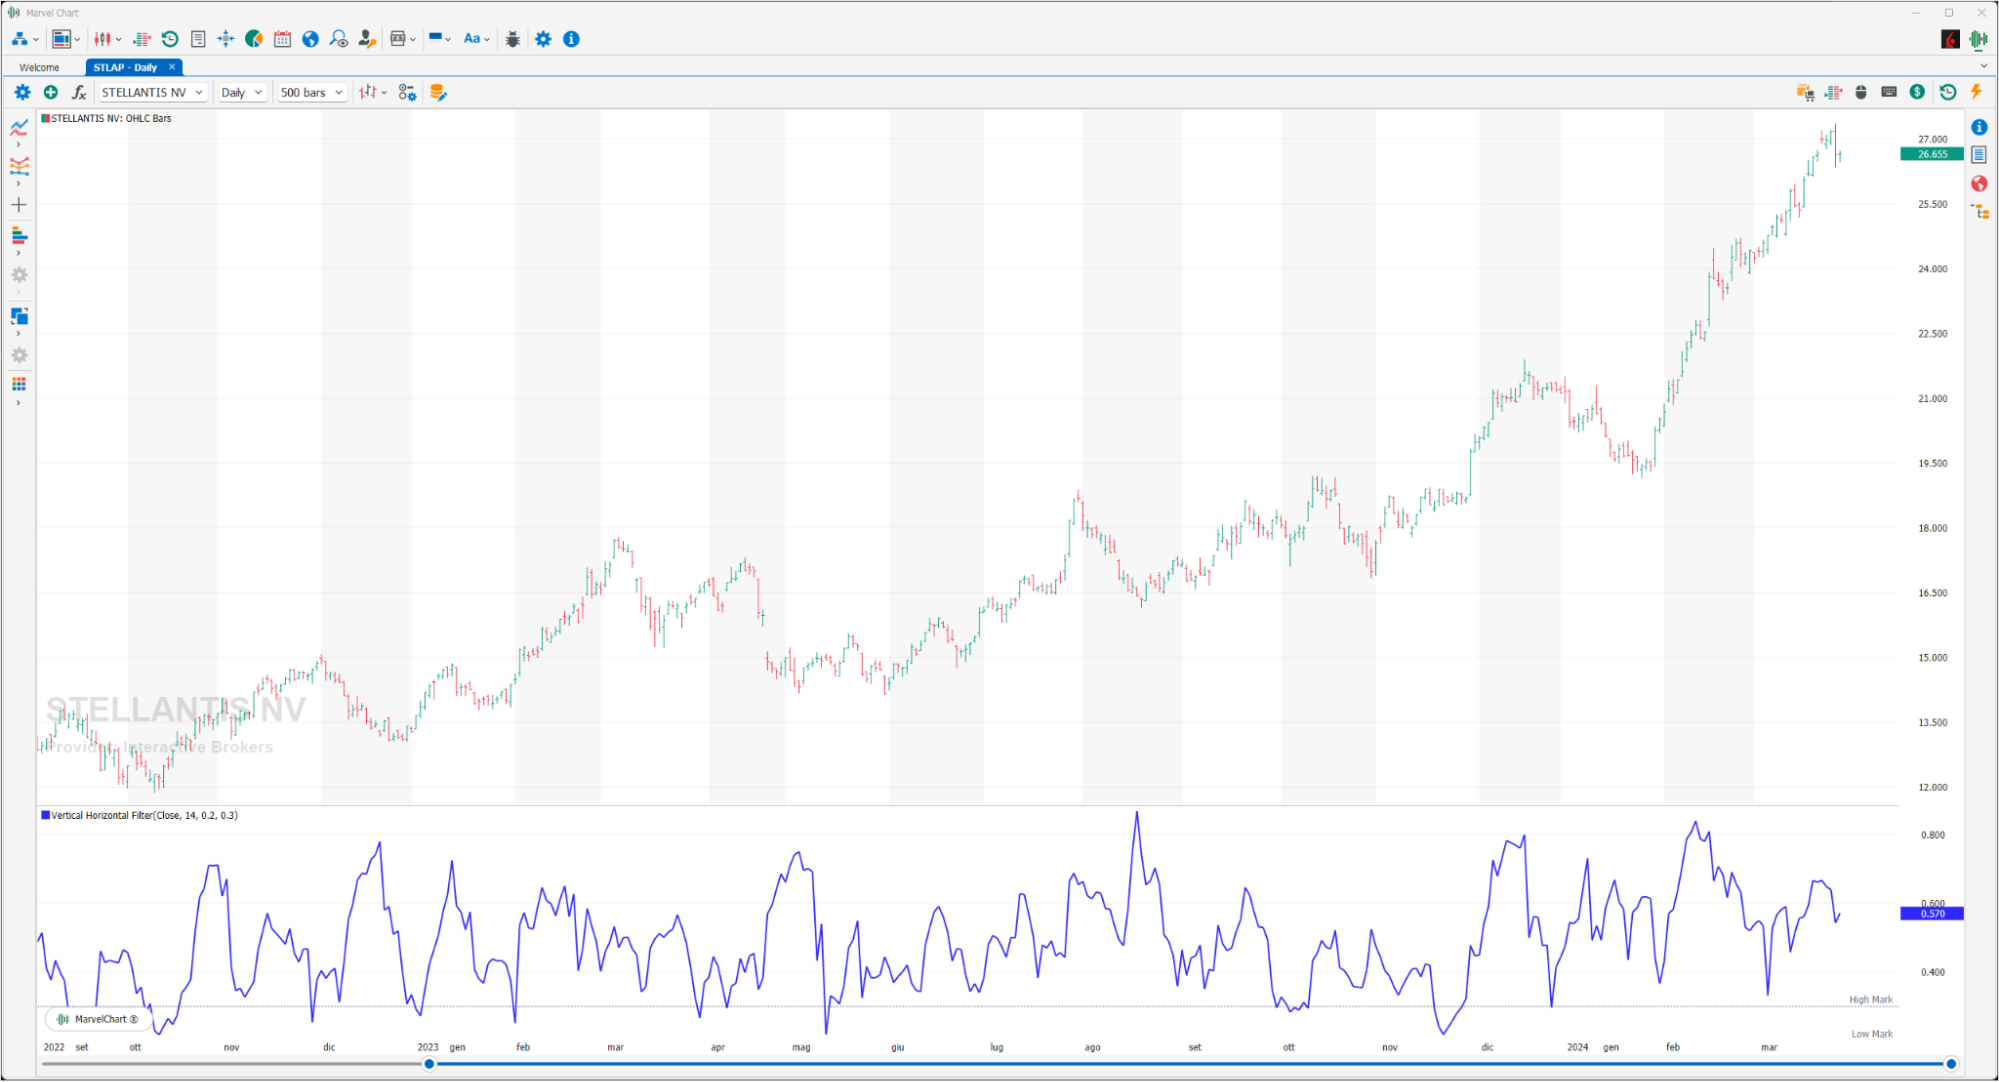
The Vertical Horizontal Filter (VHF) is an indicator created by Adam White to identify trends and congested phases of the market. The calculation involves the interaction of the CLOSE, HIGH and LOW prices reached in a period of 28 periods; to be precise, the VHF arises from the relationship between the absolute value of the difference between HIGH and LOW recorded by the period in question, and the sum of the absolute values of the differences between consecutive CLOSE prices of the period considered. The interpretative theory states that a significantly higher VHF confirms the market trend, while a bearish VHF heralds the beginning of a congested phase. Furthermore, the tracing of new highs heralds a phase of congestion, while new lows confirm the hypothesis of exit from congestion and the beginning of a trend phase (be it bullish or bearish).
Vortex Index
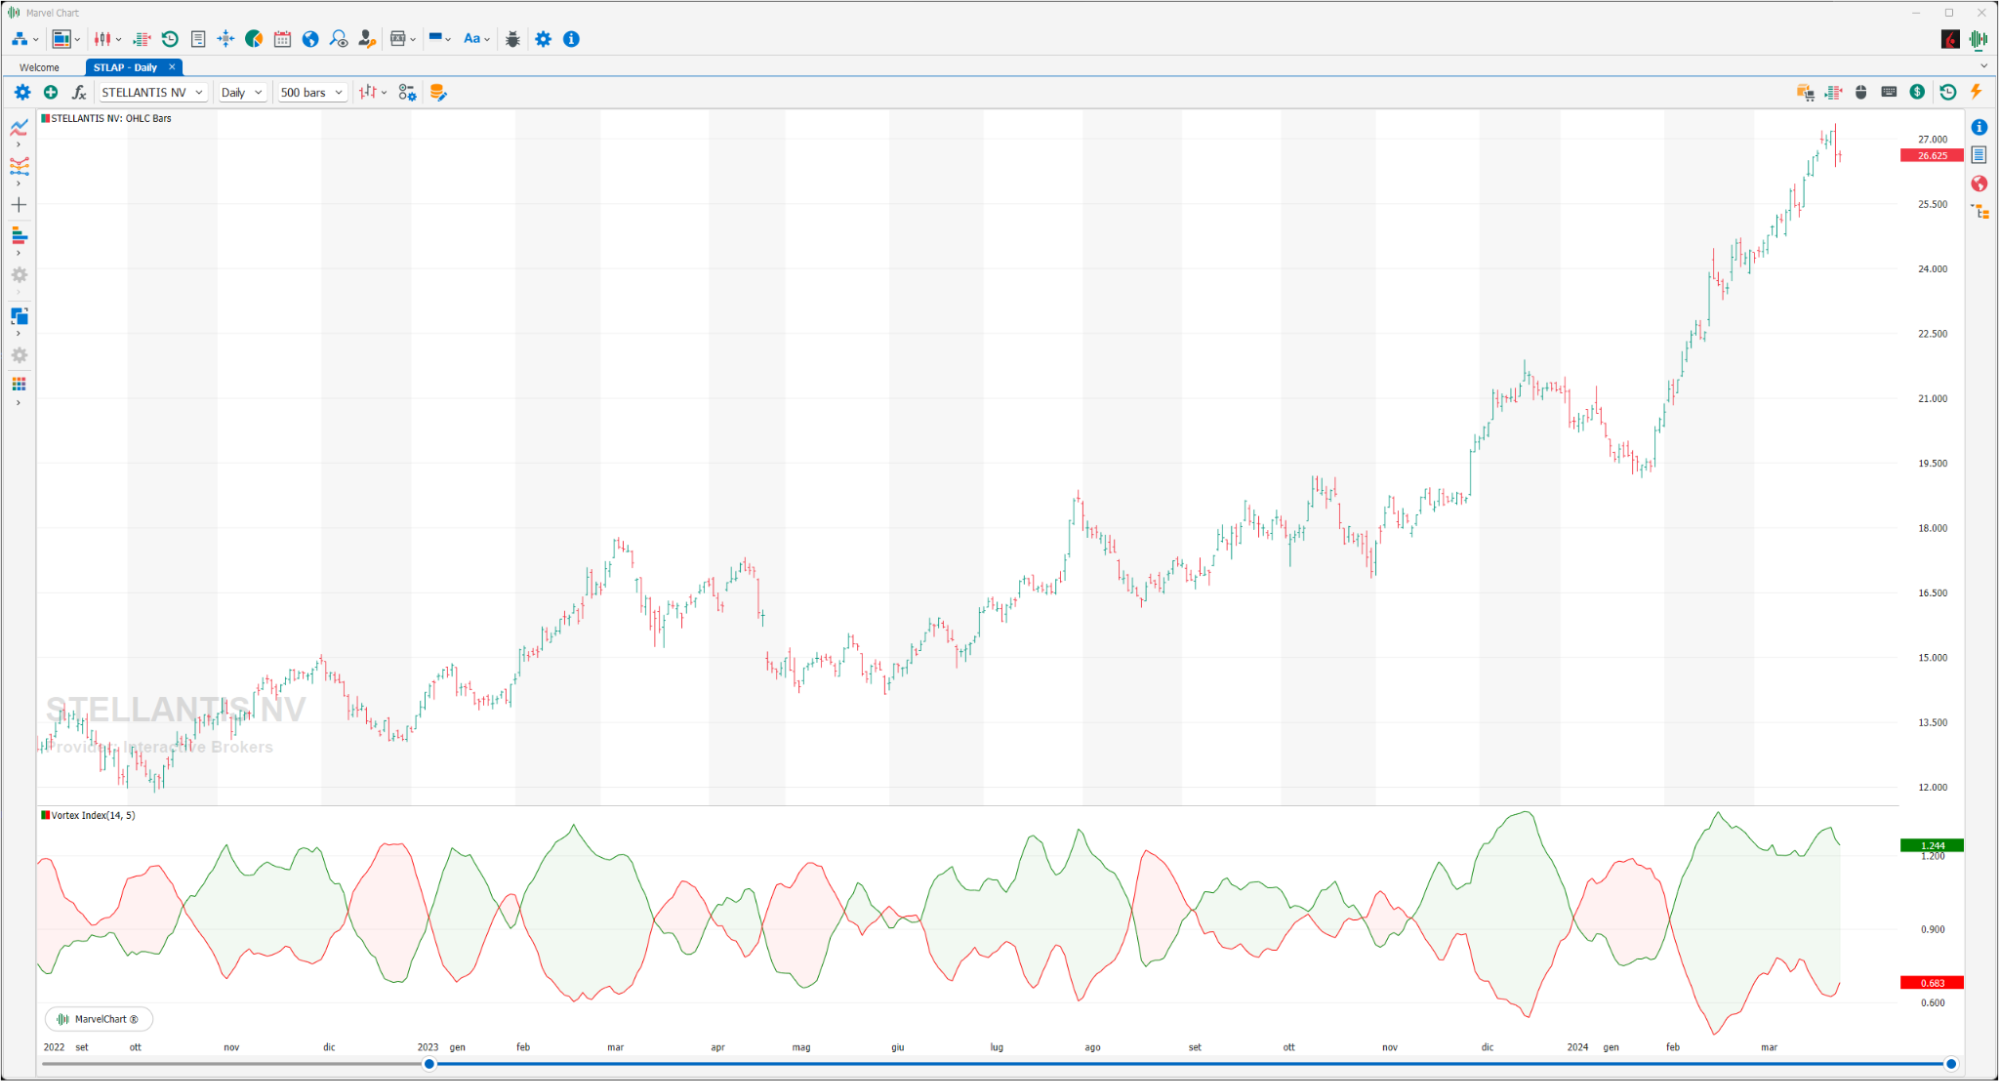
Developed by Etienne Botes and Douglas Siepman, the Vortex indicator consists of two oscillators that capture positive and negative trends. Although the formula is quite complex, the indicator is quite simple to understand and easy to interpret. There is a bullish signal when the positive trend indicator exceeds the negative trend indicator. Conversely, there is a bearish signal when the negative trend indicator crosses the positive trend indicator.
Woodies CCI
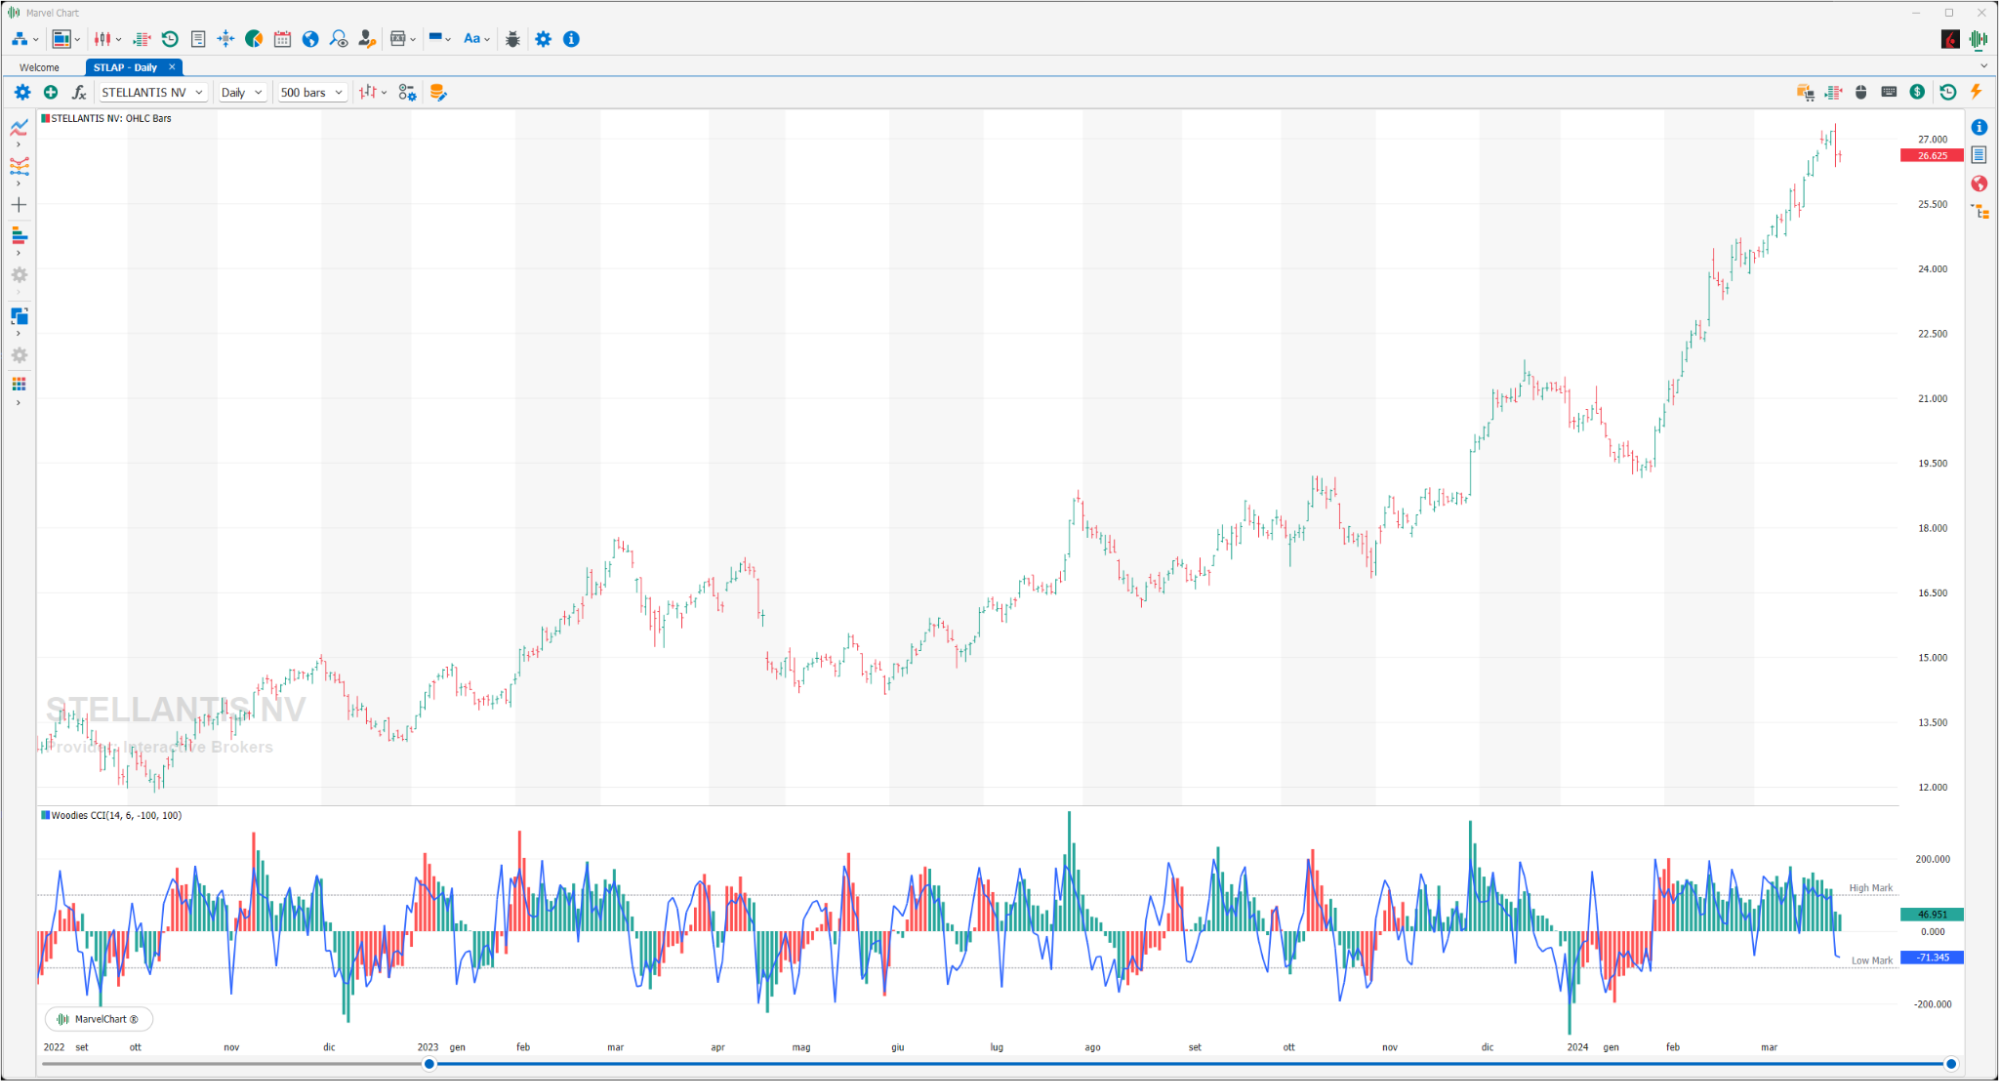
The Woodies Commodity Channel Index (CCI) indicator is a modification of the original CCI indicator used by traders to help determine turning points. The Woodies CCI indicator consists of two CCIs set with periods of 6 and 14, one is a fast curve used to track and predict the movement of the slower CCI, the other is a slow curve. A histogram expressed in various colors is also used to plot the results of the slow CCI. The Woodies CCI indicator reveals various patterns that can help traders make informed decisions. Some key patterns include zero line rejection, trend continuation, and divergence. Zero line rejection is a pattern that occurs when the CCI approaches the zero line but reverses direction before crossing it. This pattern often indicates a strong trend continuation and can be a signal to enter or exit a trade in the direction of the trend. Trend continuation patterns occur when the Woodies CCI stays above or below the zero line for an extended period of time, indicating a strong uptrend or downtrend. Traders can use this information to determine the direction of the market and identify potential entry or exit points. A divergence is a pattern in which a security's price and the Woodies CCI move in opposite directions. This can be a bullish or bearish signal, depending on whether the divergence is positive or negative. Positive divergence occurs when the price makes a lower low while the CCI makes a higher low, which can signal a potential trend reversal to the upside. A negative divergence occurs when the price makes a higher high while the CCI makes a lower high, indicating a potential trend reversal to the downside.