Performance Report
The Performance Report function allows you to analyze in detail the behavior of a Trading System applied to a series of historical data. The Performance Report is composed of several sub-sections, which can be activated via the buttons on the command bar:
Charts - Graphs of the trading system results;
Summary - Summary of results;
Trades - List of trades executed and the orders that compose them;
Win / Loss - Analysis of sequences of profitable and non-profitable trades;
Yearly - Analysis of results grouped by year;
Quarterly - Analysis of results grouped by quarter;
Monthly - Analysis of results grouped by month;
Weekly - Analysis of results grouped by week;
Daily - Analysis of results grouped by day;
Analysis - Analysis on Equity, efficiency and duration of trades;
Export - Export data to a file compatible with Microsoft Excel ®.
Charts

In the Charts tab, various parameters of the trading system can be displayed in the form of graphs. The upper part of the tab includes a command bar with the following items:
Chart Type - Drop-down box to change the type of chart displayed;
Show Data - Switches to the tab relating to the data of the chart currently displayed;
Show chart description - On/Off button, when active, a short description of the chart currently displayed is shown at the bottom of the tab;
Entry Efficiency
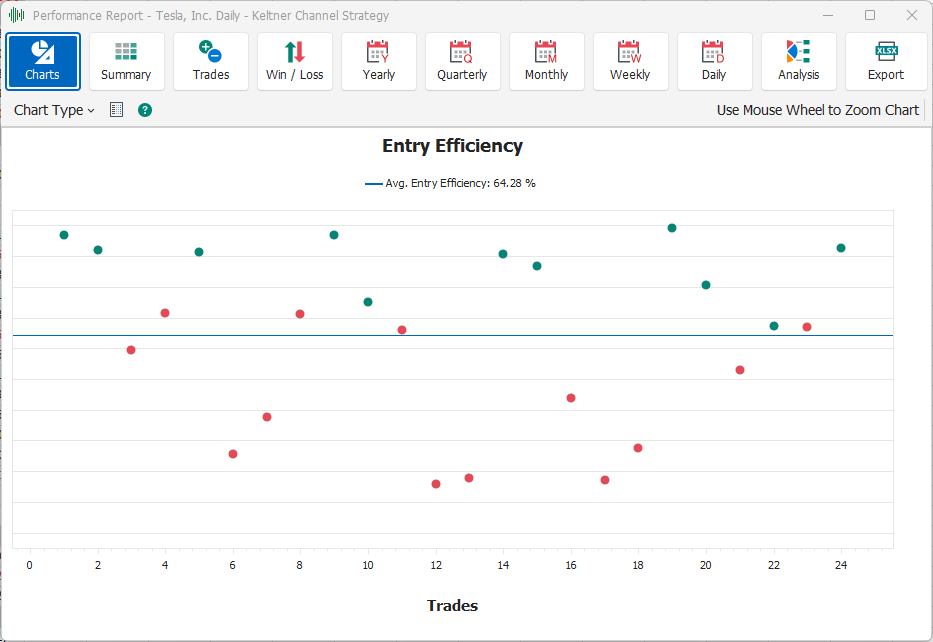
For each trade executed in the trading system, a dot is shown, green if the trade ended with a Profit, red if the trade ended with a Loss. Each dot has the trade number as its X coordinate, while the Y coordinate represents the Entry Efficiency of the trade. Entry Efficiency shows how close the entry price was to the best possible entry price for each trade during the strategy testing period. Entry Efficiency is calculated as a percentage of the entry price compared to the price range determined by the Highest High and the Lowest Low in the time period between the entry order and the trade closing order. The graph also displays a horizontal line that highlights the average Entry Efficiency of all trades, and its value is also shown in the legend at the top of the graph.
Exit Efficiency
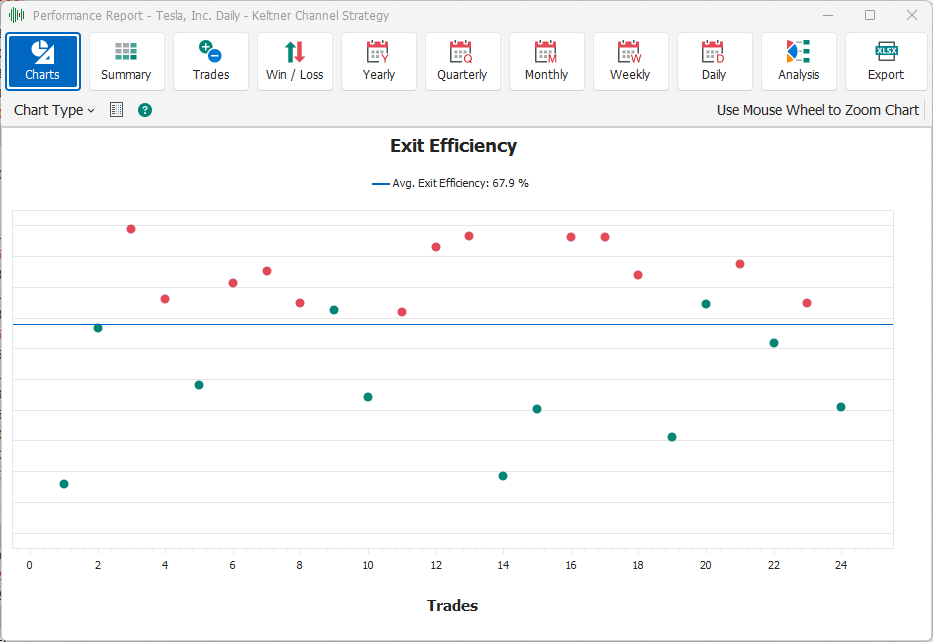
For each trade executed in the trading system, a dot is shown, green if the trade ended with a Profit, red if the trade ended with a Loss. Each dot has the trade number as its X coordinate, while the Y coordinate represents the Exit Efficiency of the trade. The Exit Efficiency shows how close the exit price was to the best possible exit price for each trade during the strategy testing period. The Exit Efficiency is calculated as a percentage of the closing price of the trade compared to the range of prices determined by the Highest High and the Lowest Low in the period of time between the entry order and the closing order of the trade. The graph also displays a horizontal line that highlights the average Exit Efficiency of all trades, and its value is also shown in the legend at the top of the graph.
Total Efficiency
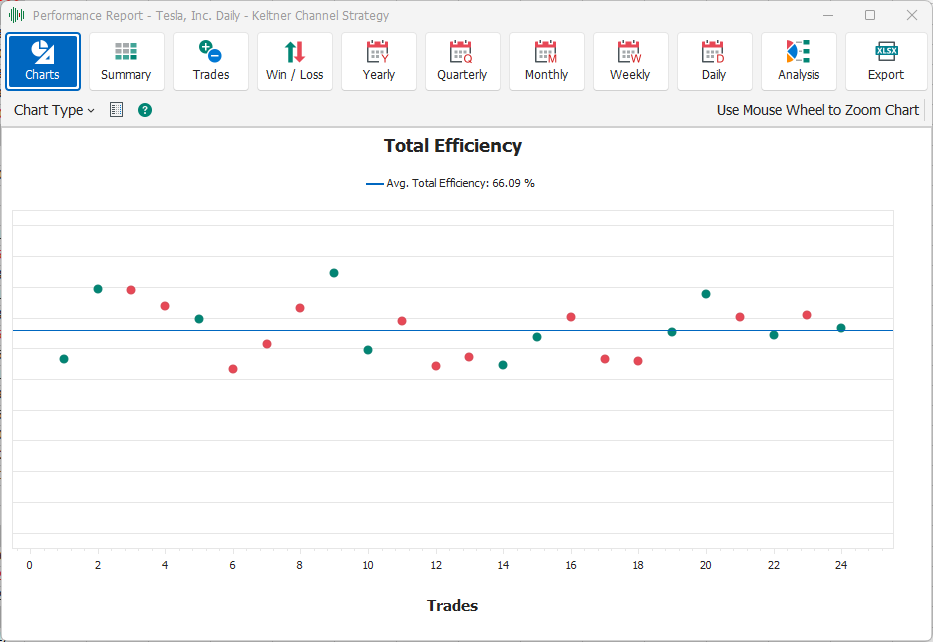
For each trade executed in the trading system, a dot is shown, green if the trade ended with a Profit, red if the trade ended with a Loss. Each dot has the trade number as its X coordinate, while the Y coordinate represents the Total Efficiency of the trade. The Total Efficiency is calculated as the average between the Entry Efficiency and the Exit Efficiency of the trade. The graph also displays a horizontal line that highlights the average Total Efficiency of all trades, and its value is also shown in the legend at the top of the graph.
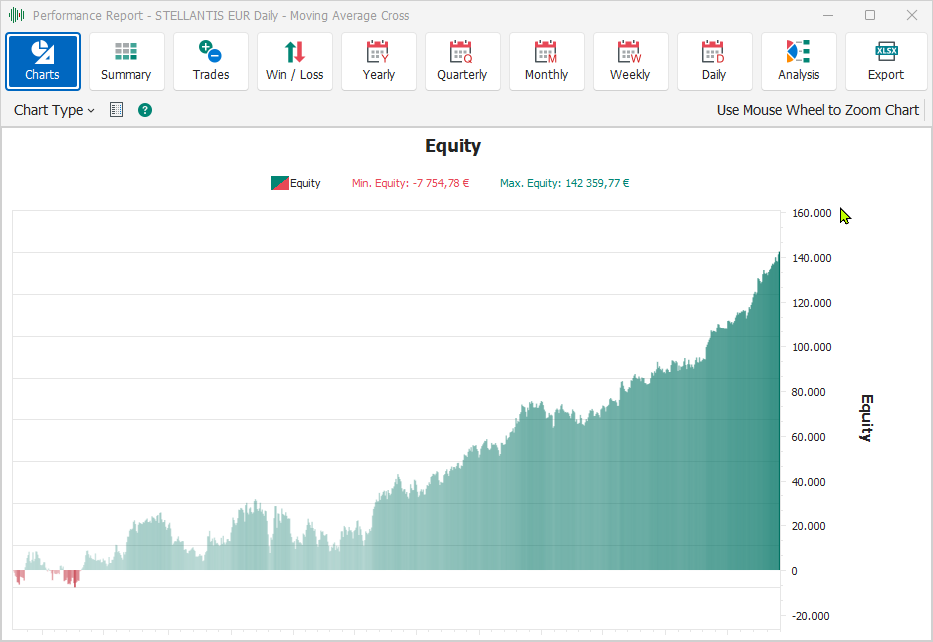
Equity

This chart shows the Equity trend of the trading system over time. Equity is calculated as the total progressive Profit/Loss obtained by the trading system. The chart is drawn as a set of bars, green for positive Equity values, red for negative Equity values. The coloring of the bars is more intense for higher values, and weaker for values closer to zero. The absolute maximum and minimum values are highlighted by two labels on the chart.
Equity and Draw-Down
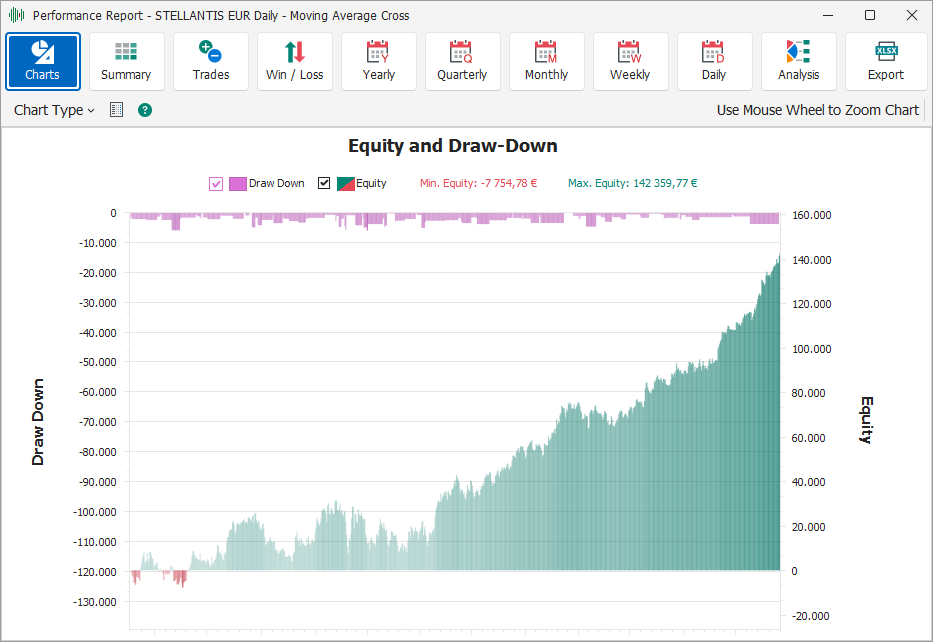
This chart shows the Equity and Draw-Down trend over time of the trading system. Equity is calculated as the total progressive Profit/Loss obtained by the trading system. The chart is drawn as a set of bars, green for positive Equity values, red for negative Equity values. The coloring of the bars is more intense for higher values, and weaker for values closer to zero. The absolute maximum and minimum values are highlighted under the title as a legend of the chart. In the chart there is a second series of bars, colored purple, which represents the Draw-Down sustained by the Open Position. The Draw-Down is always a negative value and indicates the maximum potential loss that the Open Position has sustained over time, the more negative the value, the worse the performance of the trades, while values close to zero indicate trades with good efficiency.
Draw-Down
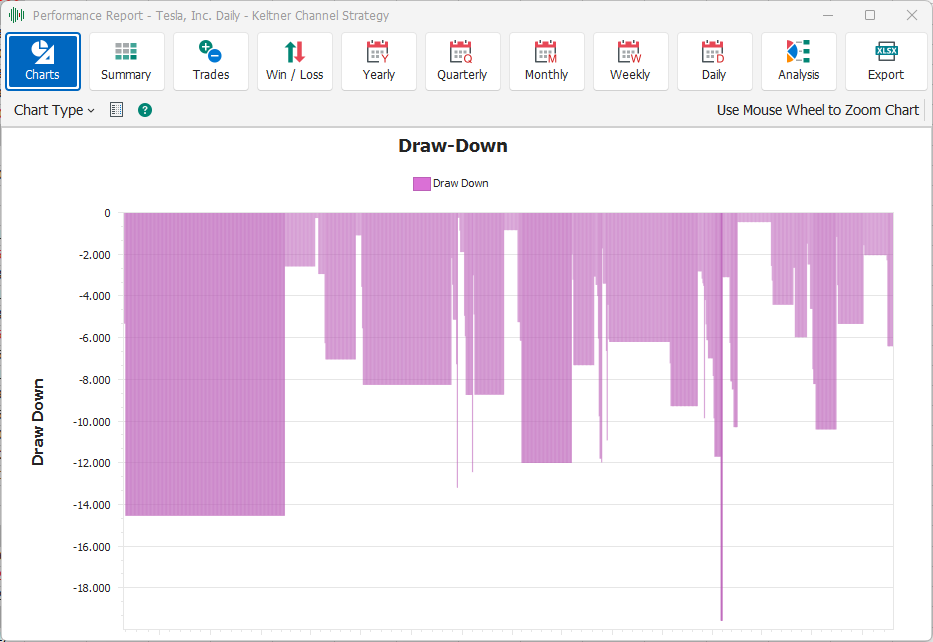
This graph shows the trend of the Draw-Down of the trading system over time. The Draw-Down is always a negative value and indicates the maximum potential loss that the Open Position has sustained over time, the more negative the value, the worse the performance of the trades, while values close to zero indicate trades with good efficiency. The Draw-Down is represented by a series of purple bars, whose color becomes more intense as the Draw-Down value deviates from zero.
Orders Statistics
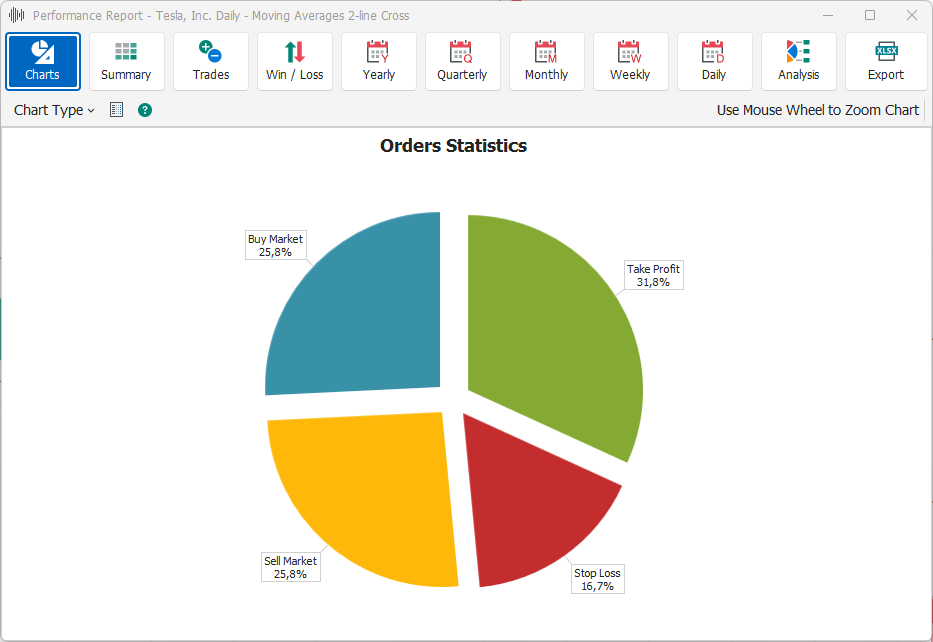
This pie chart shows the distribution of the type of trades executed by the trading system. It can be useful especially in the case of trading systems that include the use of Take-Profit and Stop-Loss orders, to identify whether the settings for these exit orders are more or less correct: a high percentage of Stop-Loss compared to a low percentage of Take-Profit can indicate that the exit orders are not set in the optimal way, on the contrary a high percentage of Take-Profit compared to a low percentage of Stop-Loss can indicate that the exit orders are set correctly.
Trades Profit/Loss
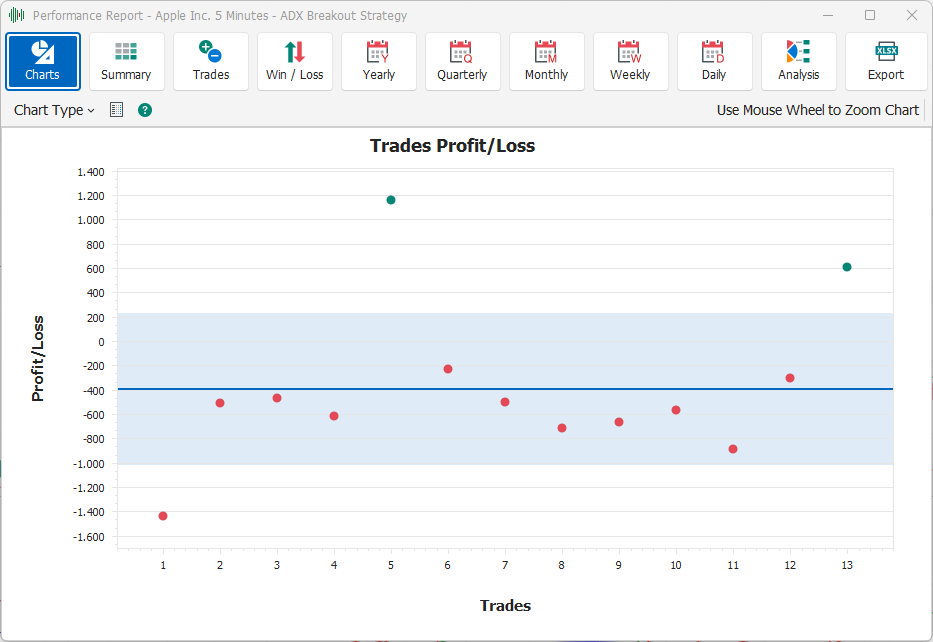
The Trades Profit/Loss chart displays a dot for each trade executed by the trading system indicating its Profit/Loss. A profitable trade is indicated by a green dot, while an unfavorable trade is indicated by a red dot. The chart also features a horizontal band that shows the average Profit/Loss +/- 1 standard deviation.
Daily - Weekly - Monthly - Quarterly - Yearly Profit/Loss
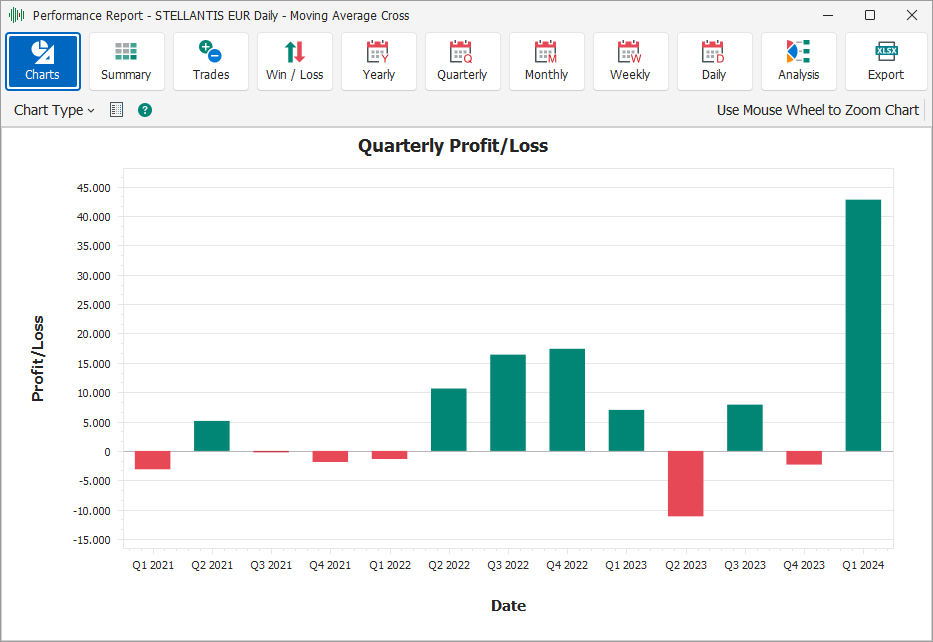
Daily - Weekly - Monthly - Quarterly - Yearly Profit/Loss charts show the Profit/Loss made by trades in different time periods as histograms. A positive and green bar indicates a profit for the reference period, while a negative and red bar indicates a loss for the reference period.
Run-Up and Draw-Down
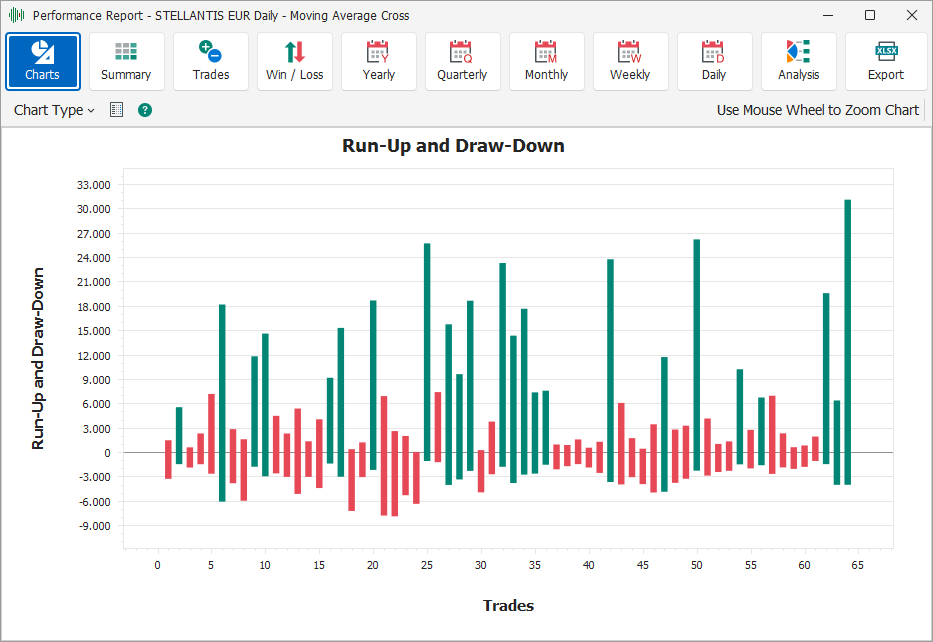
The Run-Up and Draw-Down chart displays two distinct values for each trade as a histogram. The upper value of each bar represents the Run-Up of the corresponding trade, while the lower value represents the Draw-Down of the trade. The Run-Up is the maximum potential profit generated by the trade, while the Draw-Down is the maximum potential loss generated by the trade. The bars in this chart are colored green if the trade ended in a profit, red if it ended in a loss.
Run-Up and Profit/Loss
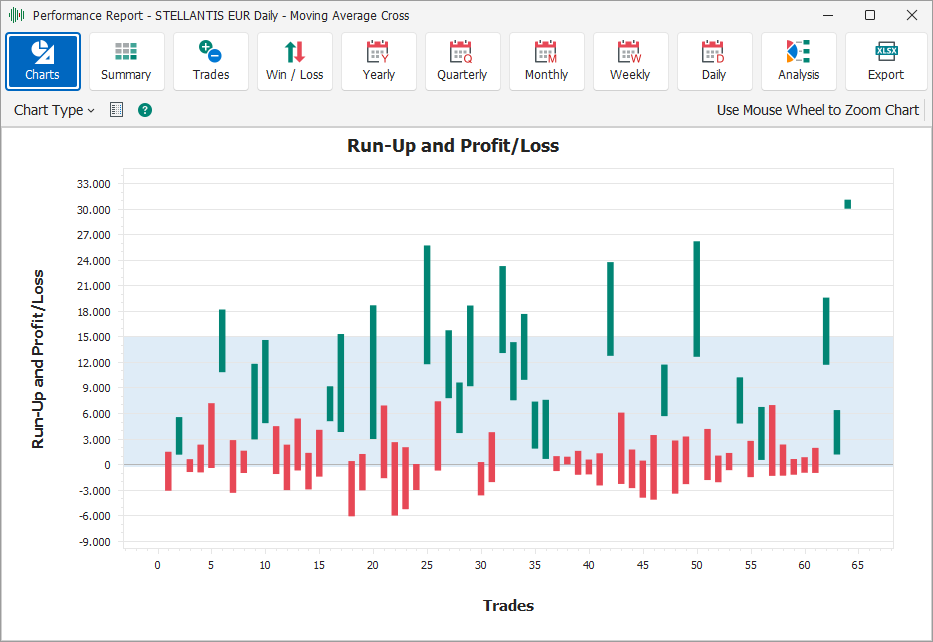
The Run-Up and Profit/Loss chart displays two distinct values for each trade as a histogram. The upper value of each bar represents the Run-Up of the corresponding trade, while the lower value represents the Profit/Loss of the trade. The Run-Up is the maximum potential profit generated by the trade. The bars are colored green if the trade ended in a profit, red if it ended in a loss. The chart also features a horizontal band that shows the average Run-Up +/- 1 standard deviation.
Draw-Down and Profit/Loss
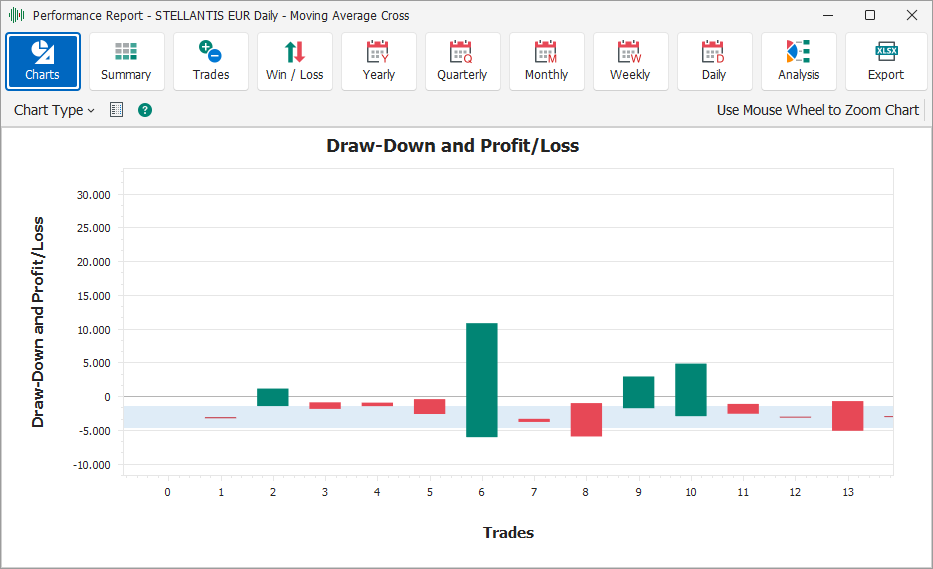
The Draw-Down and Profit/Loss chart displays two distinct values for each trade as a histogram. The upper value of each bar represents the Profit/Loss of the corresponding trade, while the lower value represents the Draw-Down of the trade. The Draw-Down is the maximum potential loss generated by the trade. The bars are colored green if the trade ended in a profit, red if it ended in a loss. The chart also features a horizontal band that shows the average Draw-Down +/- 1 standard deviation.
Summary
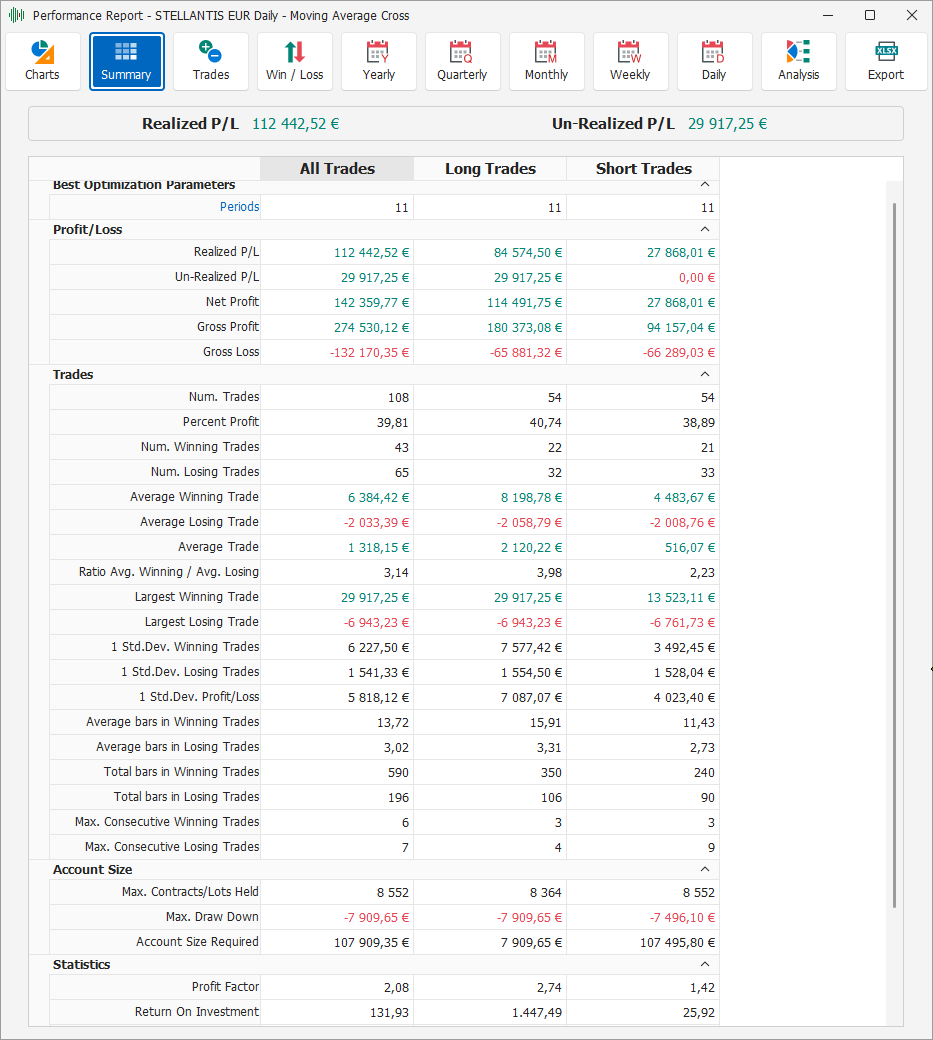
The Summary tab displays a summary of the overall results of the trading system, highlighting in particular the values of Profit/Loss realized and unrealized, the latter resulting from any Open Position still in existence. The overall results are separated into three columns:
All Trades - Shows the results for all types of trades, both Long and Short;
Long Trades - Shows the results of all and only Long trades;
Short Trades - Shows the results of all and only Short trades.
For each type of trade, numerous results are displayed, grouped in turn into distinct categories:
Best Optimization Parameters
This section is visible only the Backtest to which this Performance Report refers has been optimized. For each Input parameter of the trading system to which the optimization has been applied, a line will be presented, indicating the name of the parameter and the value that led to the best optimized result;
Profit/Loss
Realized P/L - Realized Profit/Loss;
Un-Realized P/L - Unrealized Profit/Loss resulting from any Open Position still in existence;
Net Profit - Net Profit, equal to the sum of Realized P/L and Un-Realized P/L;
Gross Profit - Sum of Profits of profitable trades only;
Gross Loss - Sum of Losses of disadvantageous trades only;
Trades
Num. Trades - Number of trades executed;
Percent Profit - Percentage of profitable trades;
Num. Winning Trades - Number of profitable trades;
Num. Losing Trades - Number of unprofitable trades;
Average Winning Trade - Average Profit of profitable trades;
Average Losing Trade - Average Loss of unprofitable trades;
Average Trade - Average Profit/Loss of all trades, profitable and not;
Ratio Avg. Winning / Avg. Losing - Ratio between Average Winning Trade and Average Losing Trade;
Largest Winning Trade - Maximum among the Profits of profitable trades;
Largest Losing Trade - Maximum among the Losses of unprofitable trades;
1 Std. Dev. Winning Trade - Standard Deviation of the Profits of profitable trades, i.e. distance from the relative mean;
1 Std. Dev. Losing Trade - Standard Deviation of the Losses of unprofitable trades, i.e. distance from the relative mean;
1 Std. Dev. Profit/Loss - Standard deviation of the Profit/Loss of trades, both profitable and unprofitable, i.e. distance from the relative mean;
Average bars in Winning Trades - Average duration of profitable trades, expressed as number of historical bars;
Average bars in Losing Trades - Average duration of disadvantageous trades, expressed as number of historical bars;
Total bars in Winning Trades - Total duration of profitable trades, expressed as number of historical bars;
Total bars in Losing Trades - Total duration of disadvantageous trades, expressed as number of historical bars;
Max. Consecutive Winning Trades - Maximum number of consecutive profitable trades;
Max. Consecutive Losing Trades - Maximum number of consecutive disadvantageous trades;
Account Size
Max. Contracts/Lots Held - Maximum number of shares/contracts/lots held;
Max. Draw-Down
Maximum Draw-Down, i.e. maximum potential loss of trades;
Account Size Required - Amount needed to execute the trading system, such as to support the Max. Draw-Down but at the same time have sufficient liquidity to completely execute the new trades;
Statistics
Profit Factor - Statistical value equal to the ratio between Gross Profit and Gross Loss;
Return On Investment - Statistical value equal to the ratio between Net Profit and Account Size Required, expressed as a percentage;
Kelly Bet Fraction (K%) - The Kelly criterion (also known as Kelly strategy or Kelly Bet) is the result of a formula useful for sizing the amount to invest in the trading system;
Sharpe Ratio - Statistical value that measures the Extra-Return compared to the Risk-Free Rate. The higher the index, the greater the return for that period achieved with a lower risk.
Sortino Ratio - Statistical value, similar to the Sharpe Ratio, which measures the Extra-Returns compared to the Risk-Free Rate; The higher the Sortino ratio, the better. Values above 0.5 maintained over sufficiently long time periods are considered good in the financial industry.
Time
Time From Start - Time elapsed between the opening of the first trade and the closing of the last.
Trades
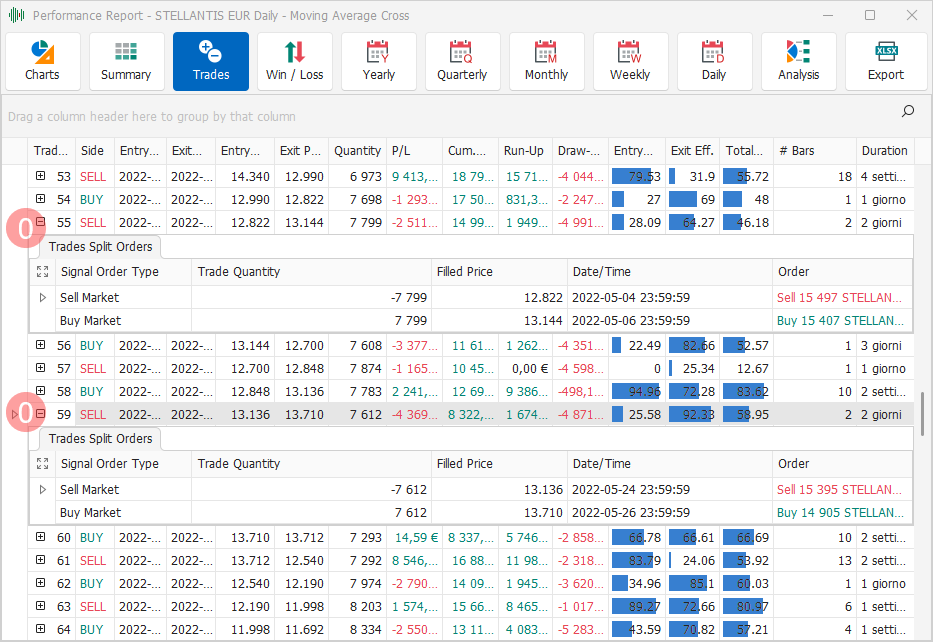
This tab displays the details of the individual trades executed by the trading system. It is represented as a list of trades and for each trade the following parameters are displayed:
Trade # - Progressive number of the trade;
Side - Direction of the trade;
Entry Date/Time - Date/time of opening of the trade;
Exit Date/Time - Date/time of closing of the trade;
Entry Price - Opening price of the trade;
Exit Price - Closing price of the trade;
Quantity - Opening quantity;
P/L - Profit/Loss realized by the trade;
Cum. P/L - Cumulative Profit/Loss of the trades;
Run-Up - Maximum potential profit of the trade;
Draw-Down - Maximum potential loss of the trade;
Entry Eff. - Entry Efficiency, in percentage, also displayed as a histogram;
Exit Eff. - Exit Efficiency, in percentage, also displayed as a histogram;
Total Eff. - Total Efficiency, in percentage, also displayed as a histogram;
Bars - Duration of the trade, in number of historical bars;
Duration - Duration of the trade.
For each of the trades it is also possible to view by clicking on the split orders icon 0, the list of orders that compose it, with the following parameters:
Signal Order Type - Type of signal that generated the order;
Trade Quantity - Quantity executed in the trade;
Filled Price - Average executed price of the order;
Date/Time - Date/time of execution of the order;
Order - Description of the order.
A single order may appear in multiple separate trades if it constitutes a Stop-And-Reverse order.
Win / Loss
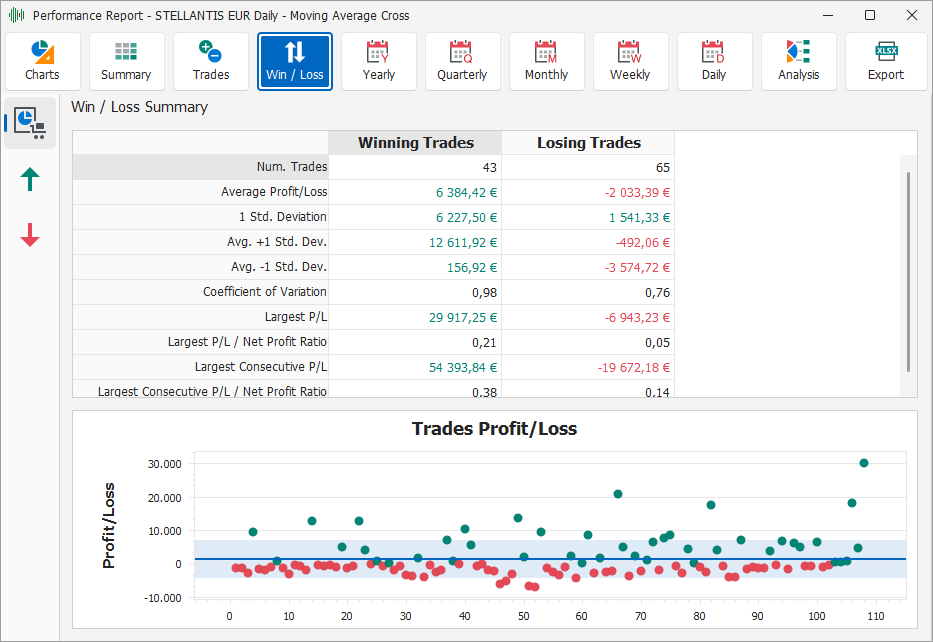
This tab displays the results of trades, distinguishing them between profitable and disadvantageous. It consists of three sub-tabs:
Win / Loss Summary

This view presents the summary of the results of profitable and disadvantageous trades. In the upper part of the view there is a table that groups the results into two distinct columns, one relating to profitable trades and one relating to disadvantageous trades. In the lower part there is a Trades Profit/Loss type graph. In the results table there are the following items:
Num. Trades - Number of trades;
Average Profit/Loss - Average Profit/Loss;
1 Std. Deviation - Standard Deviation of the Profit/Loss, i.e. distance from the relative average;
Avg. +1 Std. Dev. - Value equal to the sum of Average Profit/Loss and 1 Std. Deviation;
Avg. -1 Std. Dev. - Value equal to the difference between Average Profit/Loss and 1 Std. Deviation;
Coefficient of Variation - Coefficient of variation of the Standard Deviation of the Profit/Loss of trades;
Largest P/L - Maximum Profit/Loss;
Largest P/L / Net Profit Ratio - Ratio between Largest P/L and Net Profit;
Largest Consecutive P/L - Maximum cumulative Profit/Loss obtained from a sequence of consecutive trades of the same type, profitable or disadvantageous;
Largest Consecutive P/L / Net Profit Ratio - Ratio between Largest Consecutive P/L and Net Profit.
Winning Streaks
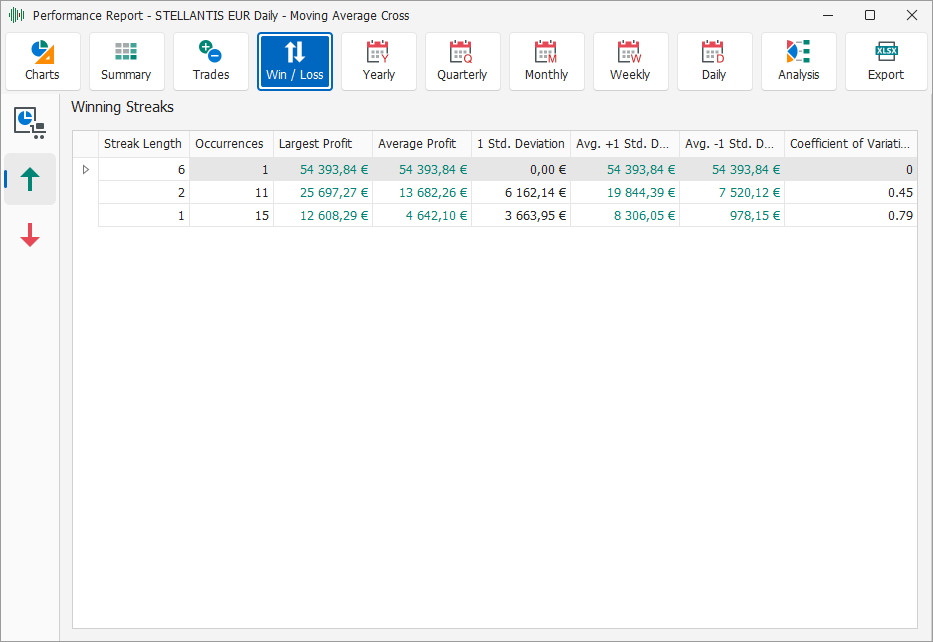
This view shows data about sequences of consecutive profitable trades. The data is presented in table form, sorted from the longest sequence to the shortest sequence. The available parameters are:
Streak Length - Length of the sequence, i.e. number of consecutive profitable trades;
Occurrences - Number of times a sequence of length equal to Streak Length occurred in the trades of the trading system;
Largest Profit - Maximum cumulative Profit obtained among all occurrences;
Average Profit - Average Profit of the occurrences;
1 Std. Deviation - Standard Deviation of the Profit of the occurrences, i.e. distance from the relative mean;
Avg. +1 Std. Dev. - Value equal to the sum of Average Profit and 1 Std. Deviation;
Avg. -1 Std. Dev. - Value equal to the difference between Average Profit and 1 Std. Deviation;
Coefficient of Variation - Coefficient of Variation of the Standard Deviation of the Profit of the occurrences.
Losing Streaks
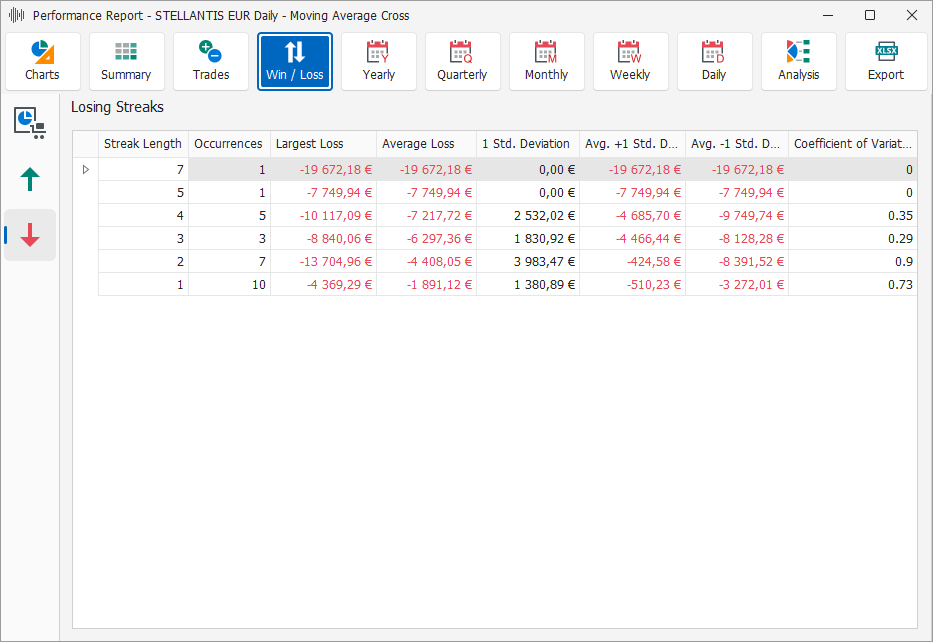
This view shows data related to sequences of consecutive losing trades. The data is presented in table form, sorted from the longest sequence to the shortest sequence. The available parameters are:
Streak Length - Length of the sequence, i.e. number of consecutive losing trades;
Occurrences - Number of times a sequence of length equal to Streak Length occurred in the trades of the trading system;
Largest Loss - Maximum cumulative Loss obtained among all occurrences;
Average Loss - Average Loss of occurrences;
1 Std. Deviation - Standard Deviation of the Loss of occurrences, i.e. distance from the relative mean;
Avg. +1 Std. Dev. - Value equal to the sum of Average Loss and 1 Std. Deviation;
Avg. -1 Std. Dev. - Value equal to the difference between Average Loss and 1 Std. Deviation;
Coefficient of Variation - Coefficient of Variation of the Standard Deviation of the Loss of occurrences.
Yearly / Quarterly / Monthly / Weekly / Daily
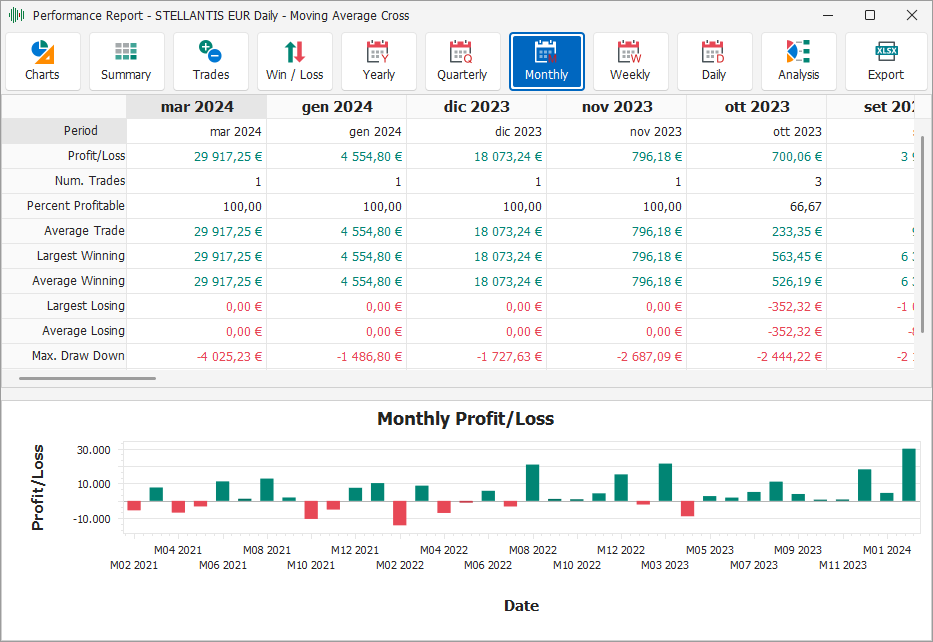
These views show the results of the trades grouping them by time periods, respectively Yearly, Quarterly, Monthly, Weekly and Daily. The data presented by all these views are similar, the only difference is the time interval with which the data is grouped. These tabs have two sections, at the top a table with the numerical values, at the bottom a Profit/Loss chart. Both the table and the chart are made up of a series of columns, one for each time period. In the table, for each period, there is the data:
Period - Reference time period;
Profit/Loss - Profit/Loss obtained in the period;
Num. Trades - Number of trades executed in the period;
Percent Profitable - Percentage of profitable trades;
Average Trade - Average Profit/Loss of trades in the period;
Largest Winning - Maximum Profit among the trades of the period;
Average Winning - Average Profit of profitable trades of the period;
Largest Losing - Maximum Loss among the trades of the period;
Average Losing - Average Loss of disadvantageous trades of the period;
Max. Draw-Down - Maximum potential loss of the period;
Profit Factor - Statistical value equal to the ratio between Gross Profit and Gross Loss.
Analysis
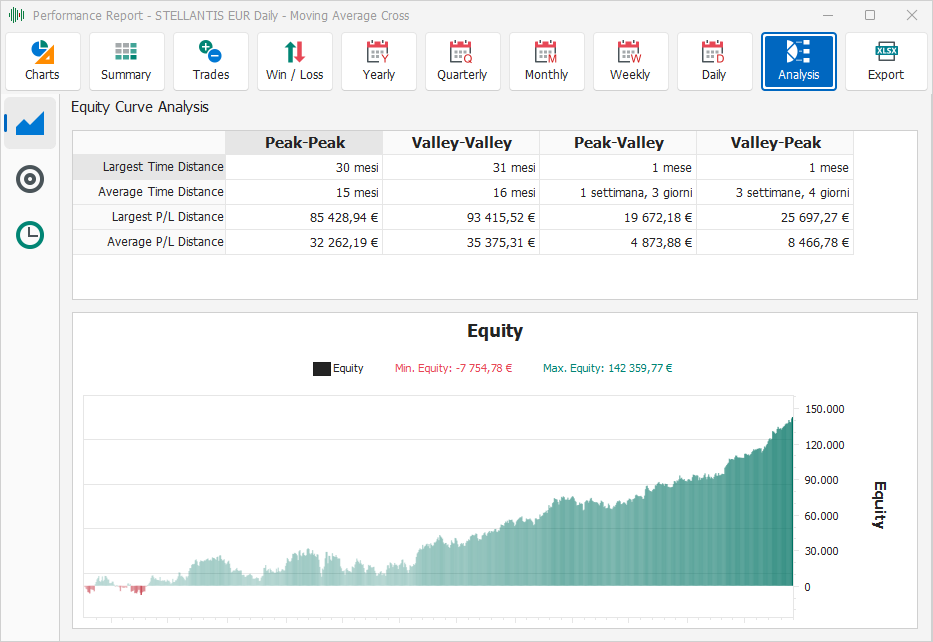
This tab displays the results of the analysis of different characteristics of the trades executed by the trading system. It is made up of several sub-tabs:
Equity Curve Analysis

This 0 view shows the results of the Equity curve analysis performed by the trading system. It is divided into two sections, the upper one contains a table showing the numerical data of the analysis, while the lower one contains an Equity type chart. In the upper table, the analysis groups the results based on the type of points on the Equity curve taken into consideration. The types of points are:
Peak-Peak - Results of the analysis between two consecutive peaks, i.e. relative maximums, of the Equity curve;
Valley-Valley - Results of the analysis between two consecutive valleys, i.e. relative minimums, of the Equity curve;
Peak-Valley - Results of the analysis between a consecutive peak (relative maximum) and a valley (relative minimum) of the Equity curve;
Valley-Peak - Results of the analysis between a consecutive valley (relative minimum) and a peak (relative maximum) of the Equity curve.
For each of these types of points, the following values are displayed:
Largest Time Distance - Maximum temporal distance between the first and the last point in the Equity curve, considering all the occurrences of the specific type of points examined;
Average Time Distance - Average temporal distance between the first and the last point in the Equity curve, considering all the occurrences of the specific type of points examined;
Largest P/L Distance - Maximum difference in the value of the Equity curve between the first and the last point in the Equity curve, considering all the occurrences of the specific type of points considered, in absolute value;
Average P/L Distance - Average difference in the value of the Equity curve between the first and the last point in the Equity curve, considering all the occurrences of the specific type of points considered, in absolute value.
Efficiency Analysis
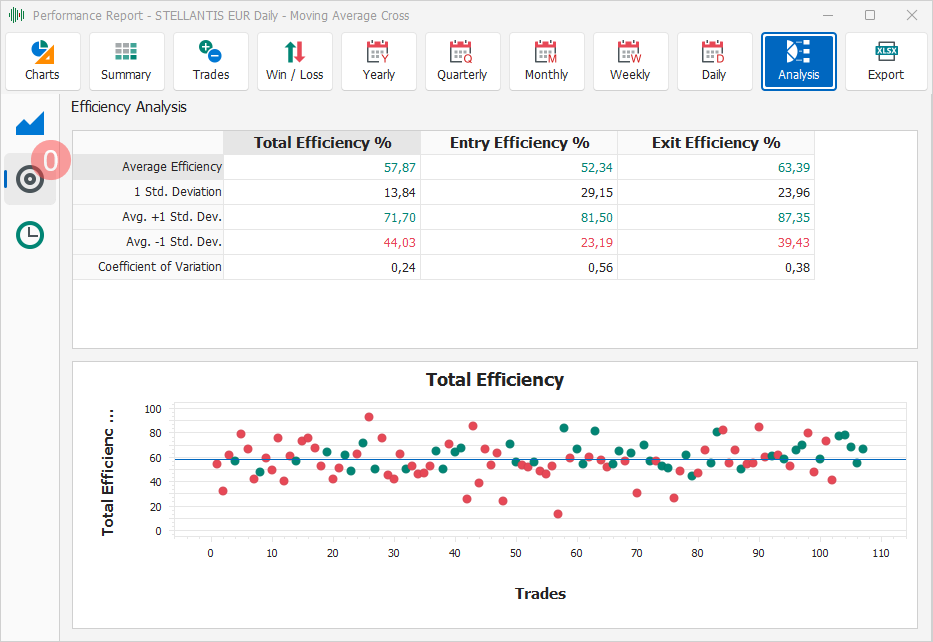
This view 0 shows the efficiency data of the trades executed by the trading system and is divided into two sections, a table with the numerical results of the analysis and a Total Efficiency type chart. The table is made up of three columns, one relating to the Total Efficiency %, one to the Entry Efficiency %, and finally one for the Exit Efficiency %. For each type of efficiency the data shown in the table are:
Average Efficiency - Average efficiency of the trades;
1 Std. Deviation - Standard deviation of the efficiency of the trades, i.e. distance from the relative average;
Avg. +1 Std. Dev. - Value equal to the sum of Average Efficiency and 1 Std. Deviation;
Avg. -1 Std. Dev. - Value equal to the difference between Average Efficiency and 1 Std. Deviation;
Coefficient of Variation - Coefficient of Variation of the Standard Deviation of the efficiency of trades.
Time Analysis
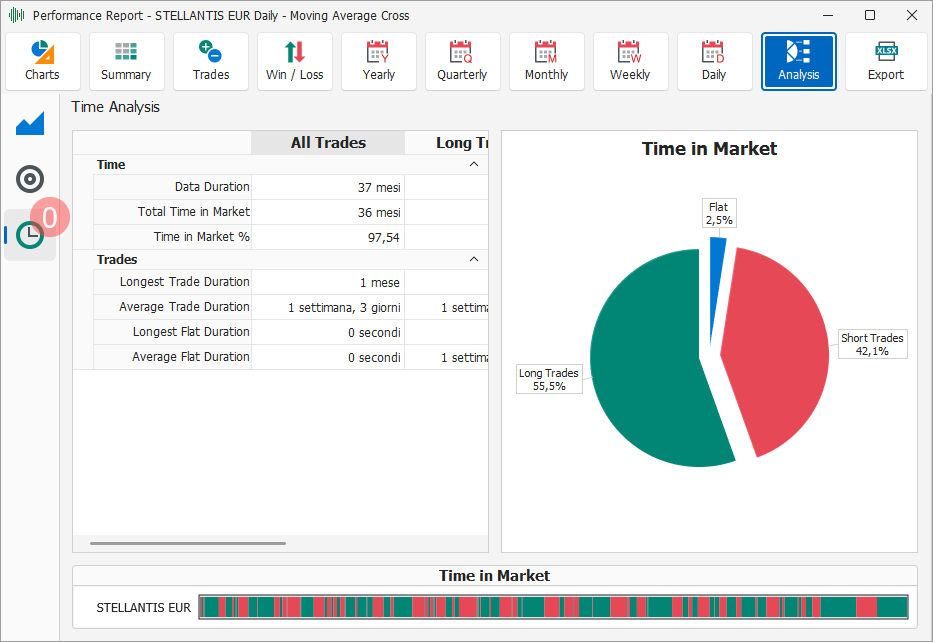
This view shows the values of the time analysis of the trades executed by the trading system. The view is divided into different sections, at the top right a table that shows the results of the analysis in numerical/textual form, at the top left a pie chart and finally in the lower section a horizontal chart of the market position over time. The table divides the results based on the type of trades:
All Trades - Shows the results for all types of trades, both Long and Short;
Long Trades - Shows the results of all and only Long trades;
Short Trades - Shows the results of all and only Short trades.
For each type of trade there is a column in the table, while the rows show the following analysis results, grouped by category:
Time
Data Duration - Time duration of the historical data on which the trading system was executed;
Total Time in Market - Total time during which an Open Position was present;
Time in Market % - Ratio between Total Time in Market and Data Duration, in percentage;
Trades
Longest Trade Duration - Maximum duration of trades;
Average Trade Duration - Average duration of trades;
Longest Flat Duration - Maximum duration of periods in which an Open Position was not present;
Average Flat Duration - Average duration of periods in which an Open Position was not present.
The pie chart in the top right section of the view represents the Time in Market, dividing the periods during which:
Long Trades - A Long Open Position was present;
Short Trades - A Short Open Position was present;
Flat - There were no Open Positions;
The horizontal graph at the bottom shows the presence or absence of Open Positions over time. A green segment represents a Long Open Position, a red segment a Short Open Position, while the lack of a color indicates the corresponding lack of an Open Position.
Export
This command allows you to export all the data of the Performance Report into a file compatible with Microsoft Excel ®. The exported file divides the data into different worksheets within the file, replicating as much as possible the same table view that can be seen in the Performance Report within MarvelChart. By clicking on the Export button the current view is not changed.