Aggregated Performance Report
Last modified: 19 March 2025
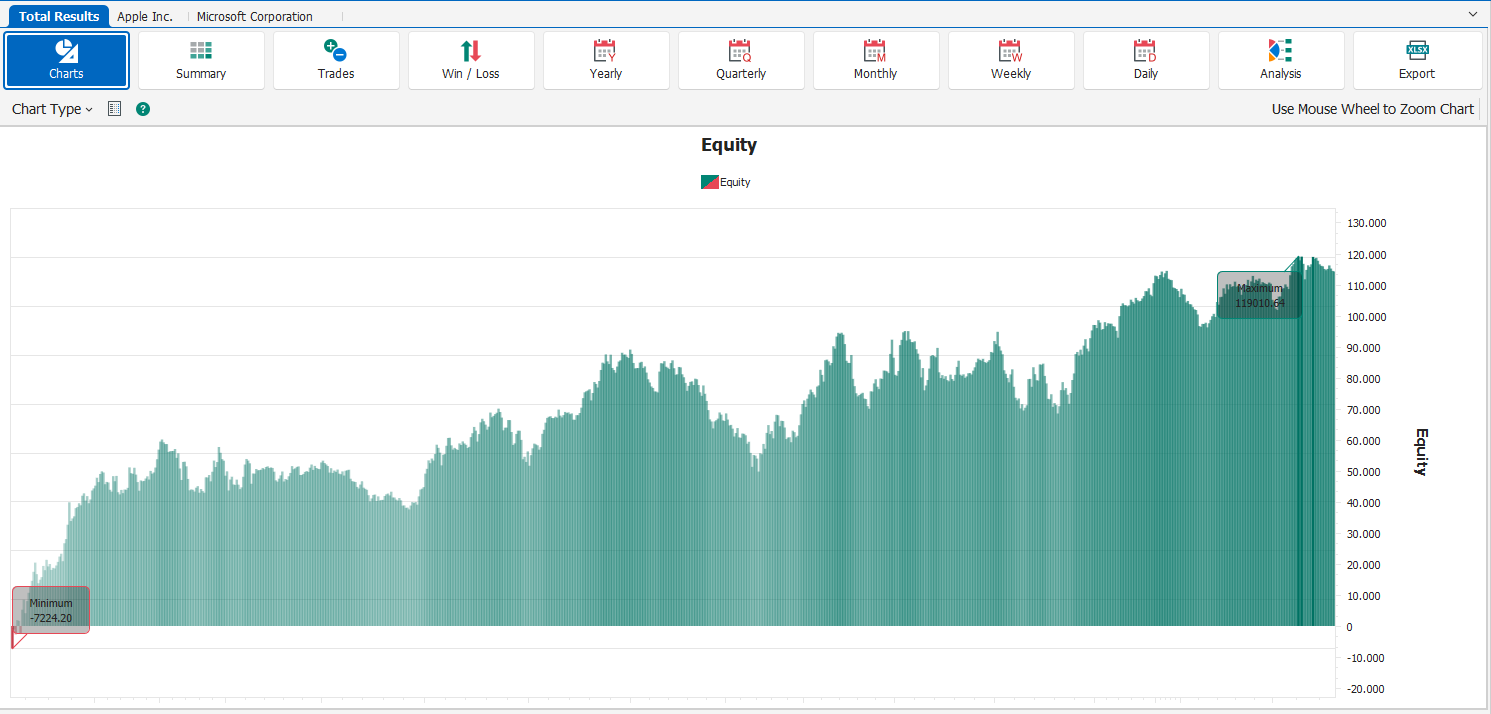
The Aggregate Performance Report shows the results of a Backtest performed on multiple symbols at the same time. It is composed of different tabs that show the overall aggregate results and the results for each of the symbols included in the Backtest. Each tab, both the one for the total results and those for the results of the individual symbols, are made up of simple Performance Reports, with minimal variations.
note
This chapter will only describe the aspects that differ between the simple Performance Report and its use within an Aggregate Performance Report. Please refer to the chapter on the Simple Performance Report for more information,
Total Results
In this tab you can see the overall results for all the symbols on which the trading system has been applied. It is the main tab of the Aggregate Performance Report, because it contains the aggregate data for all the symbols. It consists of a simple Performance Report with small variations.
Charts
Entry Efficiency / Exit Efficiency / Total Efficiency / Trades Profit/Loss / Run-Up and Draw-Down / Run-Up and Profit/Loss / Draw-Down and Profit/Loss
Compared to the same charts on the simple Performance Report, in the Aggregate Performance Report for each trade more dots or more bars can be drawn, one for each symbol on which the trading system has been applied.
Summary
Compared to the simple Performance Report, the Summary tab divides the results differently. There is a Total column that shows the total results of all symbols, in addition to which there is a column for each symbol that shows the results of the symbol itself.
Analysis
Time Analysis
The horizontal Time in Market chart has a row for each symbol to which the trading system has been applied.
Results of a specific symbol
There is an additional view, Hist. Chart, that shows the Chart of the symbol with the relative markers of the orders executed by the trading system and any indicators. In this chart many features are disabled as it is used as a chart for consulting and displaying orders.