Volume Overlay
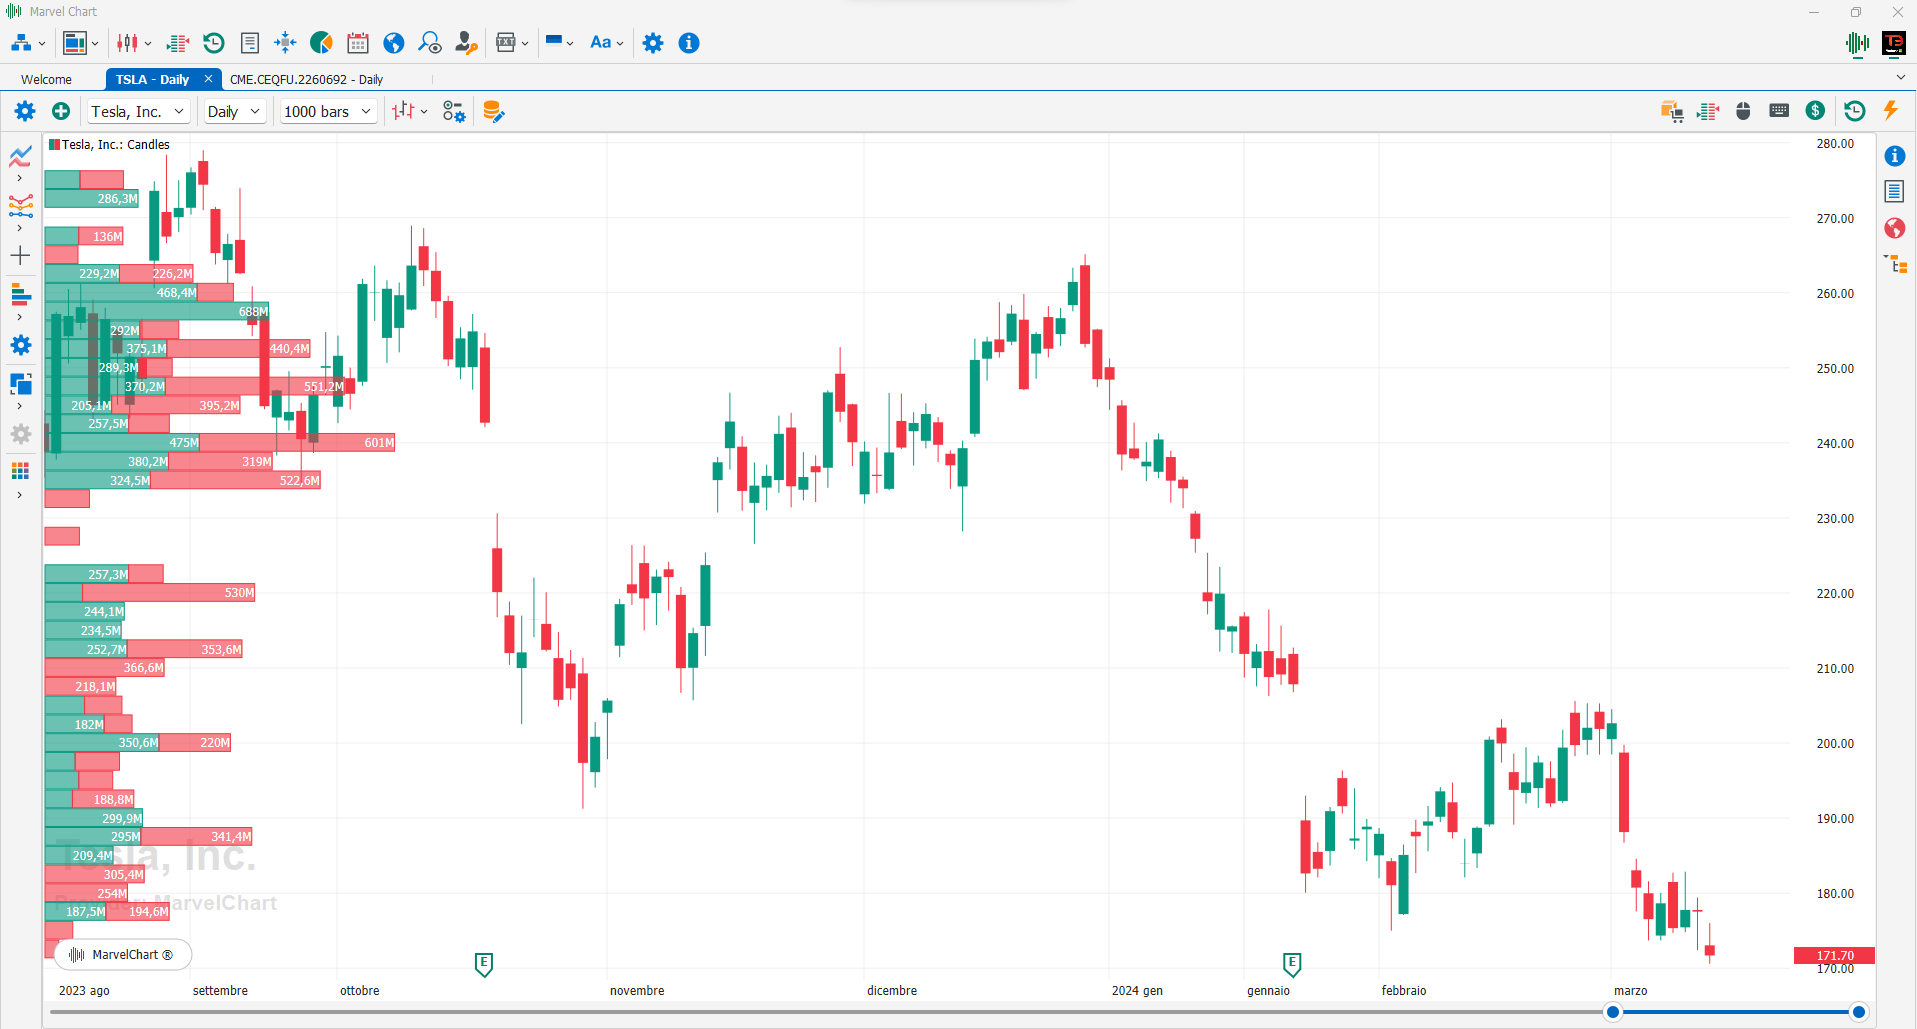
Volume Overlays are studies based on trading volumes that can be added to the Chart in order to provide an analysis of which price levels may have greater importance than others, such as making them valid supports or resistances. To add Volume Overlays to the Chart, you need to use the relative command in the toolbar of the Chart. Volume Overlay studies can represent trading volume in several ways:
Volume Overlay and Cross-Hair functionality
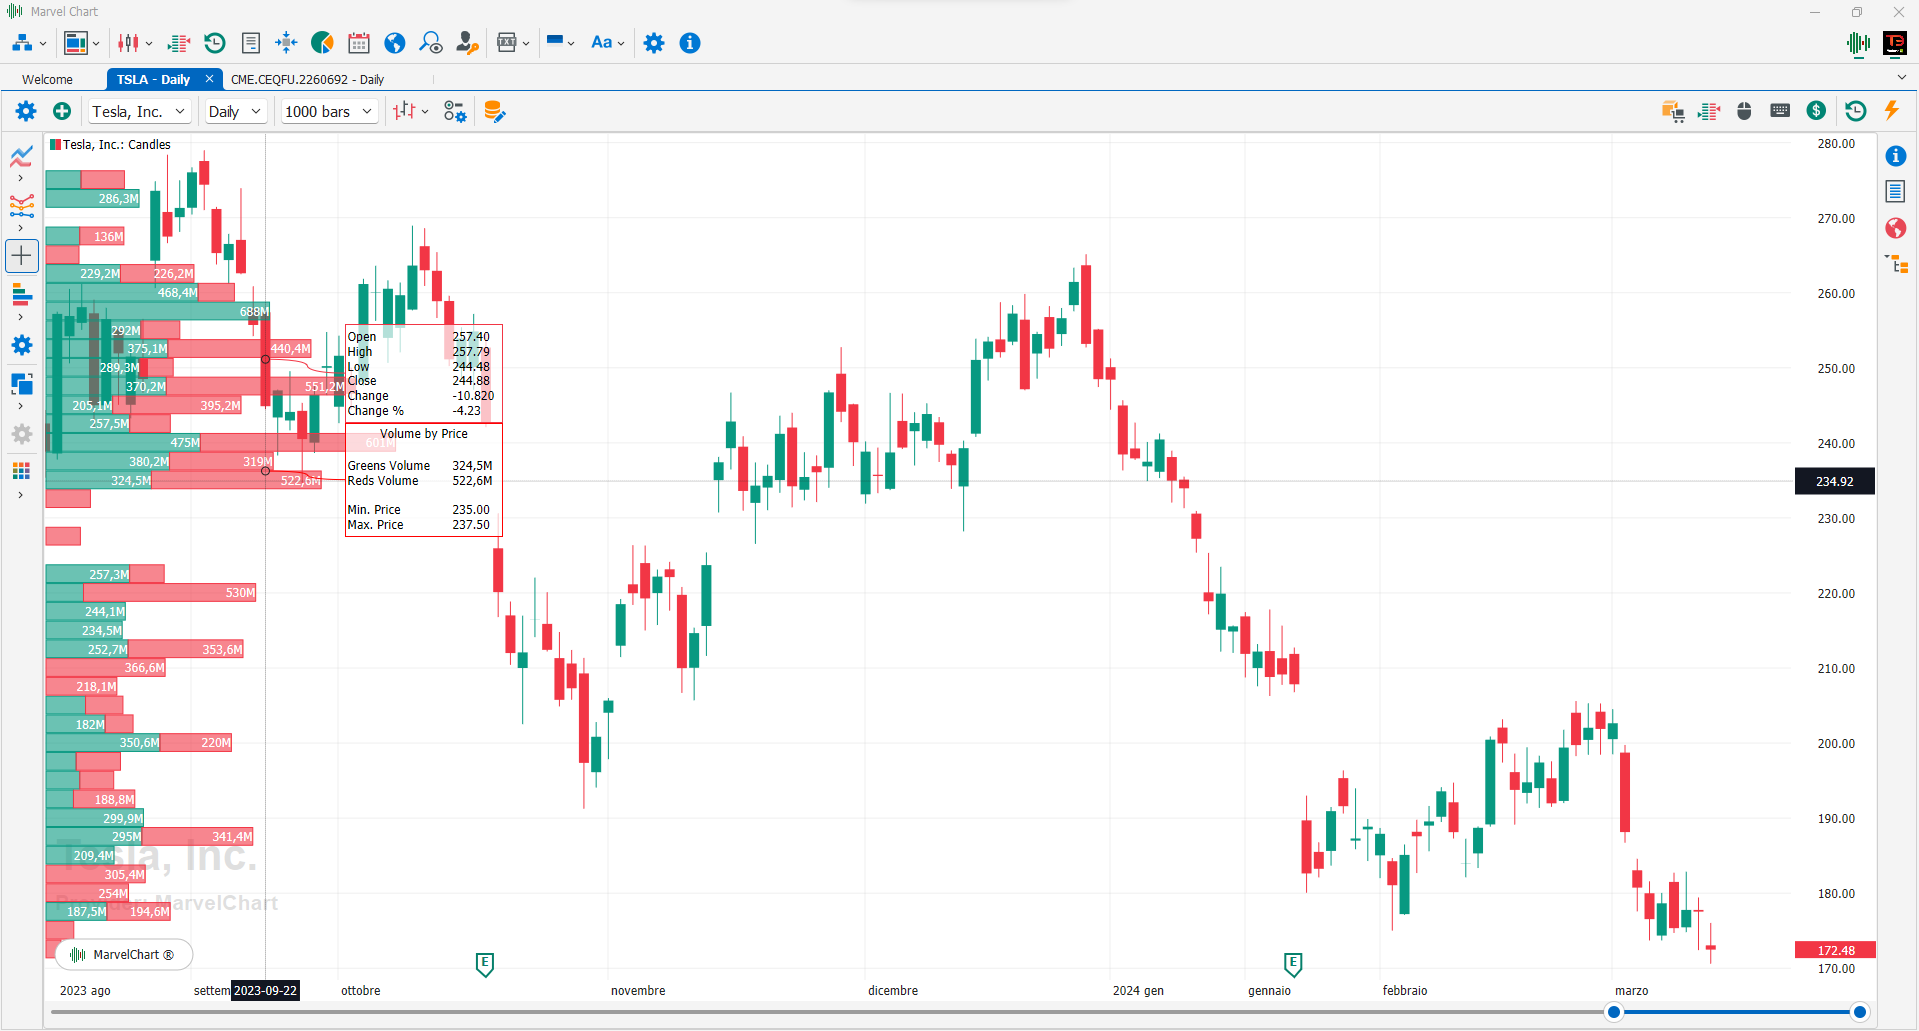
Using the Crosshair feature of the Chart and moving the mouse pointer over the drawing elements of a Volume Overlay study you can display the numerical data of the element itself. The displayed numerical data changes based on the type of Volume Overlay used.
Volume Overlay Commands
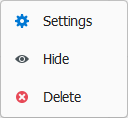
Left clicking on a Volume Overlay header will bring up a menu containing the following items:
Settings — Displays a window with settings for the selected Volume Overlay;
Hide/Show — Hides or shows the Volume Overlay on the Chart. When a Volume Overlay is hidden, it is not drawn on the chart, but its header remains visible at the top of the chart panel where it is present;
Delete — Delete the Volume Overlay from the Chart.
Real-Time
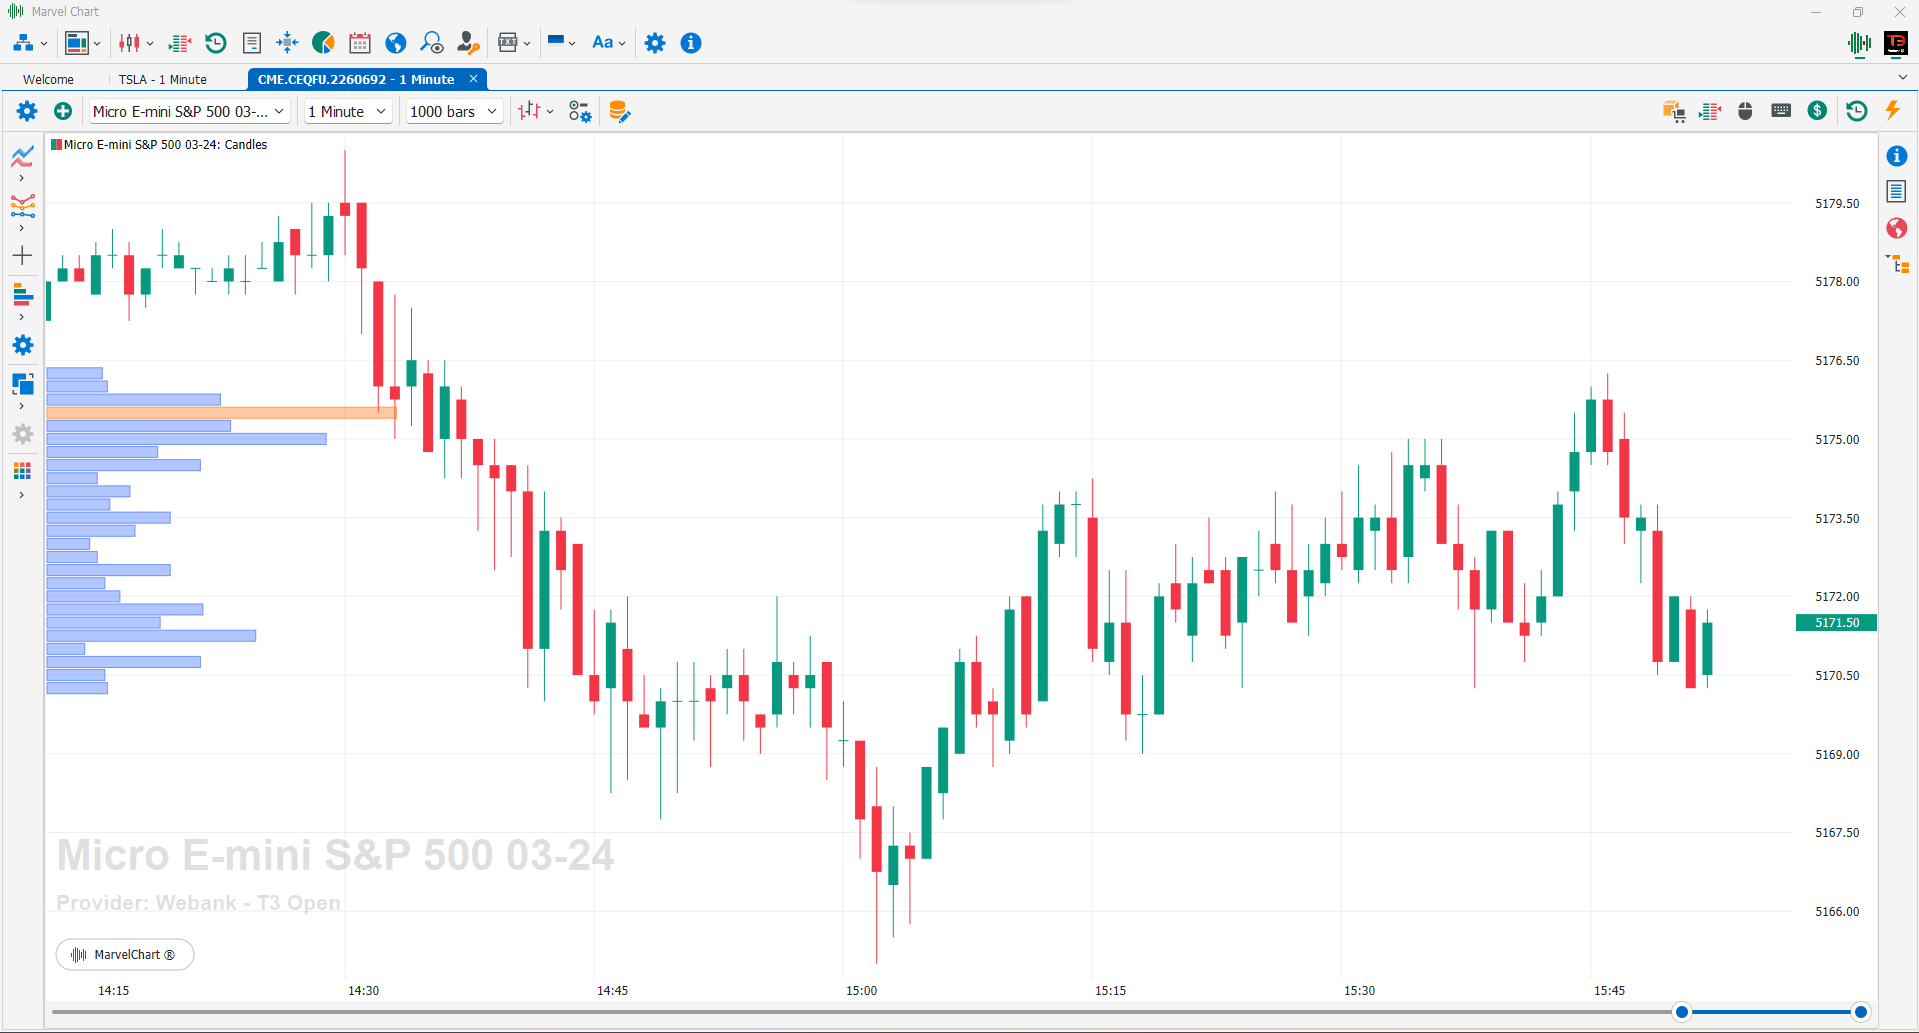
In Real-Time mode, the study of volumes uses the relative data received from the market from the moment the functionality is activated, not taking into consideration historical data on volumes. It is represented by horizontal histograms, whose Y coordinate represents the price at which the volumes were traded, while the length of the histogram represents the sum of the volumes traded at that price. It is particularly suitable for Charts with very short Time-Frames, while with long Time-Frames this Volume Overlay loses its meaning: the drawing will tend to be concentrated in a very narrow area of the price axis compared to the one normally displayed.
Settings
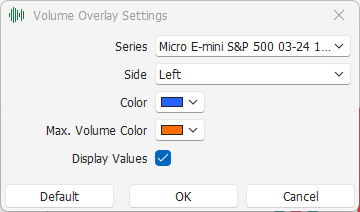
Selection of the historical series on which to perform the study;
Side of the Chart on which to draw the study;
Color of the histogram bars;
Highlight color of the longest histogram;
Checkbox, to show/hide the numerical value of the traded volumes within the histogram bars. If the text of the numeric value is larger than the histograms, the numeric values will still not be displayed.
Time Range Volume
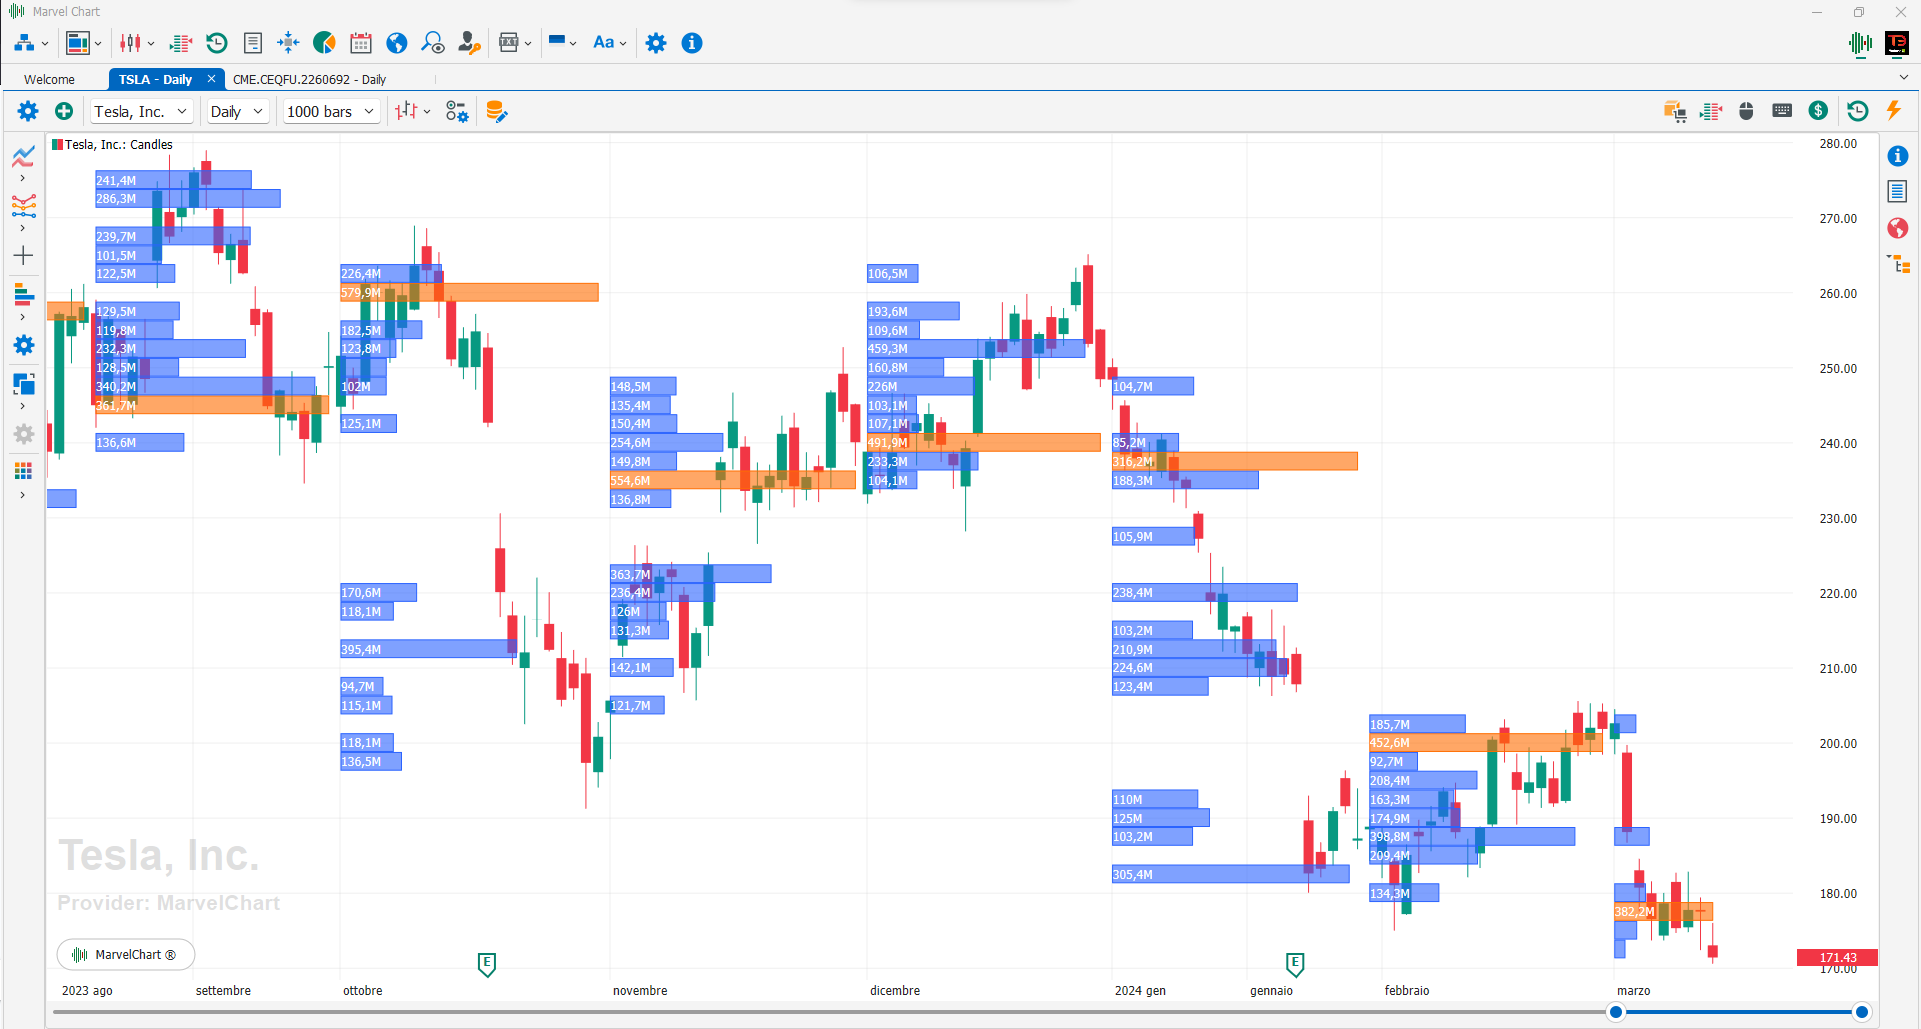
In Time Range Volume mode, the study of volumes uses the relative historical data as a basis for calculation and drawing. The subsequent real-time data contribute to the calculation and drawing of only the last group of histograms. It is represented by groups of horizontal histograms, whose Y coordinate represents the price at which the volumes were traded, while the length of the histogram represents the sum of the volumes traded at that price. Each group of histograms constitutes a time interval, whose size is always greater than the Time Frame of the Chart, in order to aggregate the volumes of a series of historical bars in a group of histograms. It can be used profitably with any TimeFrame.
Settings
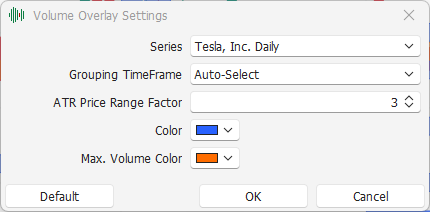
Selection of the historical series on which to perform the study;
Time Frame of aggregation of historical data, must always be greater than the Time Frame of the Chart. The Auto-Select item is always available, which automatically selects the aggregation TimeFrame, starting from the Time Frame of the Chart;
Scale ratio to determine the vertical amplitude of each histogram on the Chart. The lower this value, the wider the range of prices that a single histogram contains;
Color of the histogram bars;
Highlight color of the longest histogram of each single group.
Volume by Price
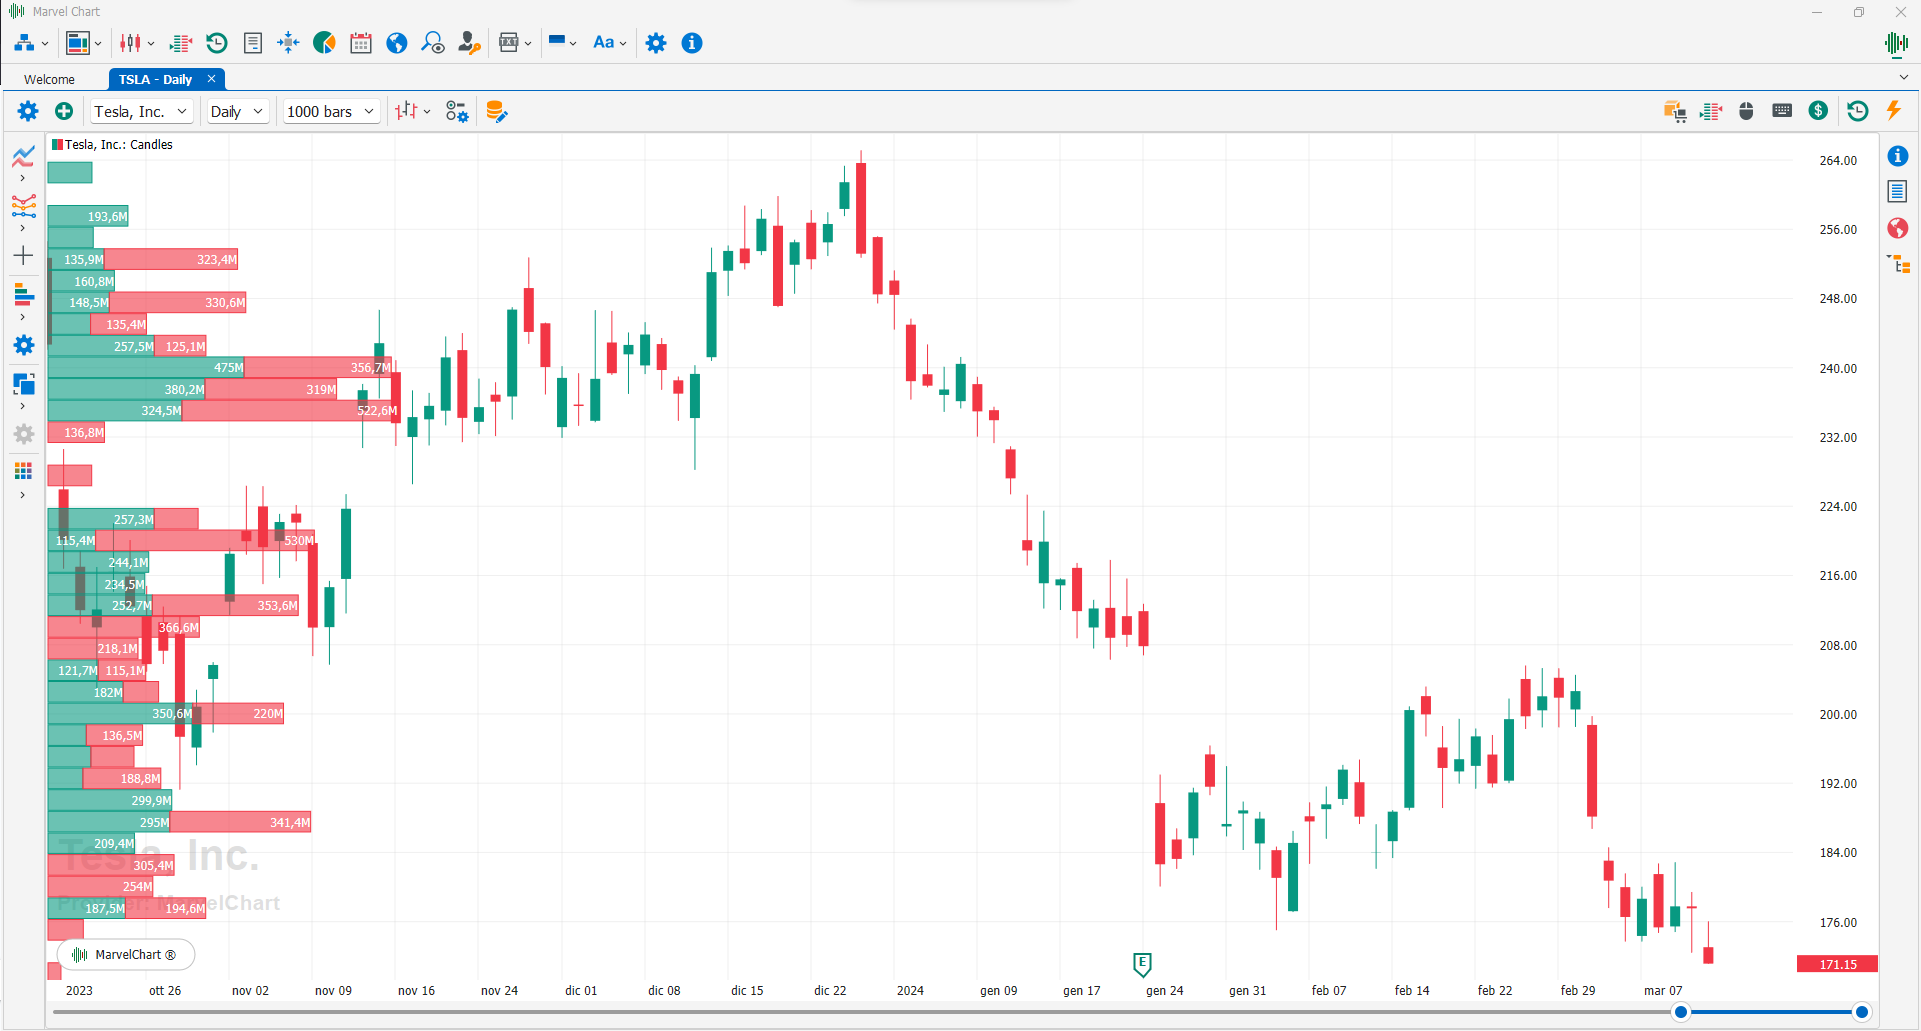
In Volume by Price mode, the study of volumes uses both the related historical data and real-time data for calculation and drawing. It is represented by horizontal histograms, whose Y coordinate represents the price at which the volumes were traded, while the length of the histogram represents the sum of the volumes traded at that price. For each price level there are two distinct histograms, one for the Buy direction and the other for the Sell direction. The direction is determined by the Open and Close prices of the historical bars, Buy for bars where Close is greater than Open, Sell for bars where Close is less than Open. The two histograms are added together in order to also display the total volume traded at that price level. It can be used profitably with any TimeFrame.
Settings
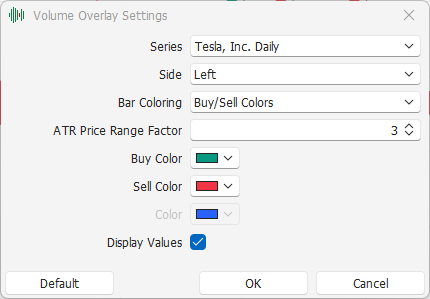
Selection of the historical series on which to perform the study;
Side of the Chart on which to draw the study;
Type of coloring to use in drawing the histograms. The available alternatives are:
Buy/Sell Colors - draws two histograms for each price level, one for the Buy direction and one for the Sell direction, which add together to show the total volume traded;
Uniform Color - draws a single histogram for each price level that shows the total volume traded;
Color of the histograms relating to the Buy direction (only if Bar Coloring is selected as Buy/Sell Colors);
Color of the histograms related to the Sell direction (only if Bar Coloring is selected as Buy/Sell Colors);
Color of the histograms related to the total volume (only if Bar Coloring is selected as Uniform Color);
Checkbox, to show/hide the numerical value of the traded volumes inside the histogram bars. If the text of the numerical value should have a larger size than the histograms, the numerical values will not be shown anyway.