Open Positions

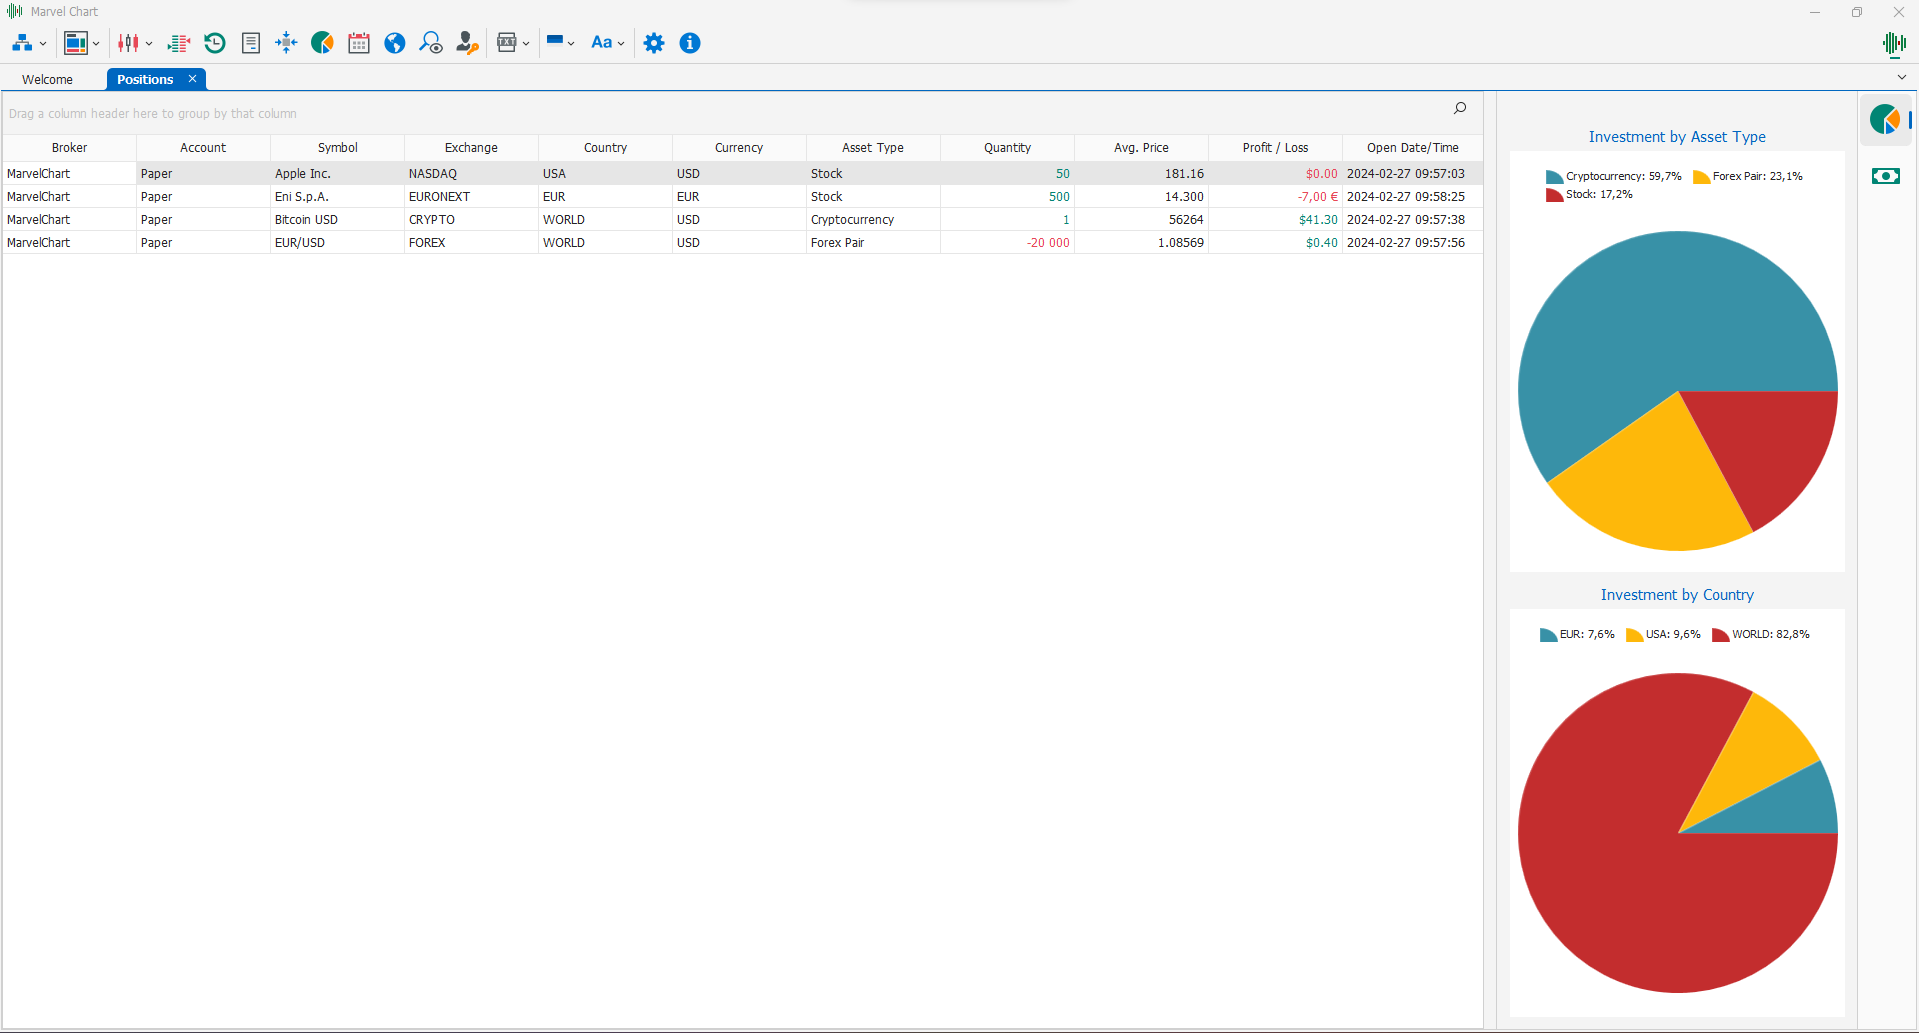
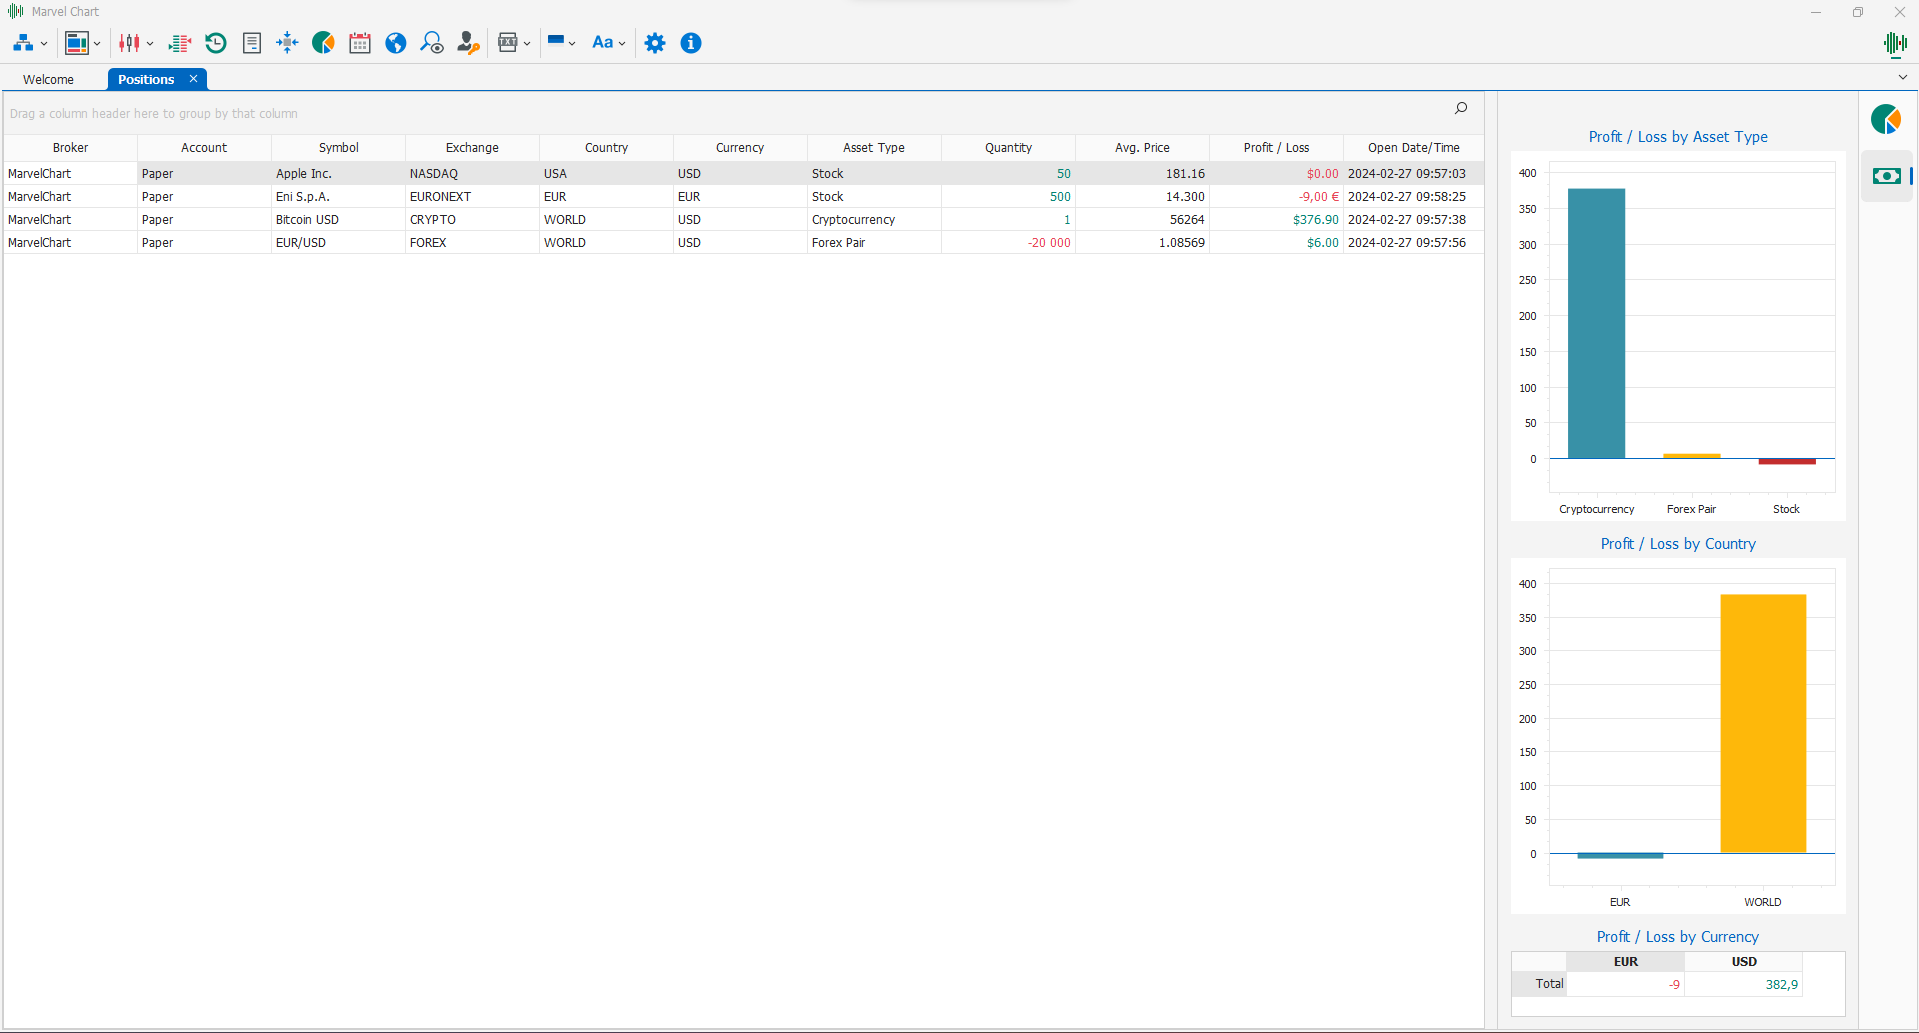
The Positions feature displays a list of Open Positions 1 accompanied by summary charts. If MarvelChart is launched in Live Trading mode, the Open Positions present on all accounts of all brokers currently connected to MarvelChart are displayed. If MarvelChart is launched in Paper Trading mode, the Open Positions shown in this document are exclusively those derived from MarvelChart's internal Paper-Trading system. For more information on the features available for the list of Open Positions 1, see the chapter Data Grid Features. On the right side of the document there are summary charts, divided into two tabs. The tabs can be activated via the Investment 2 and Profit/Loss 3 buttons at the top right.
Summary Charts - Investment

The Investment summary charts show how the investments that have been supported for the Open Positions are distributed, in terms of asset type 1 and country and/or geographical area of origin of the assets 2.
Summary Charts - Profit/Loss

The Profit/Loss summary charts show how the Profit/Loss generated by Open Positions is distributed in terms of asset type 1 and in terms of country and/or geographical area of origin of the assets 1. In this section there is also a table 3 that shows the Profit/Loss values divided by currency. All Profit/Loss values are calculated using the Real-Time prices of the assets, therefore they are dynamic values, which vary continuously over time.