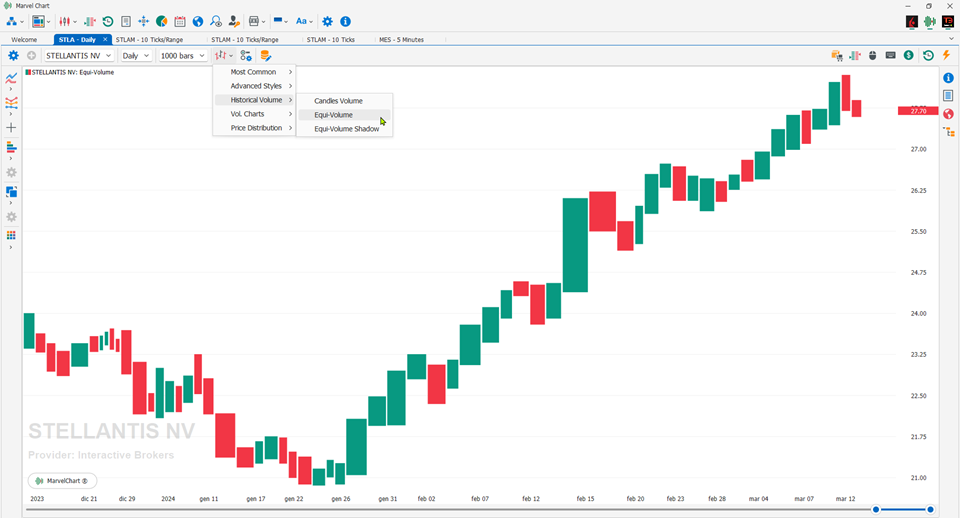
Equi-Volume

The Equi-Volume analysis links together the sources of information of the price range and the traded volume in order to highlight the market situations. The graphic construction of the Equi-Volume chart is very particular, the volume data is moved from the base of the chart (where they are found in the bar chart) to be included in the price representation.
Source: Traderpedia
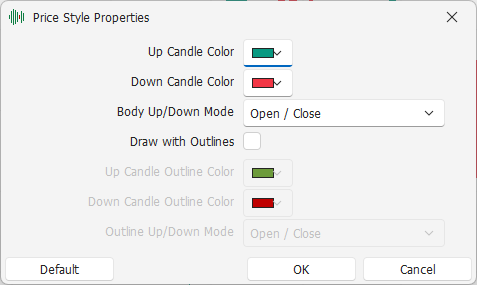
Settings

Up Candle Color: color to draw the Real-Body of rising candles;
Down Candle Color: color to draw the Real-Body of falling candles;
Body Up/Down Mode: mode with which to calculate the direction of the candle, whether Up or Down. The available alternatives are
Open / Close - Calculates the Up/Down direction of the candle using the Open and Close prices of the candle itself;
Prev. Close / Close - Calculates the Up/Down direction of the candle using the Close prices of the previous and current candle;
Draw with Outlines: if active, the Real-Body of the candles is drawn with a colored border;
Up Candle Outline Color: rising candles border color;
Down Candle Outline Color: falling candles border color;
Outline Up/Down Mode: Mode with which to calculate the direction of the candle for drawing outlines, whether Up or Down. See Body Up/Down for the list of available alternatives.