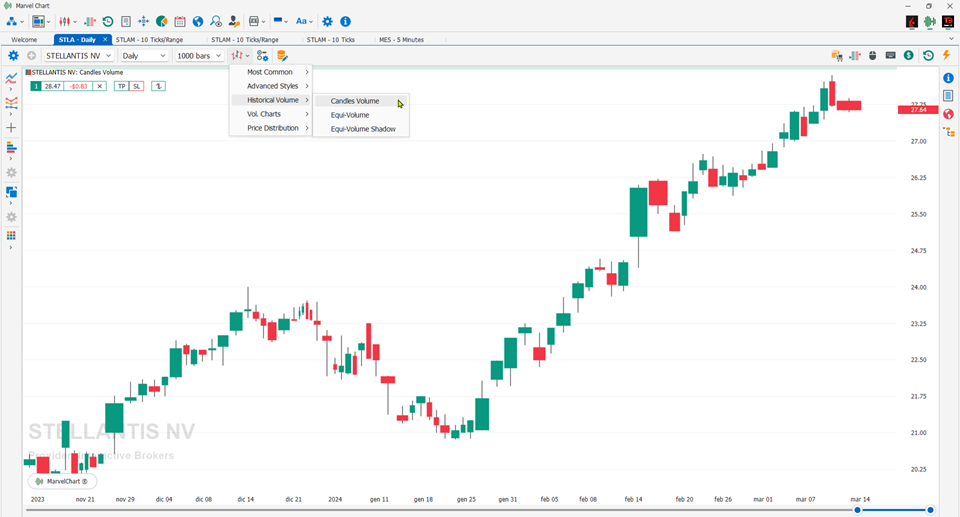
Candles Volume

The Candle Volume chart is a sort of hybrid between the Equi-Volume Arms chart and the Candlestick chart. To be traced, it requires the opening, closing, minimum, maximum and trading volume data. It has all the characteristics of the classic Candlestick chart with the particularity of being able to inflate in direct relation to the trading volume; the more interest there is in the title (in the form of trades) the wider the real body of the Candles Volume chart will be.
Source: Traderpedia
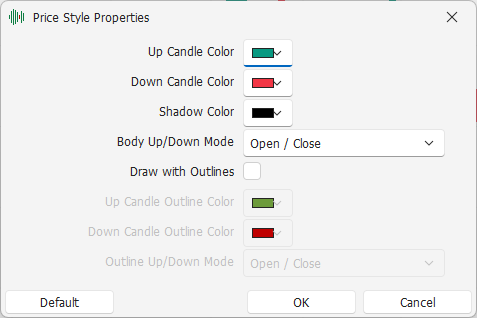
Settings

Up Candle Color: color to draw the Real-Body of rising candles;
Down Candle Color: color to draw the Real-Body of falling candles;
Shadow Color: color to draw the lower and upper shadows of candles;
Body Up/Down Mode: mode with which to calculate the direction of the candle, whether Up or Down. The available alternatives are
Open / Close - Calculates the Up/Down direction of the candle using the Open and Close prices of the candle itself;
Prev. Close / Close - Calculates the Up/Down direction of the candle using the Close prices of the previous and current candle;
Draw with Outlines: if active, the Real-Body of candles is drawn with a colored border;
Up Candle Outline Color: rising candles border color;
Down Candle Outline Color: falling candles border color;
Outline Up/Down Mode: Mode with which to calculate the direction of the candle for drawing outlines, whether Up or Down. See Body Up/Down for the list of available alternatives.