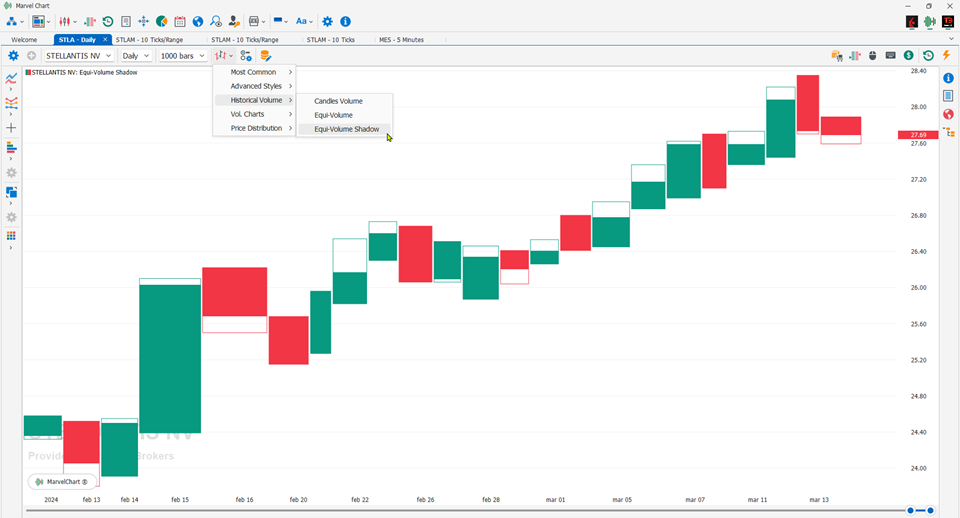
Equi-Volume Shadow

It is a type of chart derived from Equi-Volume, but introduces the drawing of the closing price, in order to determine for each bar the presence or absence of a shadow. For candles with a Close price higher than the Open price, the upper shadow will be highlighted, while for candles with a Close price lower than the Open price, the lower shadow will be highlighted. The shadows are represented by “empty” areas inside the candles. The more the candles are “full”, the stronger the trend.
Settings

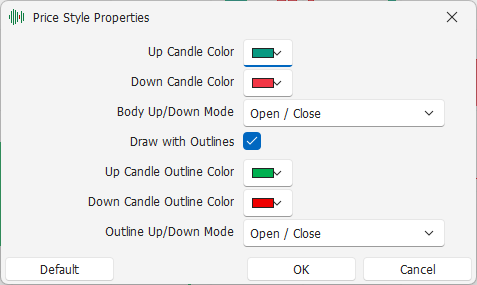
Up Candle Color: color to draw the Real-Body of rising candles;
Down Candle Color: color to draw the Real-Body of falling candles;
Body Up/Down Mode: mode with which to calculate the direction of the candle, whether Up or Down. The available alternatives are
Open / Close - Calculates the Up/Down direction of the candle using the Open and Close prices of the candle itself;
Prev. Close / Close - Calculates the Up/Down direction of the candle using the Close prices of the previous and current candle;
Draw with Outlines: if active, the Real-Body of the candles is drawn with a colored border;
Up Candle Outline Color: rising candles border color;
Down Candle Outline Color: falling candles border color;
Outline Up/Down Mode: Mode with which to calculate the direction of the candle for drawing outlines, whether Up or Down. See Body Up/Down for the list of available alternatives.