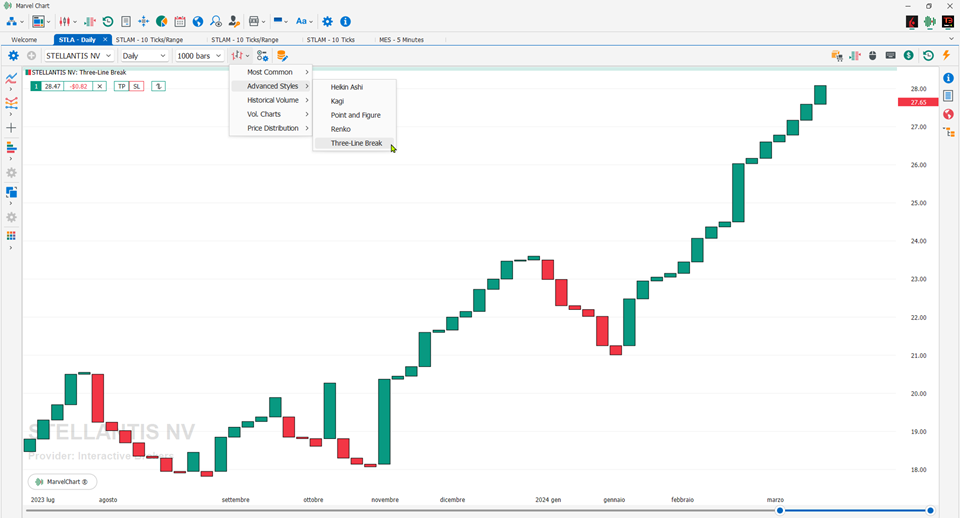
Three-Line Break

The Three Line Break chart has a particular construction: green or red columns are drawn on the chart depending on the directionality and the formation of new highs or new lows of the stock. The only price taken into consideration is the closing price, if the closing is higher than the previous high a new green column will be generated, if it is lower than the previous low a new red column will be generated, nothing will be done if there are no new highs or new lows.
Source: Traderpedia
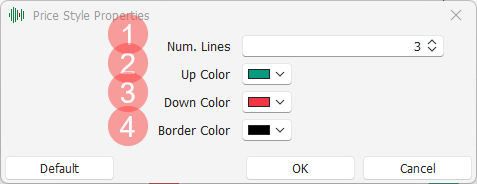
Settings

Num. Lines: minimum number of "lines" to identify a trend reversal;
Up Color: color to draw the blocks that identify an upward trend;
Down Color: color to draw the blocks that identify a downward trend;
Border Color: color to draw the edges of the blocks;
07 April 2025