Renko

A Renko chart (Japanese: 練行足, romanized: renkōashi, also written 練り足, neriashi) is a type of financial chart of Japanese origin used in technical analysis that measures and plots price changes. A Renko chart consists of blocks (煉瓦, renga, or bricks in English), which proponents claim clearly show different market trends and increase the signal-to-noise ratio compared to a typical Candlestick chart.
Source: Wikipedia
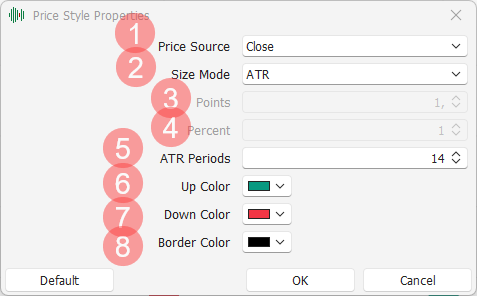
Settings

Price Source: choice of which price to use in the chart calculation, between Close and OHLC average price;
Size Mode: choice of which method to use to calculate the price deviations that determine changes in the trend. The available choices are:
Points: number of points or price value, settable in the “Points” parameter;
Percent: percentage value compared to the previous price, settable in the “Percent” parameter;
ATR: Average True Range, which allows you to have a chart setting that is always valid because it is self-adaptive. It is possible to set the number of periods with which to calculate the Average True Range in the “ATR Periods” parameter;
Points: if “Size Mode” is set to “Points”, number of points or price value that determines a change in the trend;
Percent: if “Size Mode” is set to “Percent”, percentage value compared to the previous price that determines a change in the trend;
ATR Periods: if “Size Mode” is set to “ATR”, number of periods with which to calculate the Average True Range, whose value represents the minimum range of price movement that determines a change in the trend;
Up Color: color with which to draw the segments that represent an upward trend;
Down Color: color with which to draw the segments that represent a downward trend;