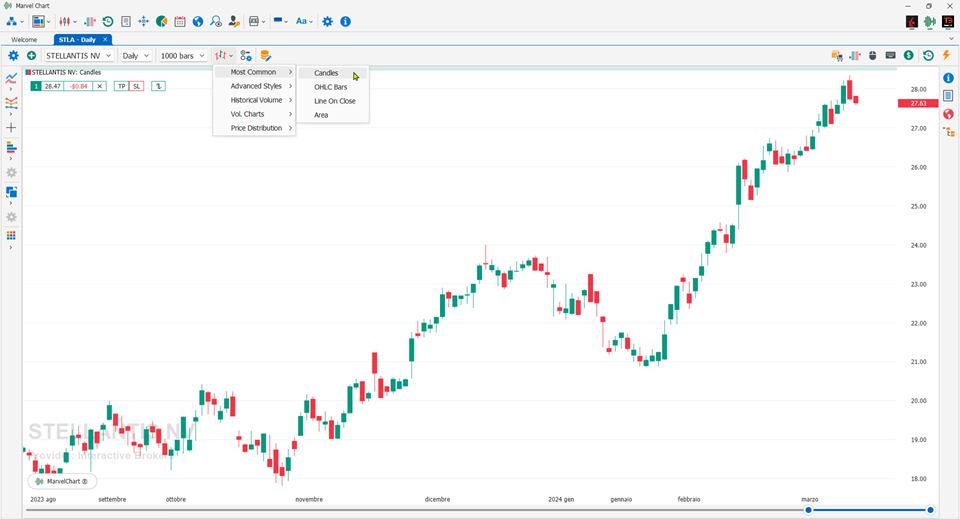
Candles

This type of chart is also commonly called Candlestick or Japanese candles. They were first used in Japan in the 18th century to predict the price of rice. At that time, there were already futures contracts that were intended to unite the needs of producers with traders. The inventor, Munehisa Homma, earned a fortune thanks to this method and used war terms used in battle to provide terms for technical representations. The method arrived in Europe in 1989 thanks to Steve Nison who published various rules in his famous book Japanese Candlestick Charting Techniques. Today it is the most used graphic display method by traders.
Source: Wikipedia
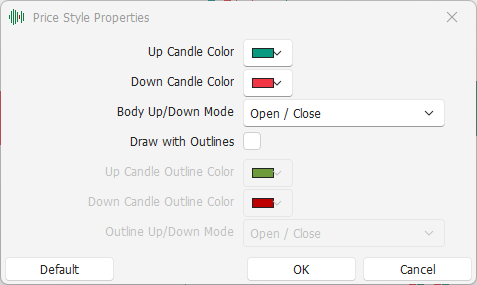
Settings

Up Candle Color: color to draw the Real-Body of rising candles;
Down Candle Color: color to draw the Real-Body of falling candles;
Body Up/Down Mode: mode with which to calculate the direction of the candle, whether Up or Down. The available alternatives are
Open / Close - Calculates the Up/Down direction of the candle using the Open and Close prices of the candle itself;
Prev. Close / Close - Calculates the Up/Down direction of the candle using the Close prices of the previous and current candle;
Draw with Outlines: if active, the Real-Body of candles is drawn with a colored border;
Up Candle Outline Color: rising candles border color;
Down Candle Outline Color: falling candles border color;
Outline Up/Down Mode: Mode with which to calculate the direction of the candle for drawing outlines, whether Up or Down. See Body Up/Down for the list of available alternatives.