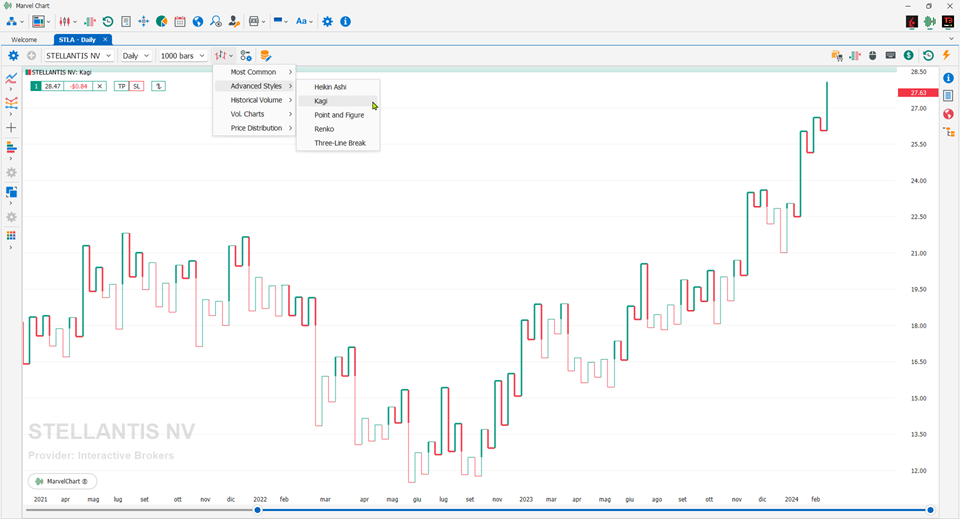
Kagi

The Kagi chart is used to monitor price changes, and differs from traditional charts such as Candlesticks and OHLC in that the Kagi is almost completely independent of time. This feature helps produce a chart design that reduces “background noise”.
Source: Wikipedia
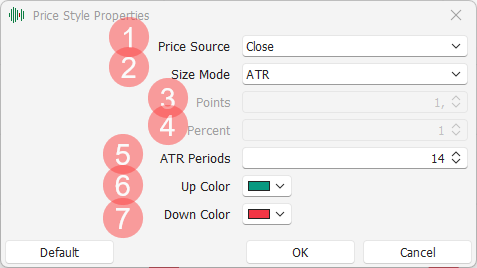
Settings

Price Source: choice of which price to use in the chart calculation, between Close and OHLC average price;
Size Mode: choice of which method to use to calculate the price deviations that determine changes in the trend. The available choices are:
Points: number of points or value in price, settable in the “Points” parameter;
Percent: percentage value compared to the previous price, settable in the “Percent” parameter;
ATR: Average True Range, which allows you to have a chart setting that is always valid because it is self-adaptive. It is possible to set the number of periods with which to calculate the Average True Range in the “ATR Periods” parameter;
Points: if “Size Mode” is set to “Points”, number of points or price value that determines a trend change;
Percent: if “Size Mode” is set to “Percent”, percentage value compared to the previous price that determines a trend change;
ATR Periods: if “Size Mode” is set to “ATR”, number of periods with which to calculate the Average True Range, whose value represents the minimum range of price movement that determines a trend change;
Up Color: color with which to draw the segments that represent an upward trend;
Down Color: color with which to draw the segments that represent a downward trend;