Footprint

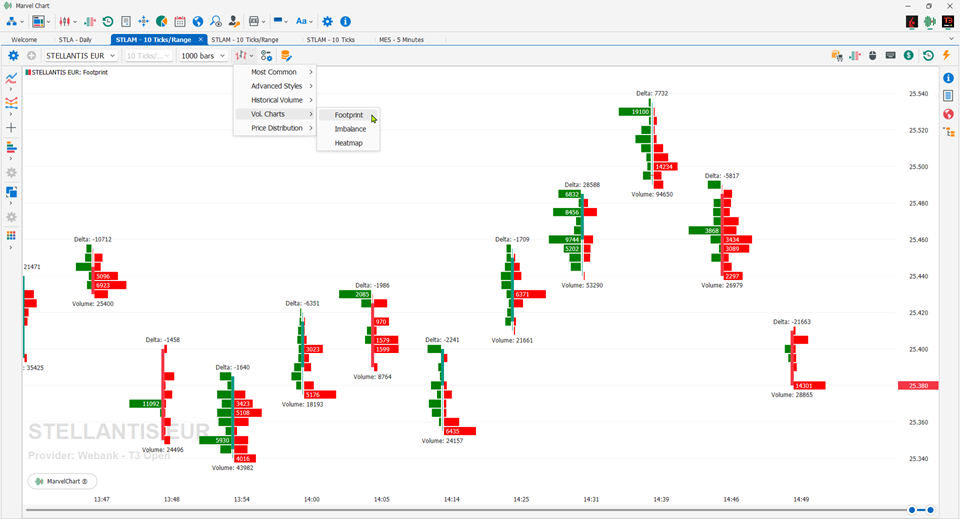
Footprint is the footprint that volumes give to the market. By analyzing the actions of buyers and sellers, the trader can identify a direction of the market. Keep in mind that volume analysis is a fairly recent method for viewing asset charts, in fact, it was introduced only 20 years ago and is the only real indicator that has a delay in calculation equal to zero.
Settings
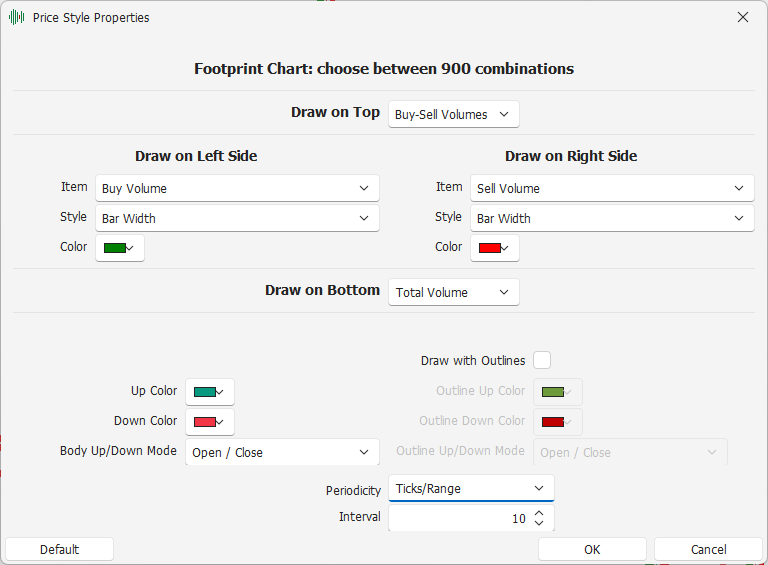
The Footprint chart can be configured in 900 different combinations, so it can be adapted to the needs of any trader.

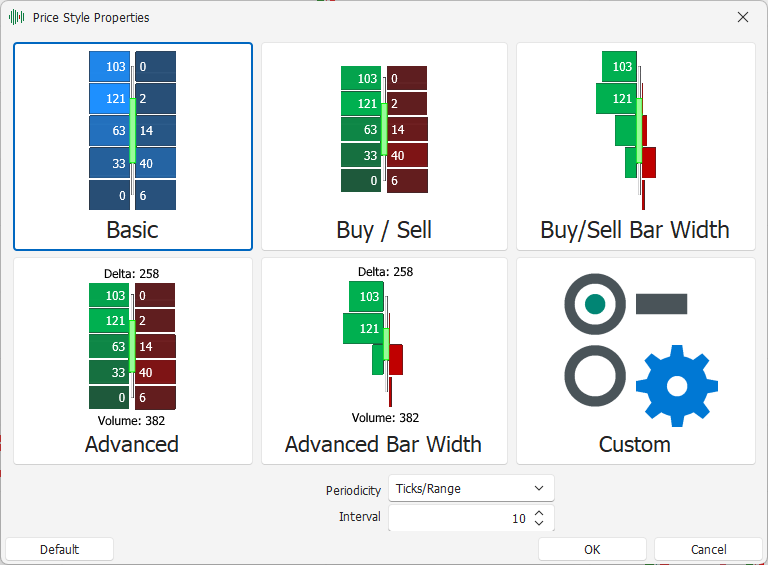
The Footprint chart style, given the numerous combinations of settings available, has 5 pre-configured templates:
Basic - displays the purchase and sale volumes with the same color using transparency, more opacity means higher volumes, more transparency indicates lower volumes;
Buy/Sell - displays the purchase and sale volumes with two different colors using transparency, more opacity means higher volumes, more transparency indicates lower volumes;
Buy/Sell Bar Width - displays the purchase and sale volumes with two different colors using the length of the bars to represent the volumes, longer bars indicate higher volumes, shorter bars indicate lower volumes;
Advanced - like Buy/Sell, but also shows the Delta, i.e. the difference between the buy and sell volumes, at the top of the candles, and the total volume at the bottom of the candles, both displayed as simple texts;
Advanced Bar Width - like Buy/Sell Bar Width, but also shows the Delta, i.e. the difference between the buy and sell volumes, at the top of the candles, and the total volume at the bottom of the candles, both displayed as simple texts.
TimeFrame: configure the TimeFrame of the historical data to be used in the Chart. The recommended timeFrame is Ticks/Range at 10 ticks.
By clicking on one of these choices, the chart will be set as shown in the relative previews. The last button allows you to access the custom configuration of the chart.
Custom Footprint chart configuration

When you choose to customize the appearance of the Footprint style, the detailed settings tab will be displayed, which has the following items:
Draw On Top: choice of which value to display above each candle in the chart;
Draw on Bottom: choose which value to display under each candle in the chart;
Draw on Left Side: define the candle left side drawing item;
Draw on Right Side: define the candle right side drawing item;
The 2 settings “Draw On Top” and “Draw On Bottom” concern the overall values of the candle, including all the different price levels, and are always displayed as plain text. The available choices are:
None: does not display any value;
Buy-Sell Volumes: difference between the purchase and sale volumes, displayed as “Delta”;
Delta %: difference between the purchase and sale volumes, expressed as a percentage of the total volume;
Total Buy Volume: purchase volumes of the candle;
Total Sell Volume: sale volumes of the candle;
Total Trades: total number of trades executed in the candle;
Total Volume: sum of candle buy and sell volumes;
The “Draw on Left Side” and “Draw on Right Side” settings concern the characteristics of each individual price level of the candle, and each has the following parameters:
Item: choice of which parameter to draw;
Style: choice of style to draw with;
Color: color to draw with;
For the “Item” setting, the available choices are:
None: does not draw any value;
Buy Trades: number of buy trades;
Buy Volume: buy volumes;
Buy Volume %: buy volumes, expressed as a % compared to the candle sum of buy and sell volumes for each price level;
Buy-Sell Vol. %: difference between the buy and sell volumes, expressed as a % compared to the sum of the buy and sell volumes of the individual price level of the candle;
Buy-Sell Volumes: difference between the candle buy and sell volumes for each price level;
Sell Trades: number of sell trades;
Sell Volume: sales volumes;
Sell Volume %: sales volumes, expressed as a % of the sum of the buy and sell volumes of the single price level of the candle;
Total Trades: number of buy and sell trades;
Total Volume: sum of the buy and sell volumes;
For the “Style” setting, the available choices are:
Bar Width: variable bar width, the higher the values to be displayed, the wider the displayed bar will be;
Delta Colored Bar Width: variable bar width, the higher the values to be displayed, the wider the displayed bar will be. Furthermore, the Delta, i.e. the difference between the purchase and sale volumes, determines the color, red or green, with which to draw the bar;
Delta Colored Transparency: constant bar width. The Delta, i.e. the difference between the purchase and sale volumes, determines the color, red or green, and the transparency with which to draw the bar;
Text Only: draws only the text;
Transparency: constant bar width, the higher the values to be displayed, the more opaque the bar will be;
In the lower section of the window there are the settings for drawing the actual candles.
Up Color: color to draw the Real-Body of rising candles;
Down Color: color to draw the Real-Body of falling candles;
Body Up/Down Mode: mode to calculate the direction of the candle, whether Up or Down. The available alternatives are
Open / Close - Calculate the Up/Down direction of the candle using the Open and Close prices of the candle itself;
Prev. Close / Close - Calculate the Up/Down direction of the candle using the Close prices of the previous and current candle;
Draw with Outlines: if active, the Real-Body of the candles is drawn with a colored border;
Outline Up Color: rising candles border color;
Outline Down Color: falling candles border color;
Outline Up/Down Mode: mode to calculate the direction of the candle for drawing the outlines, whether Up or Down. See Body Up/Down for a list of available alternatives.